Patterns of Species Richness and Diversity of Insects Associated With Cucurbit Fruits in
the Southern Part of Cameroon
Didi Gae
¨lle Mokam,
1,2,3Champlain Djie´to-Lordon,
2and Charles-Fe´lix Bilong Bilong
41
Faculty of Sciences, Department of Biological Sciences, University of Ngaoundere, P.O. Box 454, Ngaoundere, Cameroon 2
Laboratory of Zoology, Faculty of Sciences, Department of Animal Biology, University of Yaounde´ I, P.O. Box 812, Yaounde´, Cameroon 3
Corresponding author, e-mail: tawogaelle@yahoo.fr
4Laboratory of Parasitology and Ecology, Faculty of Sciences, Department of Animal Biology, University of Yaounde´ I, P.O. Box 812, Yaounde´, Cameroon
Subject Editor:Johanne Brunet
J. Insect Sci. 14(248): 2014; DOI: 10.1093/jisesa/ieu110
ABSTRACT.Patterns of species diversity and community structure of insects associated with fruits of domesticated cucurbits were in-vestigated from January 2009 to 2011 in three localities from two agroecological zones in the southern part of Cameroon. Rarefaction curves combined with nonparametric estimators of species richness were used to extrapolate species richness beyond our own data. Sampling efforts of over 92% were reached in each of the three study localities. Data collected revealed a total of 66 insect morphospe-cies belonging to 37 families and five orders, identified from a set of 57,510 insects. The orders Diptera (especially Tephritidae and Lonchaeidae) and Hymenoptera (mainly Braconidae and Eulophidae) were the most important, in terms of both abundance and species richness on the one hand, and effects on agronomic performance on the other. Values for both the species diversity (Shannon and Simpson) and the species richness indices (Margalef and Berger–Parker) calculated showed that the insect communities were species-rich but dominated, all to a similar extent, by five main species (including four fruit fly species and one parasitoid). Species abundance distributions in these communities ranged from the Zipf–Mandelbrot to Mandelbrot models. The communities are structured as tritro-phic networks, including cucurbit fruits, fruit-feeding species (fruit flies) and carnivorous species (parasitoids). Within the guild of the parasitoids, about 30% of species, despite their low abundance, may potentially be of use in biological control of important pests. Our field data contribute in important ways to basic knowledge of biodiversity patterns in agrosystems and constitute baseline data for the planned implementation of biological control in Integrated Pest Management.
Key Words: species diversity, species abundance distribution, fruit fly, parasitoid, ecological process
Pest insects are among the main constraints to fruit production in or-chards and crop gardens in tropical regions. According toScholtz and
Mansell (2009), pest insects account for about 50% of crop losses in
Africa, from plant establishment through growth, maturation, and stor-age. Although various studies deal with the feeding preferences of fruit-feeding insects (White 2006, Ndzana Abanda et al. 2008, Ngamo
Tinkeu et al. 2010), the impact of these pests, which are responsible for
millions of dollars in production losses each year (Scholtz and Mansell 2009), and strategies to manage them (Stonehouse et al. 2007,Jang
et al. 2008), few have focused on the species diversity of insect
commu-nities in fruit-based food webs or on the taxonomic composition and characterization of these communities. Rigorous analysis may help identify ecological mechanisms underlying the dynamics of pest insect populations in agrosystems, so that they can be managed more effec-tively and with fewer adverse effects on human consumers and on the environment (Allwood 1996).
Hence, biodiversity inventories need to be designed around the use of effective sampling and estimation procedures, especially for “hyperdiverse” groups of terrestrial organisms such as arthropods
(Colwell and Coddington 1994). Studies of ecological communities
re-quire ideally that individuals in a sample be properly identified to spe-cies level and counted (Gotelli 2004). However, this is not always possible, so that during identification, individuals are usually separated by morphotypes, treated as equivalent to species in species richness es-timations (Magurran 2004,McGill et al. 2007). Species richness is dif-ficult to quantify (Longino et al. 2002) but can be estimated by three different ways: 1) extrapolating species accumulative curves (SACs), 2) using nonparametric estimators to predict the number of ‘missing’ species, or 3) fitting statistical distributions such as species abundance distributions (SADs) (Colwell and Coddington 1994,Chao et al. 2009).
SACs allow measurement of within-inventory efficacy and complete-ness, and estimation of the minimum sampling effort required to reach a satisfactory level of completeness. Nonparametric estimators use the number of rare species in the community to predict the number of miss-ing species (Moreno and Halffter 2000). Based on SACs, effort is thus the total number of individuals collected, or the number of pooled sam-ples, necessary to reach the asymptotic species richness, whereas with species richness estimators, effort is the ratio between species richness observed and theoretical species richness. SADs capture the inequality of species abundances that characterizes ecological communities to highlight their structuring mechanisms (McGill et al. 2007). Based on ecological mechanisms shaping SADs, five biological models, includ-ing the broken stick or null model, niche preemption, lognormal distri-bution, Zipf, and Mandelbrot models are widely used. Species diversity, the most common representation of ecological diversity, uses mathematical indices broadly known as diversity indices, derived from combining information on richness and evenness (Hamilton 2005,
Schowalter 2006).
In this study, diversity of ecological communities was assessed within habitat (a diversity) and compared between habitats or land-scapes (b diversity) (Magurran 2004, Begon et al. 2006, Stireman 2008). This work aims to characterize patterns in the species composi-tion, spatial distribucomposi-tion, and community structure of insects associated with fruits of domesticated cucurbits in the southern part of Cameroon, to provide ecological knowledge useful for the implementation of Integrated Pest Management strategies of these pests in crop gardens.
Materials and Methods
Sampling Period and Localities. The study was conducted from January 2009 to 2011 in three localities from two agroecological zones
VCThe Author 2014. Published by Oxford University Press on behalf of the Entomological Society of America.
This is an Open Access article distributed under the terms of the Creative Commons Attribution-NonCommercial-NoDerivs licence (http://creativecommons.org/licenses/by-nc-nd/4.0/), which permits non-commercial reproduction and distribution of the work, in any medium, provided the original work is not altered or transformed in any way, and that the work properly cited. For commercial re-use, please contact journals.permissions@oup.com
RESEARCH
by guest on November 14, 2015
http://jinsectscience.oxfordjournals.org/
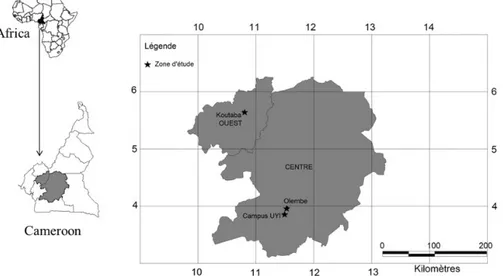
in the southern Cameroon (Fig. 1). 1) Koutaba, situated in the Western Highlands, with a unimodal humid tropical rainfall regime; the experi-mental parcels were located in the domain of the Catholic Monastery; 2) the Campus of the University of Yaounde´ I (hereafter termed Campus); and 3) Olembe, on the northern outskirts of Yaounde´. Sites 2 and 3 are both located on the Southern Plateau, with a bimodal humid tropical rainfall regime. The two agroecological zones differed in their topographic and climatic characteristics (Table 1), as well as in their agronomic systems. The plots of Olembe (surrounded by an old cocoa plantation, a swampy zone, and various market crop parcels) and Koutaba (surrounded by a mosaic of ornamental plantings, a strip of woodlands, and hedgerows) were located in agricultural landscapes and suffered less frequent disturbances by humans than did the Campus site (surrounded by buildings and grasslands), located in an urban landscape.
Experimental Design. In each locality, a trap garden made of 16 ridges of 8 m by 2 m each, separated by furrows 50 cm wide, was estab-lished during each cropping cycle. Each ridge supported 12 plants of a single cucurbit species. Each cucurbit species occupied two ridges.
Biological Material. Cucurbits are among the economically most important cultivated flowering plants worldwide (Dupriez and De
Leener 1987, Matthews et al. 2003, Schippers 2004, Kocyan et al.
2007,Schaefer et al. 2009). In Cameroon, several species are cultivated
for a diversity of purposes (nutrition, pharmacopoeia, artisanal, etc.)
(Mbouemboue and Boyomo 1981, Dupriez and De Leener 1987).
We studied eight market crops species belonging to the family of Cucurbitaceae, including 1)Citrullus lanatus(Thu¨nberg) Matsumara and Nakai var. egusi, 2)Cucumeropsis mannii Naudin, 3) Cucumis meloL. var. charantais,4)Cucumis meloL. var.agrestis, 5)Cucumis sativusL. var. poinsett, 6)Cucurbita moschata(Duchesne ex Lamarck) Duchesne ex Poiret, 7)Lagenaria siceraria(Molina) Standley, and 8) Sechium edule(Jacquin) Swartz (Supplementary material). The biolog-ical material was composed of 7,290 damaged cucurbit fruits unequally distributed among the three localities and the eight cucurbit species
(Supplementary material).
Sampling Method. Samplings were conducted during sampling days, unequally distributed among the three localities of the study
(Supplementary material). From the blooming stage up to the end of the
fruiting period, plots were visited once a week to evaluate the number of fruits produced and the number affected by insects and/or diseases. Infected fruits were categorized as follows: 1) fruits attacked by fruit flies (Diptera: Tephritidae), characterized by the presence of exudates at the oviposition sites; 2) fruits attacked by sap-sucking insects (Hemiptera), recognized by the dried-out marks of the sucking points,
and 3) those attacked by Coleoptera and Lepidoptera, recognized by the areas removed by these chewing insects. Among affected fruits, those potentially damaged by fruit flies were individually carried in labeled plastic bags to the laboratory, where they were weighed, incubated in plastic boxes, and followed up to the emergence of adult insects. Insects collected were sorted, counted, and fixed in 70% ethanol.
Specimen Identification. Determinations were carried out at the Laboratory of Zoology of the University of Yaounde´ I, at the Centre International de Recherche Agronomique pour le De´veloppement/ Centre de Biologie et de Gestion de Populations (CIRAD/CBGP) in Montpellier (France) and at the Muse´e Royale de l’Afrique Centrale (MRAC) at Tervuren (Belgium). Determinations were based on various documents, including the following: White (2006) and White and
Elson-Harris (2004)for fruit flies;Wharton and Gilstrap (1983)and
Wharton et al. (1992)for parasitoids; andDelvare and Aberlenc (1989)
for insect families in general. The monographs by Bordat and
Arvanitakis (2004) and Bordat and Daly (1995) were also used.
Voucher samples are deposited in the collections of the three institu-tions cited above.
Data Analysis.To test any difference of abundance between taxo-nomical groups, the Kruskall–Wallis test computes in GraphPad Prism 5 was applied. The differences were significant atP<0.05.
Various statistical tools were used to assessadiversity. Individual-based rarefaction and sample-Individual-based rarefaction, with 50 randomiza-tions, were used to generate the SACs of “Mau Tao” estimates of
Fig. 1. Map of the study localities in the southern part of Cameroon. Reference system Transversal Mercator projection; Spheroid of Clarke 1981; author: Tadjoung Paulin.
Table 1. Climatic and agroecological characteristics of the study localities in the southern part of Cameroon
Climatic parametersc Agroecological zones
Southern plateau Western highlands
Survey localities Campus Olembe Koutaba
Latitude N 351’28.9’’ 357’46.3’’ 538’47" Longitude E 1129’52.2’’ 1131’51.4’’ 1048’20"
Altitude (m) 729 673 1,180
Annual rainfall (mm) 1,783.5a–1,953.8b 1,560.5b Mean temperature (C) 24.63a–24.46b 18.66b Mean relative humidity (%) 80.17a–76b 70.09b
aData from the year 2009. b
Data from the year 2010.
cClimatic data were obtained from the National Meteorological Service of
Yaounde´ and from the Koutaba airport services respectively.
by guest on November 14, 2015
http://jinsectscience.oxfordjournals.org/
species richness for each site. Application of SACs is highly recom-mended when comparing species diversity from different communities or landscapes, or from areas with different degrees of perturbation
(Moreno and Halffter 2000).
Three nonparametric abundance-based estimators ABE of species richness (abundance-based coverage estimator ACE, Chao 1, and Jackknife 1) and three nonparametric incidence-based estimators of species richness IBE (incidence-based coverage estimator ICE, Chao 2, and Jackknife 2) were used to estimate the potential number of species (observedþunseen) in the biological material of each study site. The combination of these measures, performed using EstimateS software version 9.0 (Colwell 2013), and the observed species richness allowed evaluation of the sampling effort in each locality.
The observation that species vary in abundance has promoted the development of statistical models such as species abundance models
(Magurran 2004). Sometimes called dominance diversity curves, these
models provide a graphical way of describing species richness and the relative abundance of species in communities (Morin 2011). This tool is important as it allows a quick and easy comparison of biological communities.
SADs, based on the inequality of species abundance that character-izes every ecological community, are used to study the structure of eco-logical communities by testing the fitting of data to theoretical models of relative species abundance (Green and Plotkin 2007, Pavoine and
Bonsall 2011). Each distribution model has an underlying statistical
distribution, which can be derived by making some assumptions about the way that species interact in the community (Magurran 2004,Morin 2011). We examined SADs for the insect communities we studied, choosing as the best model the one presenting the lowest value of the Akaike Information Criterion (AIC) (Henry et al. 2010) calculated with the rad.fit function through the diversity vegan package in the R 2.14.1 software (R Development Core Team 2004).
The diversity indexes of Shannon (H0¼ Ps i¼1
ni Nx ln
ni N) and
Simpson (D¼Psi¼1niNððNni11ÞÞ), as well as the evenness index of Pielou
ðJ¼ H0
lnSÞ, were used to assess insect diversity within and between sites.
In accordance withMagurran (2004), the unequal distribution of abun-dance between species allowed the use of the dominance index of Berger–Parker (1=d¼ 1
N max=N) to express the proportion of individuals
accounted for by the most abundant species in each site. The species rich-ness index of Margalef (DMg¼S1
lnN) was used to highlight the most
spe-cies-rich site. In these formulae,niis the number of individuals of each of the i species in the sample;Nthe total number of individuals in the assem-blage;Sthe number of species in the assemblage;Nmaxthe number of
individuals in the numerically dominant species in each locality; and ln, the natural logarithm. All these indices, commonly used in ecological community studies (Magurran 2004), were calculated using PAST 2.12 (PAleontological STatistics) software (Hammer 1999-2011).
“Species turnover” focuses on changes in taxonomic composition between communities. The application of Sorensen’s coefficient (Sc¼ aþb
2cþaþbÞpermits quantification of specificity in the spatial distri-bution of insect species. Here,aandbrepresent the number of unique species, respectively, in the first and the second sites, whilecis the number of shared species. Sorensen’s coefficient ranges in value from 0 (maximumbdiversity, in which no species are shared between sites) to 1.0 (minimumbdiversity; all species shared between sites) (Harrison
and Berenbaum 2013).t-tests, computed in PAST, were used to
com-pare diversity between sites and seasons.
Results
Taxonomic Composition of Insect Communities in the Study Sites.In total, 66 insect morphospecies, belonging to five orders and 37 families, were identified from a set of 57,510 individuals collected in the three localities (Supplementary material). This included 60 morpho-species from 54 genera and 35 families on the Campus; 44 morphospe-cies from 40 genera and 30 families at Olembe; and 36 morphospemorphospe-cies from 32 genera and 25 families at Koutaba (Supplementary material).
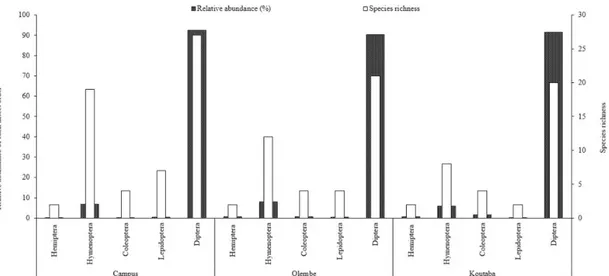
At a taxonomic level, Diptera was the numerically predominant order (P<0.01) and the most species-rich, followed by Hymenoptera (Fig. 2). These two orders present obvious agronomic interest, as their representa-tives include many species that can affect fruit production. Dipterans comprised both specialist and opportunistic fruit feeders. Most of the Hymenoptera species recorded were parasitoids (Supplementary mate-rial), including potential agents of biological control of fruit flies. Lepidoptera, Coleoptera, and Hemiptera, because of their low abundance and species richness (Fig. 2), were minor constituents of insect commun-ities. They can be considered as minor fruit feeders in this system.
Composition of Diptera.All the 15 families of Diptera identified in the study were recorded on the Campus, while 13 were encountered, respectively, at Olembe and Koutaba (Fig. 3). In all the three sites, teph-ritids were numerically predominant among dipteran taxa (P<0.01)
(Fig. 3). They were represented by five species, including four of the
genusDacus(two in subgenusDacus(Dacus(Dacus)bivittatusBigot andDacus(Dacus)punctatifronsKarsch and two in subgenusDidacus (Dacus (Didacus) ciliatus Loew and Dacus (Didacus) vertebratus Bezzi)) and one species of Bactrocera (Bactrocera (Zeugodacus) cucurbitaeCoquillett) (Supplementary material). Although theDacus spp. showed high population densities during the entire study period in all the three sites,Bactrocerawas only observed during a single sam-pling day at Koutaba.
Composition of Hymenoptera. All the nine families of Hymenoptera identified were recorded on the Campus. Of these, three were also observed at Olembe, one at Koutaba, and four in both local-ities (Fig. 4). Consequently, Olembe hosted seven hymenopteran fami-lies and Koutaba five. Braconids were numerically predominant (H¼8.2; ddl¼2; P¼0.02) and the most species-rich family, with eight species (Fig. 4). Braconids and Eulophids, another family common in our samples, belong to the guild of parasitoids and thus have potential agronomic interest (Supplementary material). Among the braconids,Diachasmimorphasp.,Foppiusspp.,Psyttalia perproxi-musSilvestris, Phaenocarpa sp., and an unidentified species coded Gen.18 sp.1 were found to be parasitoids of fruit flies, whereas
Apantelessp. andSchoenlandellasp. were found to be parasitoids of the LepidopteranSphenarches anysodactylusWalker (Supplementary
material). In the Eulophidae,Aprostocetussp.,Tetrastichus daccicidae,
andTetrastichus giffardianusSilvestris were found to be fruit fly para-sitoids. In addition, the ant Pheidole megacephala Fabricius (Formicidae) was observed preying on fruit fly larvae.
Trophic Activities of Insects.Three trophic groups of insects were identified: fruit feeders (carpophagous species and sap-suckers), carni-vores (predators and parasitoids), and saprophagous (opportunistic fruit feeders that feed on decaying fruits) (Fig. 5). Carpophagous insects were numerically predominant (85.8% of all individual insects, repre-senting 19 species), whereas saprophages were most species-rich (only 6.9% of the total number of individuals recorded but representing 24 species) (Fig. 5). Twenty-three species were parasitoids, which consti-tuted 6.1% of all individual insects recorded.
Community Characterization.
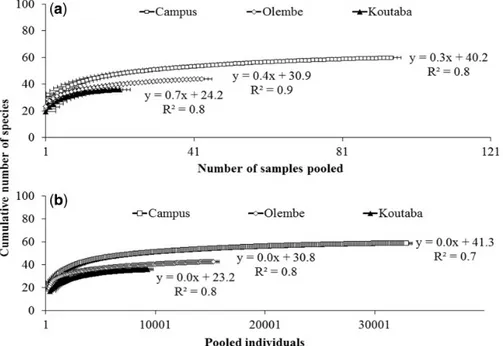
Sampling Effort. On sample-based rarefaction curves, sampling effort necessary to reached the asymptotes was obtained, respectively, at the 87th day on the Campus, 39th day at Olembe, and 18th day at Koutaba, whereas on the individual-based rarefaction curves, asymp-totes were reached at the pooled values of 29,600; 14,000; and 8,000 individuals, respectively (Fig. 6a and b). Also, there were strong signifi-cant positive correlations (P<0.01) between the species richness observed and both the number of sampling days and the number of indi-viduals collected in each community (Fig. 6a and b).
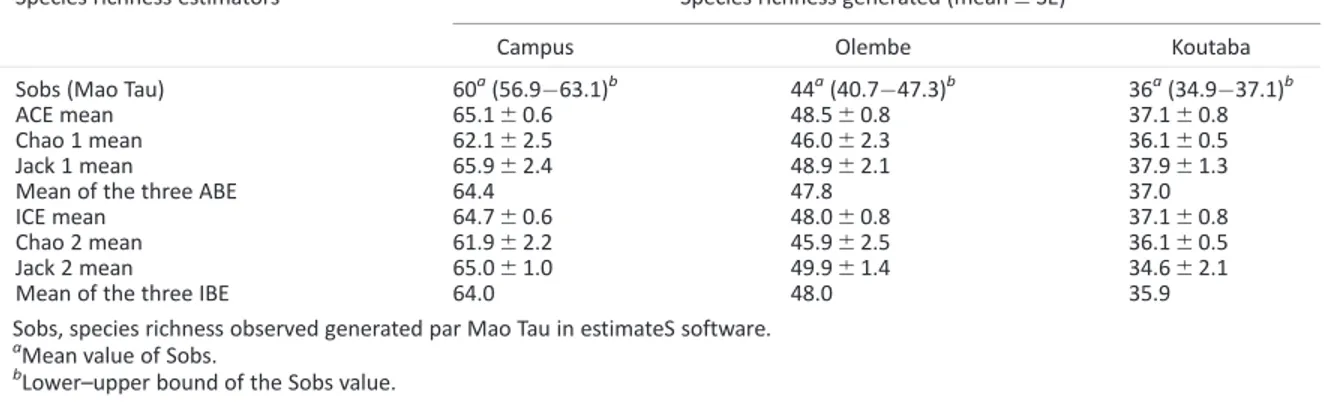
Computing the mean values obtained from the three abundance-based species richness estimators (64.4; 47.8 and 37.1) and the observed species richness generated by Mao tau (Table 2), estimated sampling effort was, respectively, 93.2, 92.1, and 97.2%. The inci-dence-based estimators gave similar results. This result reveals that few unseen species remain to be recorded in each community and that
by guest on November 14, 2015
http://jinsectscience.oxfordjournals.org/
Fig. 2. Relative abundance and species richness of insect orders associated with fruits of eight cultivated cucurbit species in three localities of Cameroon, from January 2009 to 2011. Insect orders are arranged according to insect phylogenetic classification (Trautwein et al. 2012).
Fig. 3. Relative abundance and species richness of Dipteran families associated with fruits of eight cultivated cucurbit species in three localities of Cameroon, from January 2009 to 2011.
Fig. 4. Relative abundance and species richness of Hymenopteran families associated with fruits of eight cultivated cucurbit species in three localities of Cameroon, from January 2009 to 2011.
by guest on November 14, 2015
http://jinsectscience.oxfordjournals.org/
sampling was sufficient for the use of asymptotic minimum species richness estimators.
Species Richness and Diversity.The highest species richness value was obtained on the Campus with 60 species recorded, followed by Olembe (44 species) and Koutaba (36) (Table 2). For the Margalef index values, there was no significant variation of species richness between Olembe and Koutaba, whereas both gave lower values than the Campus (Table 3). The Shannon and Simpson indexes both ranked the community of Koutaba as the most diverse. All the studied com-munities appeared weakly diversified when considering the value of the Shannon index in relation to the maximal diversity (lnS) (Table 3). The values of the evenness index showed a nonsignificant difference in abundance distribution between Olembe and Campus, whereas both were different from Koutaba (Table 3). The Berger–Parker measure indicated the numerical predominance of the most abundant species in
each locality, with the highest value observed at Olembe and the lowest at Koutaba (Table 3).
Among the 66 identified insect morphospecies, 21 were found in only one site: 16 at the Campus, 3 at Olembe, and 2 at Koutaba, respectively
(Supplementary material). Twenty-nine species were common to the three
localities, whereas Campus and Olembe shared 11 other species and Campus and Koutaba four others (Supplementary material). No species was shared only by Olembe and Koutaba. Based on values of Sorensen’s coefficient (Sc), these three communities were highly dissimilar: Campus/ Olembe (Sc¼0.2), Campus/Koutaba (Sc¼0.3), and Koutaba/Olembe (Sc¼0.3).
Community Structure Model.Based on the values of AIC (Table 4) and the SADs (Fig. 7), community structures at the Campus and Olembe followed the Zipf–Mandelbrot model, while that of Koutaba followed the Mandelbrot model (Fig. 7). Both models characterize
Fig. 5. Relative abundance and species richness of trophic groups of insects associated with fruits of eight cultivated cucurbit species in three localities of Cameroon, from January 2009 to 2011.
Fig. 6. Species accumulation curve based on the sampling days (a) and on the number of insect individuals (b) collected in three localities of Cameroon, from January 2009 to 2011.
by guest on November 14, 2015
http://jinsectscience.oxfordjournals.org/
ecologically hierarchized communities in which colonization of space by a species is linked to the activity of the preestablished species with which it interacts.
SAD models underline the numerical predominance ofDacus bivit-tatus, which accounted for about 50% of all insect individuals in each of the three sites (Supplementary material). This fly emerged from fruits harvested during 90 out of 94, 40 out of 47, and 17 out of 21 sampling days, respectively, on the Campus, at Olembe, and at Koutaba. This species was followed in abundance byDacus ciliatus(obtained on 85, 20, and 16 sampling days, respectively),P. perproximus(65, 29, and 15 d),Dacus punctatifrons(44, 12, and 13 d), and the unidentified species of Lonchaeidae coded as Gen.7 sp.1 (12, 24, and 10 d). These five
species accounted for about 80% of the whole sample (Supplementary
material).P. perproximuswas in our system a potential parasitoid of
Dacusspecies, the principal fruit feeders. At Campus, 23 rare species (among which 34.8% were parasitoids of various pests), each account-ing for no more than 10 individuals, were recorded, compared to 17 (35.3% of which were parasitoids) at Olembe and 17 (29.4%) at Koutaba.
Discussion
Taxonomic Composition of Insect Communities.This work is the first sampling of insect species from fruits of cultivated cucurbits in Cameroon. In total, 57,510 insect individuals, comprising 66 morpho-species belonging to five orders and 37 families, was collected. This sample revealed a hitherto unsuspected abundance and diversity of insects associated with cucurbit fruits in Cameroon and highlighted the richness of insects found in fruit-based agrosystems compared with pre-vious studies focused on fruit pests (Nonveiller 1984,Tindo and Tamo
1999, Okolle and Ntonifor 2005, Fomekong et al. 2008, Ndzana
Abanda et al. 2008,Ngamo Tinkeu et al. 2010).
Many ecologists have found it useful to group insects into guilds to study the ecological interactions between insects, their hosts, their natural enemies, and climate (Speight et al. 2008). Based on the feeding strat-egies of the insects observed, three guilds, phytophagous (carpophagous and sap suckers), saprophagous, and carnivorous (parasitoids and preda-tors) were recognized. Globally, phytophagous insects were numerically predominant, representing >96.1% of the individuals collected. This guild accounts for at least 25% of all insects on earth (Strong et al. 1984). Several studies have emphasized their importance as pests on various crops, particularly the importance of carpophagous insects in fruit pro-duction (Appert and Deuse 1982,1988;Reckhaus 1997).
An analysis by taxon revealed that Diptera and Hymenoptera were numerically preponderant and agronomically most important as well. A similar conclusion was reached byDjie´to-Lordon and Ale´ne´ (2006), who studied the fauna associated with various cultivated fruits in and around Yaounde´. Among Diptera, the family Tephritidae, mainly repre-sented by species of the genusDacus, were the main fruit feeders with respect to the feeding behavior of their larvae. These flies are known worldwide as key pests of fruits of economic importance in orchards and gardens (Tindo and Tamo 1999,Vayssie`res and Carel 1999,Da
Silva et al. 2006, White 2006,Fomekong et al. 2008, Rwomushana
et al. 2008,Copeland et al. 2009,Courtney et al. 2009,Virgilio et al.
2009,Ryckewaert et al. 2010). Concerning Hymenoptera, various
spe-cies of the families Braconidae and Eulophidae were found to parasitize fruit flies and moths, while ants (Formicidae) preyed on fruit fly larvae.
Table 2. Estimators of species richness based on abundance of insects associated with fruits of eight cultivated cucurbit species in three localities of Cameroon, from January 2009 to 2011
Species richness estimators Species richness generated (mean6SE)
Campus Olembe Koutaba
Sobs (Mao Tau) 60a(56.963.1)b
44a(40.747.3)b
36a(34.937.1)b
ACE mean 65.160.6 48.560.8 37.160.8
Chao 1 mean 62.162.5 46.062.3 36.160.5
Jack 1 mean 65.962.4 48.962.1 37.961.3
Mean of the three ABE 64.4 47.8 37.0
ICE mean 64.760.6 48.060.8 37.160.8
Chao 2 mean 61.962.2 45.962.5 36.160.5
Jack 2 mean 65.061.0 49.961.4 34.662.1
Mean of the three IBE 64.0 48.0 35.9
Sobs, species richness observed generated par Mao Tau in estimateS software.
a
Mean value of Sobs.
b
Lower–upper bound of the Sobs value.
Table 3. Species diversity and species richness indices calculated for insects associated with fruits of eight cultivated cucurbit species in three localities of Cameroon, from January 2009 to 2011
Localities Campus Olembe Koutaba
Shannon_H’ 1.6a 1.4b 1.7c
LnS 4.1 3.1 3.6
Simpson_1-D 0.6a 0.5b 0.7c
Evenness_J 0.4a 0.4a 0.5b
Berger–Parker_d 0.6a 0.7b 0.5c
Margalef_DMg 5.7a 4.5b 3.8b
On a given line, values followed by the same letter are not significantly different among sites atP<0.05 by thet-test comparing diversity in PAST software.
Table 4. Values of AIC for each rank-abundance distribution model of insects associated with fruits of eight species of cultivated cucurbits in three localities of Cameroon, from January 2009 to 2011
Species abundance models AIC value in each survey locality
Campus Olembe Koutaba
Null 79,295.5 34,017 13,655
Preemption 17,832.6 13,645.3 1,738.7
Lognormal 1,181.7 2,473.2 483.1
Zipf 940.6a 2,016.2a 868.6
Mandelbrot 942.6a 2,018.2a 348.2a
Values with a letter represent the lowest values of the AIC.
by guest on November 14, 2015
http://jinsectscience.oxfordjournals.org/
Braconidae and Eulophidae are commonly cited as parasitoids of vari-ous crop pests (Huber 2009). Many parasitoid species are important in agriculture as agents of biological control (Wharton and Gilstrap 1983).
Community Characterization.
Sampling Effort.One important goal of sampling is the generation of a complete species list of a locality, along with an unbiased estimate of the abundance of each species (Longino and Colwell 1997). Statistical methods are widely used to estimate the asymptotic number of species present, including species not yet detected (Chao et al. 2009). Species richness estimators are based on the assumption that the observed species richness is lower than the true richness of the site
(Colwell and Coddington 1994, Magurran 2004). In this study, six
nonparametric estimators of species richness were used. The ratio of observed species richness to the average of abundance-based/sample-based species richness estimators revealed a powerful sampling effort higher than 92% in all cases.
Also,Gotelli and Colwell (2010)stated that the minimum number of samples needed for a representative sample in a specific habitat can be ascertained by graphing the curve of the number of species recorded as a function of the number of samples examined. These curves are based on the assumption that beyond a certain amount of effort, the spe-cies versus effort curve should reach an asymptote (Magurran 2004,
Chao et al. 2005). That asymptote provides a reasonable estimate of the
number of species present. Conventionally, the minimal sample size accepted for optimal sampling and efficient comparison of ecological communities is 20 samples (Agosti and Alonso 2000). In this study, SACs for each of the three localities were built on the base of, respec-tively, 32,981, 15,332, and 9,377 individuals per site, from 94, 47, and 21 samples per site. The saturation plateau was well established on all the three sites and indicated an acceptable quality of the sample in each site.
Species Richness and Diversity.The insect fauna associated with cucurbit fruits appeared to be species-rich in all the study sites. Based
on the values of Margalef’s index, species richness was not signifi-cantly different between Olembe and Koutaba and, in both sites, was significantly lower than at the Campus. This finding indicates that the type of landscape, agricultural or urban, may have had a greater effect on species richness than the agroecological zone (unimodal vs. bimodal rainfall regime). Thus, species richness variation appeared more influ-enced by border effects than by climatic parameters. Based on values for Sorensen’s index, composition of the studied communities at spe-cies level were dissimilar. As a result, no one community contains the same biodiversity as any of the others, even in rather homogeneous landscapes, due to site-specific characteristics of soil, topography, veg-etation, weather, and other environmental factors that may govern each species settlement (Kim 2009).
Even though Koutaba appeared to be the most diverse of the three sites when considering the values of both Simpson and Shannon indi-ces, evenness was low in each locality. An ecosystem exhibiting a low evenness is one in which a few sampled species dominate (Magurran 1988). In all the study sites, insect communities were dominated by the five most abundant species, which represent an average of>80% of the total abundance (89.0% on the Campus, 81.3% at Olembe, and 88.4% at Koutaba). These species governed diversity, productivity, and rates of energy or nutrientflux in fruit-based food webs. Also, the relatively short duration of availability of fruits as a resource (from infestation to complete decay) make them an unstable support. In market crop sys-tems such as domesticated cucurbits, the above-demonstrated low diversity coupled with high densities of pest species heightens the need to implement management strategies that conserve beneficial species and the ecosystem services they provide.
Pattern of SADs.Any attempt to describe a complex community structure by one single attribute, such as richness or equitability, can be criticized because valuable information about community structure is lost (Begon et al. 2006). Based on the values from AIC, insect commun-ities collected on the Campus and at Olembe are similar and followed
Fig. 7. SAD model of insect species associated with fruits of eight cultivated cucurbit species in three localities of Cameroon, from January 2009 to 2011.
by guest on November 14, 2015
http://jinsectscience.oxfordjournals.org/
the Zipf–Mandelbrot model, while that of Koutaba followed the Mandelbrot model. The two models are closely related and constitute all the realistic models available for continuous data (Wilson et al. 1996), and provide a good statistical description of the structure and transformation of natural communities (Barange´ and Campos 1991). The Zipf–Mandelbrot model supposes that there are specialist species, which cannot enter a community until generalist species have estab-lished (Frontier 1985). Also, the models postulate a rigid sequence of colonists, with the same species always present at the same point in the succession in similar habitats (Magurran 2004). The result is a few abundant species, with many minor species of comparable abundance. In our system,D. bivittatuswas the predominant species, occurring on 90 out of 94, 40 out of 47, and 17 out of 21 sampling days, respectively, in the three localities and followed in similar ways by the four other spe-cies. The establishment of a species in a community is dependent on prior changes. The presence of a species can be seen as depending on previous physical conditions and on the presence of previously arrived species. This is the case of P. perproximus, a parasitoid species of Dacus spp., which required prior degradation of fruits by its hosts. Observations of the abundance of insects and their potential natural enemies can also be used to discover which natural enemy species are important in reducing the numbers of particular insect pest species
(Speight et al. 2008). To a lesser extent, saprophagous insects also
appeared to be late successional species as their presence requires decaying of the fruits.He and Reed (2006)suggested that there is a gen-eral tendency that locally abundant species are more widely distributed in space than rare species, leading to a positive distribution–abundance (or occupancy–abundance) relationship. For instance, insect commun-ities associated with cucurbit fruits appeared to be hierarchical and structured as a tritrophic network, including fruits, true fruit flies or saprophagous insects and parasitoids.
This study aimed to characterize the structure of insect communities associated with cucurbit fruits in three localities situated in two agro-ecological zones in the southern Cameroon. Based on components ofa diversity, the insect communities studied appeared species-rich, with a high preponderance of five main species including four pest species and a parasitoid, and a great number of rare species (23 on the Campus, 17 at both Olembe and Koutaba). SADs that range from the Zipf–Mandelbrot model on the southern Plateau to the Mandelbrot model on the western Highlands are closely related models. Apart from P. perproximus, a main parasitoid ofDacusspecies, our study reveals the importance of other potential parasitoid species of fruit flies found at low abundance. Such species are typically neglected in most studies. Also, our results point to some complexity in the composition and structure of insect communities associated with market crops and to the need to implement sustainable pest management strategies that preserve ecosystem integrity and services.
Acknowledgments
This study was supported by the French Ministry of Foreign and European affairs through the granted project CORUS II-6080. We are grateful to Prof. Doyle McKey of the Centre for Functional and Evolutionary Ecology (CEFE), in Montpellier, France, for valuable comments on the manuscript, to Fotsa David of the University of Ngaoundere, who gave help in the use of R software, and to Tadjoung Paulin for having prepared the map of the study locality. We are also grateful to the monks of the Koutaba Cistercian Monastery and to chief Ateba at Messa-Assi for providing facilities on their premises during the study.
References Cited
Agosti, D., and L. E. Alonso. 2000.The ALL protocoll, pp. 204–214.InD. Agosti, J. D. Majer, L. E. Alonso, and T. R. Schultz(eds.), Ants: standard methods for measuring and monitoring biodiversity. Smithsonian Institution Press, Washington, DC.
Allwood, A. J. 1996.Biology and ecology: prerequisites for understanding and managing fruit flies (Diptera: Tephritidae), pp. 95–101.InA. J. Allwood and R.A.I. Drew(eds.), Management of fruit flies in the Pacific. A regional sym-posium, ACIAR, Canberra. Nadi, Fiji.
Appert, J., and J. Deuse. 1982. Les ravageurs des cultures vivrie`res et maraıˆche`res sous les tropiques. Maisonneuve et Larose, Paris, France. Appert, J., and J. Deuse. 1988.Insectes nuisibles aux cultures vivrie`res et
maraıˆche`res. Maisonneuve et Larose, Paris, France.
Barange´, M., and B. Campos. 1991.Models of species abundance: a critique of and an alternative to the dynamics model. Mar. Ecol. Prog. Ser. 69: 293–298.
Begon, M., C. R. Townsend, and J. L. Harper. 2006.Ecology: from individ-ual to ecosystems, 4th ed. Blackwell Publishing Ltd., Oxford, United Kingdom.
Bordat, D., and L. Arvanitakis. 2004.Arthropodes des cultures le´gumie`res d’Afrique de l’Ouest, Centrale, Mayotte et Re´union. CIRAD, Montpellier, France.
Bordat, D., and P. Daly. 1995.Catalogue des principaux Arthropodes pre´sents sur les cultures le´gumie`res de Nouvelle-Cale´donie. CIRAD, Montpellier, France.
Chao, A., R. L. Chazdon, R. K. Colwell, and T.-J. Shen. 2005.A new statisti-cal approach for assessing similarity of species composition with incidence and abundance data. Ecol. Lett. 8: 148–159.
Chao, A., R. K. Colwell, C-W. Lin, and N. J. Gotelli. 2009.Sufficient sam-pling for asymptotic minimum species richness estimators. Ecology 90: 1125–1133.
Colwell, R. K. 2013.EstimateS: statistical estimation of species richness and shared species from samples. Persistent URL (http://purl.oclc.org/estimates//), University of Connecticut, CT.
Colwell, R. K., and J. A. Coddington. 1994.Estimating terrestrial biodiversity through extrapolation. Philos. Trans. R. Soc. Lond. B 345: 101–118. Copeland, R. S., Q. Luke, and R. A. Wharton. 2009.Insects reared from the
wild fruits of Kenya. J. East Afr. Nat. Hist. 98: 11–66.
Courtney, G. W., T. Pape, J. H. Skevington, and B. J. Sinclair. 2009. Biodiversity of Diptera, pp. 185–222.InR. G. Foottit and P. H. Adler (eds.), Insect biodiversity: science and society. Blackwell Publishing, Oxford, United Kingdom.
Da Silva, F. F., R. N. Meirelles, L. R. Redaelli, and F. K. Dal Soglio. 2006. Diversity of flies (Diptera: Tephritidae and Lonchaeidae) in organic citrus or-chards in the Vale do Rio Caı´, Rio Grande do Sul, southern Brazil. Neotrop. Entomol. 35: 666–670.
Delvare, G., and H. P. Aberlenc. 1989.Les insectes d’Afrique et d’Ame´rique Tropicale: Cle´s pour la reconnaissance des familles. PRIFAS/CIRAD, Montpellier, France.
Djie´to-Lordon, C., and D. C. Ale´ne´. 2006. Inventaire diagnostique des insectes de quelques cultures dans les exploitations maraıˆche`res pe´riurbaines dans la re´gion de Yaounde´, Cameroun, pp. 7–18.InF. Bella Manga, A. Kamga, D. Omokolo, and M. Havard(eds.), Actes atelier de pre´sentation des ope´rations de recherche participative. Poˆle de Compe´tence en Partenariat (PCP) Grand Sud Cameroun Yaounde´, Cameroun.
Dupriez, H., and P. De Leener. 1987.Les Cucurbitace´es, pp. 295–305.InH. Dupriez, and P. De Leener(eds.), Jardins et vergers d’Afrique. Harmattan, Nivelles, Belgique.
Fomekong, A., J. Messi, S. Kekeunou, F-N. Tchuenguem-Fohouo, and J. L. Tamesse. 2008.Entomofauna ofCucumeropsis manniiNaudin, its impact on plant yield and some aspects of the biology ofDacus bivitattus(Diptera: Tephritidae). Afr. J. Agric. Res. 3: 363–370.
Frontier, S. 1985.Diversity and structure in aquatic ecosystems, pp. 253–312. InM. Barnes(eds.), Oceanography and marine biology, an annual review. Aberdeen University Press, Aberdeen, United Kingdom.
Gotelli, N. J. 2004.A taxonomic wish-list for community ecology. Philos. Trans. R. Soc. Lond. B 359, 585–597.
Gotelli, N. J. and R. K. Colwell. 2010.Estimating species richness, pp. 39–54. InA. E. Magurran and B. J. McGill(eds.), Frontiers in measuring biodiver-sity. Oxford University Press, New York, NY.
Green, J. L., and J. B. Plotkin. 2007.A statistical theory for sampling species abundances. Ecol. Lett. 10: 1037–1045.
Hamilton, A. J. 2005.Species diversity or biodiversity? J. Environ. Manage. 75: 89–92.
Hammer, O. 1999–2011.PAleontological STatistics. Natural History Museum University of Oslo, Oslo, Norway.
Harrison, T., and M. R. Berenbaum. 2013.Moth diversity in three biofuel crops and native prairie in Illinos. Insect Sci. 20: 407–419.
He, F., and W. Reed. 2006.Downscaling abundance from the distribution of species: occupancy theory and applications, pp. 89–108.InJ. Wu, K. B. Jones, H. Li, and O. L. Loucks(eds.), Scaling and uncertainty analysis in ecology: methods and applications. Springer, Amsterdam, The Netherlands.
by guest on November 14, 2015
http://jinsectscience.oxfordjournals.org/
Henry, M., J. F. Cosson, and J. M. Pons. 2010.Modelling multi-scale spatial variation in species richness from abundance data in a complex neotropical bat assemblage. Ecol. Model. 221: 2018–2027.
Huber, J. T. 2009. Biodiversity of hymenopterans, pp. 303–323.In R. G. Foottit and P. H. Adler (eds.), Insect biodiversity: science and society. Blackwell, Chichester, United Kingdom.
Jang, E. B., G. T. McQuate, D. O. Mclnnis, E. J. Harris, R. I. Vargas, R. C. Bautista, and R. F. Mau. 2008.Targeted trapping, bait-spray, sanitation, ster-ile-male, and parasitoid releases in an areawide integrated melon fly (Diptera: Tephritidae) control program in Hawaii. Am. Entomol. 54 (Winter): 240–250. Kim, K. C. 2009. Taxonomy and management of insect biodiversity, pp.
561–574.InR. G. Foottit and P. H. Adler(eds.), Insect biodiversity: sci-ence and society. Blackwell, Chichester, United Kingdom.
Kocyan, A., L-B. Zhang, H. Schaefer, and S. S. Renner. 2007.A multi-locus chloroplast phylogeny for the Cucurbitaceae and its implications for charac-ter evolution and classification. Mol. Phylogenet. Evol. 44: 553–577. Longino, J. T., and R. K. Colwell. 1997.Biodiversity assessment using
struc-tured inventory: capturing the ant fauna of a tropical rain forest. Ecol. Appl. 7: 1263–1277.
Longino, J. T., J. Coddington, and R. K. Colwell. 2002.The ant fauna of a tropical rain forest: estimating species richness three different ways. Ecology 83: 689–702.
Magurran, A. E. 1988.Diversity indices and species abundance models, pp. 7–45.InA. E. Magurran(ed.), Ecological diversity and its measurement. Princeton University Press, Princeton, NJ.
Magurran, A. E. 2004.Measuring biological diversity. Blackwell, Malden, MA.
Matthews, G., T. Wiles, and P. Baleguel. 2003.A survey of pesticide applica-tion in Cameroon. Crop Prot. 22: 707–714.
Mbouemboue, P., and M. Boyomo. 1981.L’inventaire des plantes alimen-taires, pp. 103–148. In P. Mbouemboue and M. Boyomo (eds.), L’agriculture autochtone au Cameroun: les techniques culturales, les se´quen-ces de culture, les plantes alimentaires et leur consommation. Landbouwhogeschool, Wageningen, The Netherlands.
McGill, B. J., R. S. Etienne, J. S. Gray, D. Alonso, M. J. Anderson, H. K. Benecha, M. Dornelas, B. J. Enquist, J. L. Green, F. He, et al. 2007. Species abundance distributions: moving beyond single prediction theories to integration within an ecological framework. Ecol. Lett. 10: 995–1015. Moreno, C. E., and G. Halffter. 2000.Assessing the completeness of bat
bio-diversity inventories using species accumulation curves. J. Appl. Ecol. 37: 149–158.
Morin, P. J. 2011. Community ecology, 2nd ed. Willey-Blackwell, New Brunswick, NJ.
Ndzana Abanda, R.F.X., S. Quilici, J.-F. Vayssie`res, L. Kouodiekong, and N. Woin. 2008. Inventaire des espe`ces de mouches des fruits sur goyave dans la re´gion de Yaounde´ au Cameroun. Fruits 63: 19–26.
Ngamo Tinkeu, L., D. Ladang, J.-F. Vayssie`res, and J. P. Lyannaz. 2010. Diversite´ des espe`ces de mouches des fruits (Diptera: Tephritidae) dans un verger mixte dans la localite´ de Malang (Ngaounde´re´, Cameroun). Int. J. Biol. Chem. Sci. 4: 1425–1434.
Nonveiller, G. 1984.Catalogue des insectes du Cameroun d’inte´reˆt agricole. Apparitions, re´partition, importance. Institut pour la Protection des Plantes, Belgrade, Serbia.
Okolle, J. N., and N. N. Ntonifor. 2005.Field ovipositional behavior and labo-ratory studies on development ofDacus punctatifrons(Diptera: Tephritidae) on tomato. Insect Sci. 12: 393–398.
Pavoine, S., and M. B. Bonsall. 2011.Measuring biodiversity to explain com-munity assembly: a unified approach. Biol. Rev. Camb. Philos. Soc. 86: 792–812.
Reckhaus, P. 1997.Maladies et ravageurs des cultures maraıˆche`res: a` l’exemple de Madagascar. GTZ, Margraf Verlag, Weikersheim, Allemagne.
Rwomushana, I., S. Ekesi, I. Gordon, and C.K.P.O. Ogol. 2008.Host plants and host plant preference studies for Bactrocera invadens (Diptera:
Tephritidae) in Kenya, a new invasive fruit fly species in Africa. Ann. Entomol. Soc. Am. 101: 331–340.
Ryckewaert, P., J.-P. Deguine, T. Bre´vault, and J.-F. Vayssie`res. 2010.Fruit flies (Diptera: Tephritidae) on vegetable crops in Reunion Island (Indian Ocean): state of knowledge, control. Fruits 65: 113–130.
Schaefer, H., C. Heibl, and S. S. Renner. 2009.Gourds afloat: a dated phylog-eny reveals an Asian origin of the gourd family (Cucurbitaceae) and numer-ous oversea dispersal events. Proc. R. Soc. Lond. B 276: 843–851.
Schippers, R. R. 2004.Le´gumes africains indige`nes, Pre´sentation des espe`ces cultive´es. CTA, Margraf Publisher, Wageningen, Pays-Bas.
Scholtz, C. H., and M. W. Mansell. 2009.Insect biodiversity in the Afrotropical Region, pp. 69–82. In R. G. Foottit and P. H. Adler (eds.), Insect Biodiversity: Sciences and Society. Blackwell, Oxford, United Kingdom. Schowalter, T. D. 2006. Community structure, pp. 251–282. In T. D.
Schowalter(ed.), Insect ecology: an ecosystem approach. Academic Press, San Diego, CA.
Speight, M. R., M. D. Hunter, and A. D. Watt. 2008.Ecology of insects: con-cepts and applications, 2nd ed. Wiley-Blackwell, Singapore.
Stireman, J.O.I. 2008.aand ß diversity of a Tachinid parasitoid community over space and time. Ann. Entomol. Soc. Am. 101: 362–370.
Stonehouse, J. M., H. S. Singh, R. K. Patel, S. Satpathy, T. M. Shivalingaswamy, S. Rai, A. Verghese, and J. D. Mumford. 2007.The measurement and modelling of losses of cucurbits to tephritid fruit flies. Commun. Biometry Crop Sci. 2: 17–25.
Strong, D. R., J. H. Lawton, and T.R.E. Southwood. 1984.Insects on plants: community patterns and mechanisms.Harvard University Press, Cambridge, MA.
Tindo, M., and M. Tamo. 1999.La mouche des fruitsDacus punctatifrons (Diptera: Tephritidae) comme proble`me de production de la tomate dans la re´gion de la Lekie´ (Sud-Cameroun). Annales de la Socie´te´ Entomologique de France 35: 525–527.
Trautwein, M. D., B. M. Wiegmann, R. Beutel, K. M. Kjer, and D. K. Yeates. 2012.Advances in insect phylogeny at the dawn of the postgenomic era. Ann. Rev. Entomol. 57:449–468.
Vayssie`res, J.-F., and Y. Carel. 1999.Les Dacini (Diptera: Tephritidae) infe´o-de´s aux Cucurbitaceae a` la Re´union: gamme de plantes-hoˆtes et stades phe´-nologiques pre´fe´rentiels des fruits au moment de la piquˆre pour des espe`ces cultive´es. Annales de la Socie`te´ Entomologique de France 35: 197–202. Virgilio, M., M. De Meyer, I. M. White, and T. Backeljau. 2009.African
Dacus(Diptera: Tephritidae): molecular data and host plant associations do not corroborate morphology based classifications. Mol. Phylogenet. Evol. 51: 31–539.
Wharton, R. A., and F. E. Gilstrap. 1983.Key to and status of Opiinae braconid (Hymenoptera) parasitoids used in biological control ofCeratitis capitataandDacuss. l. (Diptera: Tephritidae). Ann. Entomol. Soc. Am. 76: 721–742.
Wharton, R. A., S. R. Shaw, N. J. Sharkey, D. B. Wahl, J. B. Woolley, J. B. Whitfield, P. M. Marsh, and W. Johnson. 1992.Phylogeny of the subfami-lies of the family Braconidae (Hymenoptera: Ichneumonoidea): a reassess-ment. Cladistics 8: 199–235.
White, I. M. 2006.Taxonomy of the Dacina (Diptera: Tephritidae) of Africa and the Middle East. Entomological Society of Southern Africa, Hatfield, South Africa.
White, I. M., and M. M. Elson-Harris. 2004.Fruit flies of economic signifi-cance: thier identification and bionomics. CAB/ACIAR, London, United Kingdom.
Wilson, J. B., T.C.E. Wells, I. C. Trueman, G. Jones, M. D. Atkinson, M. J. Crawley, M. E. Dodd, and J. Silvertown. 1996.Are there assembly rules for plant species abundance? An investigation in relation to soil resources and successional trends. J. Ecol. 84: 527–538.
Received 7 August 2013; accepted 5 March 2014.
by guest on November 14, 2015
http://jinsectscience.oxfordjournals.org/