Association of Parity in Patients
with Chronic Liver Disease
Pegah Golabi,* Sofie Fazel,* Munkhzul Otgonsuren,* Carey Escheik,* Mehmet Sayiner,*,** Zobair M. Younossi*,**
* Betty and Guy Beatty Center for Integrated Research, Inova Health System, Falls Church, VA, United States. ** Center For Liver Disease, Department of Medicine, Inova Fairfax Hospital, Falls Church, VA, United States.
November-December, Vol. 17 No. 6, 2018: 1035-1041 The Official Journal of the Mexican Association of Hepatology,
the Latin-American Association for Study of the Liver and the Canadian Association for the Study of the Liver
Manuscript received: Manuscript received:Manuscript received:
Manuscript received:Manuscript received: March 02, 2018. Manuscript accepted:Manuscript accepted:Manuscript accepted:Manuscript accepted:Manuscript accepted: July 04, 2018.
DOI:10.5604/01.3001.0012.7204
A B S T R A C T A B S T R A C T A B S T R A C T A B S T R A C T A B S T R A C T
Introduction and aim. Introduction and aim.Introduction and aim. Introduction and aim.
Introduction and aim. The impact of type of liver disease on parity rates hasn’t been described. Our aim was to assess the parity rates among women with CLD. Material and methods.Material and methods.Material and methods.Material and methods.Material and methods. The National Health and Nutrition Examination Survey-III (1988-1994) data were used to identify adult female participants with a diagnosis of CLD. Participants were asked about their reproductive health status. Parity was defined as having at least one live birth. Hepatic ultrasound, serologic, medical examination and clinical data were available to determine the presence and type of CLD. Body mass index (kg/m2) was divided into 3 categories (< 30; 30-35; 36+). Results.Results.Results.Results.Results. A total of 3,502 (865 NAFLD, 737 other CLD, 1,901 control) subjects were included. Patients with NAFLD were more likely to have at least one live birth than patients with other CLD and controls (77% in NAFLD vs. 72% in controls). Multivariate analysis revealed that presence of CLD other than NAFLD (OR: 0.46 [95% CI, 0.34-0.63]) and having a college or higher degree (OR: 0.48 [95% CI, 0.34-0.68]) were negatively associated while having low income (OR: 11.06 [95% CI, 6.86-17.82]) and being African American (OR: 3.93 [95% CI, 2.59-5.98]) were positively associated with having at least one live birth. Conclu-Conclu-Conclu-Conclu- Conclu-sions.
sions.sions. sions.
sions. This study revealed that patients with CLD other than NAFLD were less likely to have at least one live birth. NAFLD and obesity were associated with higher rates of live births which can potentially be explained by weight gain post live birth leading to obesity and its associated-NAFLD.
Key words. Key words. Key words. Key words.
Key words. Non-alcoholic fatty liver disease. Pregnancy. Infertility. Polycystic ovary syndrome. Insulin resistance.
INTRODUCTION
Chronic liver disease (CLD) has been increasingly prevalent and became a major cause of morbidity and mor-tality worldwide.1,2 The most common causes of chronic liver disease include infections with Hepatitis B (HBV) and C (HCV) viruses, alcoholic liver disease (ALD) and non-alcoholic fatty liver disease (NAFLD).3,4 Although HBV is more common than HCV from the global per-spective, HCV is the most common cause of chronic liver disease in the United States (US), accounting for nearly 40% of all newly diagnosed cases of CLD.5 Additionally, NAFLD and its progressive form, non-alcoholic steato-hepatitis (NASH) have now been recognized as the lead-ing cause of cirrhosis and advanced liver disease, worldwide. In fact, because of obesity epidemic, the
MATERIAL AND METHODS
Study Design and Population
The population-based NHANES III study used a com-plex sampling design to produce a representative sample of the U.S. noninstitutionalized population and conduct-ed by the Centers for Disease Control and Prevention.12 Data collection includes a participant’s home interviewer-administered questionnaire by trained interviewers and health measures (medical examination and laboratory sam-ples) at equipped mobile examination centers.13 A total of 20,050 adult participants (17 or older) were interviewed and examined. For the objectives of this study, participants who were child bearing non-pregnant women between the ages of 20 and 50 and who completed the adult repro-ductive health component of the self-reported question-naire were included, see detailed cohort selection criteria figure 1. A set of socio-demographic, medical history, and reproductive health measures was self-reported in the in-terview-administered questionnaire. Age was as a continu-ous variable (years); gender, education (high school/less than high school vs. some college/higher), health prob-lems (indicating if a participant ever diagnosed the fol-lowing conditions: cardiovascular disease (CVD), diabetes mellitus (DM), hypertension, and hyperlipidemia by self-reported medical history questionnaire) were all coded as binary variables; and race (White, Black, and Mexican/ Other), marital status (currently married, divorced, and never married), poverty (if the ratio of the family income to the poverty level, DMPPIR < 1.9 as low, 1.9-3.4 as me-dium, and > 3.5 as high) and liver disease (NAFLD, other
chronic LD, and control) were all coded in three level; and household annual income (< $10,000, $10,000 -$24,999, $25,000 - $49,999, and ≥ $50,000) was coded in four level.
Reproductive Health Status: Identification of Parity Status
The outcome in this analysis was parity status. The sur-vey reproductive health part asked those following: (a) “Have you ever been pregnant? Please include miscarriag-es, stillbirths, tubal pregnancimiscarriag-es, abortions, live births, and current pregnancy”; (b) “How many times have you been pregnant? Again, be sure to count all your pregnancies whether they ended in miscarriage, stillbirth, tubal preg-nancy, abortion, or live birth”; (c) “What is the total number of live births (live-born children) you have had?”; and (d) “Did you breastfeed (your child/any of your chil-dren)?”
Using above questions (a, b, and c), we identified bina-ry parity status variable (no live or never give a birth as coded “0” and at least one or more live birth as coded “1”). Also, we identified breastfeed in those who had at least one or more live birth; however, 54% had missing infor-mation on breastfeed.
Definition of Liver Diseases
Using a Toshiba Sonolayer SSA-90A and Toshiba he-patic ultrasound video recorders, the investigators graded the amount of fat within the hepatic parenchyma was as: (1) normal, (2) mild, (3) moderate, (4) or severe. Quality control and assurance procedures were used to standard-ize the reading from three ultrasound readers, who had no access to any other participant data. Based on the hepatic ultrasound data, NAFLD was determined to be present if there was mild to severe hepatic steatosis and no other cause of other chronic liver diseases [excessive alcohol use, use if 10 or more grams per day in women and 20 or more grams per day in men based on self-reported daily amount of alcohol consumption, elevated transferrin satu-ration if transferrin satusatu-ration 50% or more), a positive hepatitis B surface antigen (HBsAg), a positive hepatitis B core antibody HBc), or positive HCV tests (anti-HCV by ELISA and (anti-HCV RNA by PCR)]. A grade of “Normal” on the hepatic ultrasound with the absence of the above listed chronic liver disease was defined as control.
Statistical Analysis
Trend analyses by body mass index (BMI) (categorized into: < 30, 30-34.9, 35 and more) were examined. Linear
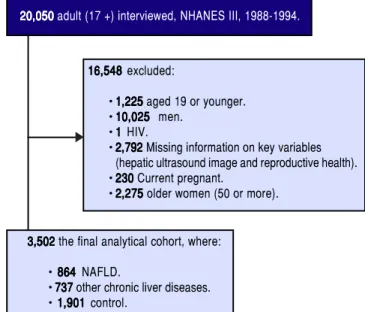
Figure 1. Figure 1. Figure 1. Figure 1.
Figure 1. Flow chart of study cohort selection.
20,050 20,05020,050
20,05020,050 adult (17 +) interviewed, NHANES III, 1988-1994.
16,548 16,54816,548 16,548
16,548 excluded:
• 1,2251,2251,2251,2251,225 aged 19 or younger. • 10,02510,02510,02510,02510,025 men.
• 11111 HIV.
• 2,7922,7922,7922,7922,792 Missing information on key variables (hepatic ultrasound image and reproductive health). • 230230230230230 Current pregnant.
• 2,2752,2752,2752,2752,275 older women (50 or more).
3,502 3,502 3,502 3,502
3,502 the final analytical cohort, where:
• 864 864 864 864 NAFLD. 864
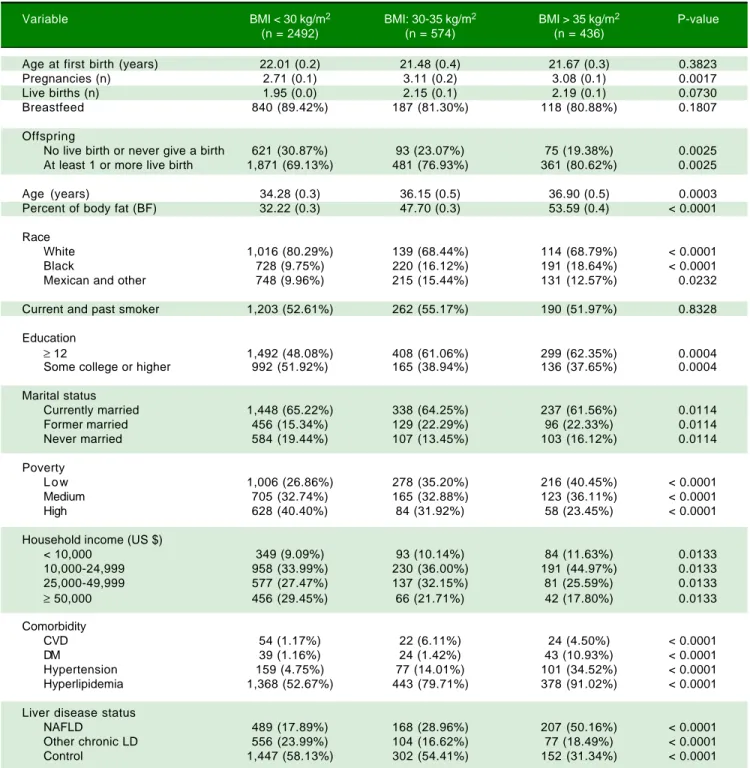
Table 1. Characteristics of the total study women according to BMI.
Variable BMI < 30 kg/m2 BMI: 30-35 kg/m2 BMI > 35 kg/m2 P-value
(n = 2492) (n = 574) (n = 436)
Age at first birth (years) 22.01 (0.2) 21.48 (0.4) 21.67 (0.3) 0.3823
Pregnancies (n) 2.71 (0.1) 3.11 (0.2) 3.08 (0.1) 0.0017
Live births (n) 1.95 (0.0) 2.15 (0.1) 2.19 (0.1) 0.0730
Breastfeed 840 (89.42%) 187 (81.30%) 118 (80.88%) 0.1807
Offspring
No live birth or never give a birth 621 (30.87%) 93 (23.07%) 75 (19.38%) 0.0025
At least 1 or more live birth 1,871 (69.13%) 481 (76.93%) 361 (80.62%) 0.0025
Age (years) 34.28 (0.3) 36.15 (0.5) 36.90 (0.5) 0.0003
Percent of body fat (BF) 32.22 (0.3) 47.70 (0.3) 53.59 (0.4) < 0.0001
Race
White 1,016 (80.29%) 139 (68.44%) 114 (68.79%) < 0.0001
Black 728 (9.75%) 220 (16.12%) 191 (18.64%) < 0.0001
Mexican and other 748 (9.96%) 215 (15.44%) 131 (12.57%) 0.0232
Current and past smoker 1,203 (52.61%) 262 (55.17%) 190 (51.97%) 0.8328
Education
≥ 12 1,492 (48.08%) 408 (61.06%) 299 (62.35%) 0.0004
Some college or higher 992 (51.92%) 165 (38.94%) 136 (37.65%) 0.0004
Marital status
Currently married 1,448 (65.22%) 338 (64.25%) 237 (61.56%) 0.0114
Former married 456 (15.34%) 129 (22.29%) 96 (22.33%) 0.0114
Never married 584 (19.44%) 107 (13.45%) 103 (16.12%) 0.0114
Poverty
L o w 1,006 (26.86%) 278 (35.20%) 216 (40.45%) < 0.0001
Medium 705 (32.74%) 165 (32.88%) 123 (36.11%) < 0.0001
High 628 (40.40%) 84 (31.92%) 58 (23.45%) < 0.0001
Household income (US $)
< 10,000 349 (9.09%) 93 (10.14%) 84 (11.63%) 0.0133
10,000-24,999 958 (33.99%) 230 (36.00%) 191 (44.97%) 0.0133
25,000-49,999 577 (27.47%) 137 (32.15%) 81 (25.59%) 0.0133
≥ 50,000 456 (29.45%) 66 (21.71%) 42 (17.80%) 0.0133
Comorbidity
CVD 54 (1.17%) 22 (6.11%) 24 (4.50%) < 0.0001
DM 39 (1.16%) 24 (1.42%) 43 (10.93%) < 0.0001
Hypertension 159 (4.75%) 77 (14.01%) 101 (34.52%) < 0.0001
Hyperlipidemia 1,368 (52.67%) 443 (79.71%) 378 (91.02%) < 0.0001
Liver disease status
NAFLD 489 (17.89%) 168 (28.96%) 207 (50.16%) < 0.0001
Other chronic LD 556 (23.99%) 104 (16.62%) 77 (18.49%) < 0.0001
Control 1,447 (58.13%) 302 (54.41%) 152 (31.34%) < 0.0001
Data were represented mean (SE) for numerical variables and n (%) for categorical variables. P values reported by linear trend test for numerical variables and χ2 test for categorical variables.
trends test for numerical variables and Wald CHISQ test for categorical variables were tested. BMI determined cat-egories were based on range of BMI and obesity/morbidi-ty obesiobesity/morbidi-ty. For having at least one live birth, simple logistic regression models with linearized estimated and
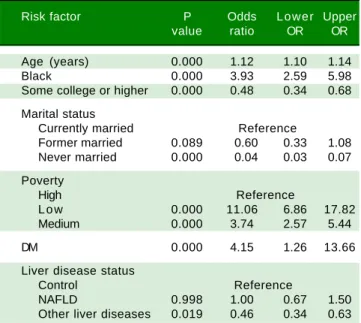
Table 3. Multivariate logistics model on having at least one live birth vs never/no live birth.
Risk factor P Odds Lower Upper value ratio OR OR
Age (years) 0.000 1.12 1.10 1.14
Black 0.000 3.93 2.59 5.98
Some college or higher 0.000 0.48 0.34 0.68
Marital status
Currently married Reference
Former married 0.089 0.60 0.33 1.08
Never married 0.000 0.04 0.03 0.07
Poverty
High Reference
L o w 0.000 11.06 6.86 17.82
Medium 0.000 3.74 2.57 5.44
DM 0.000 4.15 1.26 13.66
Liver disease status
Control Reference
NAFLD 0.998 1.00 0.67 1.50
Other liver diseases 0.019 0.46 0.34 0.63
Data were represented mean (SE) for numerical variables and N (%) for categorical variables. P values reported by t tests for numerical variables and
χ2 tests for categorical variables.
risk factors and we did not find any effect modifications. All analyses computed in SAS version 9.3 (SAS Institute).
RESULTS
Of the 3,502 eligible non-pregnant women, the average age was 34 years, the average BMI was 26 kg/m2, 78% were White, 65% were married, 22% had NAFLD, and 22% had other CLD. Among those who had other CLD, partici-pants with a higher household income (4th quartile) were more likely to be White (92% as compared 1st Q: 51% White) and less likely to have at least one live birth (54 vs.
65%), and DM (0.2 vs. 3%), and similar about obesity (BMI < 30, 88% vs. 82%) (data not shown). On the other hand, among those who had NAFLD, participants with a higher household income (4th quartile) were more likely to be White (87% as compared 1st Q: 47% White), more likely to have at least one live birth (73 vs. 67%), less likely to have DM (2 vs. 6%), and not likely to be obese (BMI < 30, 73% vs. 47%). The proportion of other CLDs were 44% alcoholic LD, 19% iron overload, 9% HCV, and 2% HBV in cohort of other LD.
The study characteristics presented across BMI groups were shown in table 1. Compared to obese groups (BMI > 30) a higher percentage of participants in not obese (BMI < 30) group were White, less likely to have live births, had lower prevalence of diabetes, and NAFLD (P < 0.05). Table 2 shows the reproductive health status stratified by each LD status. The proportions of having live births were higher in NAFLD (77%) and hepatitis B / Hepatitis C (78%) than other LD (59% in alcoholic LD and 70% in iron overload) and Control (72%). On the oth-er hand, aftoth-er controlling for covariates using adjusted lo-gistic regression model, older age (OR: 1.12 [95% CI, 1.10-1.14]), Black race (OR: 3.93 [95% CI, 2.59-5.98]), and poverty (ref: high vs. low, OR: 3.74 [95% CI, 2.57-5.44])
were positively associated with having live births (Table 3). In this model, having other type of CLD was inversely associated with having live births (OR: 0.46 [95% CI, 0.34-0.63]). In fact, after controlling for confounders, NAFLD or high BMI were not associated with parity as measured by this study.
DISCUSSION
This study revealed some intriguing findings in means of parity rates among patients with different types of liver
Table 2. Reproductive health of women according to chronic liver diseases status.
Variable Viral hepatitis Alcoholic liver disease Iron overload NAFLD Control
(n = 106) (n = 440) (n = 112) (n = 864) (n = 1901)
Age (years), mean (SE) 36.75 (1.07) 33.54(0.77) 34.01 (0.78) 35.71 (0.53) 34.57 (0.32)
Age at the first birth (years), 19.43 (0.41) 20.86(0.33) 23.24 (0.41) 22.28 (0.25) 21.82 (0.20)
mean (SE)
Pregnancies (n), mean (SE) 3.09 (0.22) 2.87 (0.130 2.86 (0.14) 2.93 (0.09) 2.74 (0.06)
Live births (n), mean (SE) 2.05 (0.22) 1.76 (0.09) 1.95 (0.15) 2.14 (0.06) 2.00 (0.05)
Breastfeed, % 75% 86% 92% 88% 87%
Offspring, %
No live birth or never give a birth 22% 41% 30% 23% 28%
At least 1 or more live birth 78% 59% 70% 77% 72%
Data were represented mean (SE) for numerical variables and n (%) for categorical variables. P values reported by t tests for numerical variables and χ2 tests
diseases. First, live births were associated with known so-cio-demographic factors. Second, BMI and NAFLD did show some association with increased number of live births, but this was not confirmed after controlling for confounders. In contrast, having other liver diseases was associated with lower parity.
The association of higher BMI and NAFLD with high-er parity is inthigh-eresting. The prevalence of ovhigh-erweight and obesity increased substantially in the last decades and this trend is true for the entire population, women in child-bearing age. In fact, pregnancy may promote temporary obesity, which could remain an important challenge post-partum. Studies have revealed that between 30 - 50% of women become either overweight or obese during early pregnancy.14,15 In fact, in a recent study from Wisconsin, United States, nearly half of mothers in 2011 had a BMI > 25 kg/m2 just prior to pregnancy.16 This study, as well as others, has suggested that being multiparous and multi-gravidous are associated with being overweight.17,18 In this context, higher numbers of pregnancies and live births seem to be associated with the increasing levels of BMI. This is most likely due to the excess weight retained after giving birth. In fact, some studies have suggested that the range of weight gain can be as high as 20 kg in some wom-en.19-24 Furthermore, about 40% of overweight women be-came obese 12 months post-partum and 18% of normal weight women moved to overweight category.25,26 More importantly, the more children a woman had, the more likely she was to become obese and the short inter-preg-nancy interval was another factor for developing obesity in multiparous women.18,27,28 These facts can be an explana-tion for the higher likelihood of having at least 1 or more live births in women with a BMI > 35 than < 30. This is the first study that provided some evidence associating risk of NAFLD in patients with higher rates of live births. Another important finding of our study was the signifi-cant difference in live birth rates among patients with chronic liver disease. The mean number of live births was higher in patients with NAFLD (2.14) and hepatitis (2.05) than patients with alcoholic liver disease (1.76). Similarly, the proportion of patients with at least one live birth was higher in patients with NAFLD (77%) and hepatitis (78%) than alcoholic liver disease (59%). Indeed, an explanation for this difference, other than becoming more overweight after successive deliveries, could be the different response to ethanol among females. It was previously shown that al-coholic liver injury is more serious and rapidly develop-ing in women than men, even with a lower daily intake.29,30 In premenopausal women, chronic ethanol consumption increases the frequency of menstrual disturbances, abor-tions, miscarriages, and leads to early menopause, even be-fore the liver disease is present,31 which might have an effect for the lower rates in our study.
Multivariate analysis established a significant associa-tion between the presence of a chronic liver disease other than NAFLD and lower likelihood of having a live birth. In fact, although the effects of chronic liver disease on par-ity were studied previously, no concrete conclusion was achieved in this topic. Lee at al. reported that in chronic liver disease, amenorrhea and anovulation usually go hand in hand, which may decrease parity rates. But, it was also noted that women with early and mild liver disease, in the absence of cirrhosis, or who were in remission could ex-pect normal parity rates.32 In a historical study, Varma, et al. stated that patients with chronic hepatitis B and C infec-tion with a mild liver disease had virtually no alterainfec-tions in parity rates.33 Other studies reported that pregnancy was relatively rare in patients with autoimmune hepatitis34 but could occur in women who had good control of dis-ease.35 In our study, the presence of a chronic liver disease other than NAFLD was associated with a lower likeli-hood of having at least one live birth.
On the other hand, the proportion of women with no live birth was significantly lower in patients with NAFLD compared to patients with other chronic liver diseases and controls. Because of the common pathways, NAFLD has always been associated with metabolic syndrome and dis-orders related to insulin resistance, such as polycystic ova-ry syndrome (PCOS).36,37 Previous studies clearly demonstrated that patients with PCOS experience repro-ductive abnormalities, which worsen with increasing ab-dominal obesity.38-40 Because of this relation, it could be hypothesized that patients with NAFLD could have lower parity rates than healthy individuals. However, even though our study did not find such an association between parity rates and NAFLD, our findings should be inter-preted considering the effect of pregnancies, mostly more than one, on women’s weight and possible transformation to NAFLD.
pregnancies, NAFLD may be a consequence of pregnancy, rather than a factor prior to it.
In conclusion, this study showed that compared to control group, the likelihood of having at least one live birth was significantly lower in patients with a liver dis-ease other than NAFLD. Education level and financial sta-tus of women were found to be strong confounders of having at least one live birth. More studies are needed to better understand the effect of liver diseases on women’s reproductive health.
ABBREVIATIONS
• ALD: alcoholic liver disease. • BMI: body mass index. • CLD: chronic liver disease. • CVD: cardiovascular disease. • DM: diabetes mellitus. • HBV: hepatitis B virus. • HCV: hepatitis C virus.
• NAFLD: non-alcoholic fatty liver disease. • NASH: non-alcoholic steatohepatitis. • PCOS: polycystic ovary syndrome. • US: United States.
CONFLICT OF INTEREST
ZMY is a consultant to BMS, Gilead, AbbVie, Intercept, GSK, and Salix.
DECLARATIONS
Ethics approval and consent to participate: The study was approved by Inova Institutional Review Board, the ap-proval number is NHANES IRB: 12.1074.
ACKNOWLEDGEMENTS
The authors would like to thank Deena Hallaji, Manirath Srishord and Aybike Birerdinc for their great support during study process.
REFERENCES
1. Younossi ZM, Zheng L, Stepanova M, Venkatesan C, Mishra A. Clinical outcomes and resource utilisation in Medicare pa-tients with chronic liver disease: a historical cohort study. BMJ Open 2014; 4: e004318.
2. Younossi ZM, Stepanova M, Afendy M, Fang Y, Younossi Y, Mir H, Srishord M. Changes in the prevalence of the most common causes of chronic liver diseases in the United States from 1988 to 2008. Clin Gastroenterol Hepatol 2011; 9: 524-30.e1; quiz e60.
3. Stepanova M, Aquino R, Alsheddi A, Gupta R, Fang Y, Younossi Z. Clinical predictors of fibrosis in patients with
chronic liver disease. Aliment Pharmacol Ther 2010; 31: 1085-94.
4. Roberts HW, Utuama OA, Klevens M, Teshale E, Hughes E, Jiles R. The contribution of viral hepatitis to the burden of chronic liver disease in the United States. Am J Gastroen-terol 2014; 109: 387-93; quiz 386, 394.
5. Bell BP, Manos MM, Zaman A, Terrault N, Thomas A, Navar-ro VJ, Dhotre KB, et al. The epidemiology of newly diagnosed chronic liver disease in gastroenterology practices in the United States: results from population-based surveillance.
Am J Gastroenterol 2008; 103: 2727-36; quiz 2737. 6. World Gastroenterology Organization Global
Guidelines-Nonalcoholic Fatty Liver Disease and Guidelines-Nonalcoholic Steato-hepatitis. http://www.worldgastroenterology.org/guidelines/ global- guidelines/nafld-nash/nafld-nash-english. Published 2012. 7. Younossi ZM, Koenig AB, Abdelatif D, Fazel Y, Henry L,
Wymer M. Global epidemiology of nonalcoholic fatty liver dis-ease-Meta-analytic assessment of prevalence, incidence, and outcomes. Hepatology 2016; 64: 73-84.
8. Golabi P, Sayiner M, Fazel Y, Koenig A, Henry L, Younossi ZM. Current complications and challenges in nonalcoholic st-eatohepatitis screening and diagnosis. Expert Rev Gastro-enterol Hepatol 2016; 10: 63-71.
9. Fazel Y, Koenig AB, Sayiner M, Goodman ZD, Younossi ZM. Epidemiology and natural history of non-alcoholic fatty liver disease. Metabolism 2016; 65: 1017-25.
10. Mishra A, Younossi ZM. Epidemiology and Natural History of Non-alcoholic Fatty Liver Disease. J Clin Exp Hepatol 2012; 2: 135-44.
11. Sayiner M, Koenig A, Henry L, Younossi ZM. Epidemiology of Nonalcoholic Fatty Liver Disease and Nonalcoholic Steato-hepatitis in the United States and the Rest of the World. Clin Liver Dis 2016; 20: 205-14.
12. National Center for Health Statistics: Analytical and Report-ing Guidelines: The Third National Health and Nutritional Ex-amination Survey, Hyattsville, MD, National Center for Health Statistics.
13. National Center for Health Statistics: Plan and Operation of The Third National Health and Nutritional Examination Survey, Hyattsville, MD, National Center for Health Statistics. 14. Cnattingius S, Villamor E. Weight change between
succes-sive pregnancies and risks of stillbirth and infant mortality: a nationwide cohort study. Lancet 2016; 387: 558-65. 15. Hinkle SN, Sharma AJ, Kim SY, Park S, Dalenius K, Brindley
PL, Grummer-Strawn LM. Prepregnancy obesity trends among low-income women, United States, 1999-2008.
Matern Child Health J 2012; 16: 1339-48.
16. Zeal C, Remington P, Ndiaye M, Stewart K, Stattelman-Scan-lan D. The epidemiology of maternal overweight in Dane County, Wisconsin. WMJ 2014; 113: 24-7.
17. Chopra SM, Misra A, Gulati S, Gupta R. Overweight, obesity and related non-communicable diseases in Asian Indian girls and women. Eur J Clin Nutr 2013; 67: 688-696.
18. Melzer K, Schutz Y. Pre-pregnancy and pregnancy predic-tors of obesity. Int J Obes 2010; 34(Suppl. 2): S44-S52. 19. Oken E, Taveras EM, Popoola FA, Rich-Edwards JW, Gillman
MW. Television, walking, and diet: associations with post-partum weight retention. Am J Prev Med 2007; 32: 305-11. 20. Ohlin A, Rössner S. Maternal body weight development after
pregnancy. Int J Obes 1990; 14: 159-73.
21. Linné Y, Barkeling B, Rössner S. Long-term weight develop-ment after pregnancy. Obes Rev 2002; 3: 75-83.
34. Thiele DL. Autoimmune hepatitis. Clin Liver Dis 2005; 9: 635-46, vi.
35. Aggarwal N, Chopra S, Suri V, Sikka P, Dhiman RK, Chawla Y. Pregnancy outcome in women with autoimmune hepatitis.
Arch Gynecol Obstet 2011; 284: 19-23.
36. Targher G, Rossini M, Lonardo A. Evidence that non-alcohol-ic fatty liver disease and polycystnon-alcohol-ic ovary syndrome are as-sociated by necessity rather than chance: a novel hepato-ovarian axis? Endocrine 2016; 51: 211-21.
37. Brzozowska MM, Ostapowicz G, Weltman MD. An associa-tion between non-alcoholic fatty liver disease and polycystic ovarian syndrome. J Gastroenterol Hepatol 2009; 24: 243-47.
38. Ecklund LC, Usadi RS. Endocrine and reproductive effects of polycystic ovarian syndrome. Obstet Gynecol Clin North Am 2015; 42: 55-65.
39. Joham AE, Teede HJ, Ranasinha S, Zoungas S, Boyle J. Prevalence of infertility and use of fertility treatment in wom-en with polycystic ovary syndrome: data from a large com-munity-based cohort study. J Womens Health 2015; 24: 299-307.
40. Revised 2003 consensus on diagnostic criteria and long-term health risks related to polycystic ovary syndrome (PCOS).
41. Ahluwalia N, Dwyer J, Terry A, Moshfegh A, Johnson C. Up-date on NHANES Dietary Data: Focus on Collection, Release, Analytical Considerations, and Uses to Inform Public Policy.
Adv Nutr 2016; 7: 121-34.
Correspondence and reprint request: Zobair M. Younossi, M.D., MPH
Betty and Guy Beatty Center for Integrated Research. Claude Moore Health Education and Research Building
3300 Gallows Road, Falls Church, VA 22042 Tel.: (703) 776-2540. Fax: (703) 776-4386
E-mail: [email protected]
23. Rössner S, Ohlin A. Pregnancy as a risk factor for obesity: lessons from the Stockholm Pregnancy and Weight Develop-ment Study. Obes Res 1995; 3(Suppl. 2): 267s - 275s. 24. Martínez ME, Pond E, Wertheim BC, Nodora JN, Jacobs ET,
Bondy M, Daneri-Navarro A, et al. Association between par-ity and obespar-ity in Mexican and Mexican-American women: findings from the Ella binational breast cancer study. J Immi-gr Minor Health 2013; 15: 234-43.
25. Siega-Riz AM, Herring AH, Carrier K, Evenson KR, Dole N, Deierlein A. Sociodemographic, perinatal, behavioral, and psychosocial predictors of weight retention at 3 and 12 months postpartum. Obesity 2010; 18: 1996-2003.
26. Endres LK, Straub H, McKinney C, Plunkett B, Minkovitz CS, Schetter CD, Ramey S, et al. Postpartum weight retention risk factors and relationship to obesity at 1 year. Obstet Gynecol 2015; 125: 144-52.
27. Hill B, McPhie S, Skouteris H. The Role of Parity in Gestational Weight Gain and Postpartum Weight Retention. Women’s Health Issues 2016; 26: 123-9.
28. Davis EM, Babineau DC, Wang X, Zyzanski S, Abrams B, Bodnar LM, Horwitz RI. Short inter-pregnancy intervals, pari-ty, excessive pregnancy weight gain and risk of maternal obesity. Matern Child Health J 2014; 18: 554-62.
29. Saunders JB, Davis M, Williams R. Do women develop alco-holic liver disease more readily than men? Br Med J 1981; 282: 1140-3.
30. Nanji AA, Jokelainen K, Fotouhinia M, Rahemtulla A, Thomas P, Tipoe GL, Su GL, et al. Increased severity of alcoholic liv-er injury in female rats: role of oxidative stress, endotoxin, and chemokines. Am J Physiol Gastrointest Liver Physiol
2001; 281: G1348-G1356.
31. Becker U. The influence of ethanol and liver disease on sex hormones and hepatic oestrogen receptors in women. Dan Med Bull 1993; 40: 447-59.
32. Lee WM. Pregnancy in patients with chronic liver disease.
Gastroenterol Clin North Am 1992; 21: 889-903.