B Canbakan et al.Leptin in nonalcoholic fatty liver disease 249
www.medigraphic.com
Annals of Hepatology 2008; 7(3): July-September: 249-254Annals of Hepatology
Original Article
Leptin in nonalcoholic fatty liver disease
Billur Canbakan;1 Veysel Tahan;2 Huriye Balci;3 Ibrahim Hatemi;4 Burak Erer;5 Gulsen Ozbay;6 Necdet Sut;7 Munire
Hacibekiroglu;8 Nese Imeryuz;9 Hakan Senturk10
1M.D. Fellow; Istanbul Science University, Avrupa Florence
Nightingale Hospital Research Center, Department of Gastroenterology.
2M.D. Fellow; Marmara University School of Medicine,
Department of Gastroenterology.
3PhD- Cerrahpasa Medical Faculty of Istanbul University, Fikret
Biyal Central Research Laboratory.
4M.D. Fellow; Cerrahpasa Medical Faculty of Istanbul
University, Department of Gastroenterology.
5M.D. Fellow; Istanbul Medical Faculty of Istanbul University,
Department of Internal Medicine.
6M.D. Professor; Cerrahpasa Medical Faculty of Istanbul
University, Department of Pathology.
7M.D. Fellow; Cerrahpasa Medical Faculty of Istanbul
University, Department of Biostatistics.
8PhD-Professor; Cerrahpasa Medical Faculty of Istanbul
University, Fikret Biyal Central Research Laboratory.
9M.D. Professor; Marmara University School of Medicine,
Department of Gastroenterology.
10M.D. Professor; Cerrahpasa Medical Faculty of Istanbul
University, Department of Gastroenterology, Istanbul, Turkey.
Address for correspondence: Veysel Tahan, MD
Marmara University Institute of Gastroenterology, Basibuyuk Maltepe 34672 Istanbul –TURKEY
Phone + 90 2164214379, Mobile: +90 532 3629602, E-mail: [email protected]
Manuscript received and accepted: 6 May and 28 July 2008
Abstract
Background: Non-alcoholic fatty liver disease (NAFLD) is a prevalent condition associated with obe-sity and insulin resistance (IR). Leptin plays a key role in the control of energy balance, and insulin sensitivity. In this study, we aimed to examine whether serum lep-tin levels correlate with insulin resistance, oxidative stress parameters and the severity of histological changes in NAFLD. Methods: Fifty-two patients (M/F: 28/24) with no alcohol intake and biopsy-proven diag-nosis of NAFLD were studied. Serum leptin levels were measured by radioimmunoassay. HOMA (homeostasis model assessment) IR index was calculated. Compari-sons between the patients with NAFLD and non-alco-holic steatohepatitis (NASH) were performed using the Student’s t test. Multivariate regression analysis and the area under the receiver operating characteristic
(ROC) curve were used to identify the independent pre-dictors for NASH. Results: We found no association be-tween serum leptin, fasting insulin levels, and oxidative stress parameters. ROC curve and multiple regression analysis revealed no association between the severity of histological changes and serum leptin levels. During six months followed-up period only NASH group with elevated leptin levels had significant reductions of ALT and AST values (p = 0.03, and 0.005, respectively). Con-clusion: Our findings show a preventive effect of leptin against progressive liver injury in NAFLD.
Key words: Non-alcoholic fatty liver disease, leptin, re-active oxygen species, insulin resistance.
Introduction
Non-alcoholic fatty liver disease (NAFLD) affects 10 to 24 percent of the general population.1 The clinical
spectrum of NAFLD ranges from simple steatosis to ste-atohepatitis (NASH) and even to cirrhosis.2-6 NASH
fquently occurs in the setting of obesity and insulin re-sistance.7-9 Leptin is mainly expressed by adipose
tis-sue. Leptin decreases food intake, and increases energy expenditure.10-14 The principal role of leptin may be to
limit the accumulation of fat in non-adipose tissue, and reduce lipotoxicity.15 By increasing the supply of free
fatty acids (FFA) to the liver, leptin induces dephospho-rylation of insulin receptor substrate 1 to prevent fat ac-cumulation in this organ.16 Hepatic stellate cells
(HCS’s) are the primary source of extracellular matrix proteins, and accordingly fibrosis. Previous observa-tions showed that activated, HSCs express leptin. These findings pointed to the implication of leptin in the fib-rogenesis, and the disease progression.17,18 However
these theoretical concerns were challenged in clinical studies.19,20 On the other hand, by increasing reactive
oxygen species (ROS) leptin may induce Kupffer cells to produce inflammatory cytokines such as tumor ne-crosis factor-α (TNF-α) which interacts with stellate cells and augments collagen gene expression.21-23 In
this study, we aimed to examine whether serum leptin levels correlate with insulin resistance, oxidative stress parameters and the severity of histological changes in NAFLD.
Artemisa
www.medigraphic.com
Methods
Patients
Fifty-two non-drinking patients with biopsy proven diagnosis of NAFLD were enrolled into the study in two university hospital clinics. Patients were referred for the assessment of abnormal liver function tests or hepatic ste-atosis detected by ultrasonography. Most of these pa-tients were referred from the internal medicine outpatient clinic and endocrinology department of the same hospi-tals. Viral hepatitis, autoimmune hepatitis, primary bil-iary cirrhosis, α1-antitrypsin deficiency, Wilson’s
dis-ease, hemochromatosis, and sclerosing cholangitis were excluded with relevant tests. Informed consent was ob-tained from each of the participating subject. Steatosis or hepatomegaly in US was considered enough to perform a liver biopsy after exclusion criteria in patients with ele-vated ALT. Patients were followed up for six months with a dietary advice.
Pathological examination
Liver tissues were stained with hematoxylin-eosin and reticulum. Histological examination was done by an ex-perienced pathologist (G.O.) who was blinded to clinical information using the scoring system described by Brunt et al.24 We defined simple steatosis as steatosis without
fibrosis and inflammation, and NASH as steatosis with in-flammation, ballooning degeneration of hepatocytes, and zone 3 perisinusoidal fibrosis. Steatosis was graded from 1 to 3 (grade 1 up to 33%; grade 2 33-66%; grade3 > 66%). The combination of hepatocellular steatosis, bal-looning, acinar or portal inflammation, and zone 3 peri-cellular fibrosis was used for necroinflammatory grading from 0 to 3. The severity of hepatic fibrosis (stage) was graded with a 4-point scale: stage 1, zone 3 perisinusoi-dal/pericellular fibrosis; stage 2, zone 3 perisinusoidal/ pericellular and periportal fibrosis; stage 3, zone 3 perisi-nusoidal/pericellular portal and bridging fibrosis; stage 4, cirrhosis.
Laboratory evaluations
On the morning of liver biopsy venous blood sam-ples were drawn after an overnight 12-hour fasting pe-riod. The serum levels of ALT, AST, alkaline phos-phatase (ALP), gamma-glutamyltranspeptidase (GGT), bilirubin, total cholesterol, triglyceride, fasting insu-lin, glucose and leptin levels were measured. Total cholesterol, triglyceride were measured by enzymatic methods and glucose was determined by hexokinase method using Abbott C8000 (Abbott, USA) automatic analyzer. Insulin was measured with Immulite 2000 analyzer (DPC, USA) by Chemiluminescent immuno-metric assay.
Serum Leptin was measured using a human IRMA kit (DSL, Texas, USA). The IRMA is a non-competitive as-say in which leptin is sandwiched between two antibod-ies. Samples were incubated overnight in antibody-coat-ed tubes with the secondary radio-labelantibody-coat-ed antibody.
The sensitivity of the assay was 0.10 ng/mL, and the intra-and interassay coefficients of variation (CVs) were 2.6-4.9% and 3.7-6.6%, respectively. The standards ranged from 0.25 to 120.0 ng/mL.
We calculated insulin resistance using the homeostasis model assessment (HOMA-IR) formula [HOMA-IR = fast-ing glucose (mmol/L) x fastfast-ing insulin (μU/mL)/22.5].
Oxidative stress parameters
Malondialdehyde (MDA), and superoxide dismutase (SOD) levels were measured in serum as well as in liver tis-sue homogenates. TNF-alpha receptor (TNF-sRp55) and nitric oxide (NO) levels were measured in sera. MDA as an end product of fatty acid peroxidation was measured by the thiobarbituric acid reactivity assay as previously de-scribed.25 Serum and tissue SOD activities were
deter-mined by inhibition of nitroblue tetrazolium reduction by Xanthine/Xanthin oxidase used as a superoxide genera-tor.26 Nitric oxide level was determined with Griess
reac-tion. A commercially available enzyme-linked immun-osorbent assay (ELISA) kit (R&D systems, Quantikine; Wiesbaden - Nordenstadt, Germany) was used. Serum TNF-sRp55 concentrations were measured using ELISA (Hbt, HyCult Biotechnology; Uden, the Netherlands).
Statistical analysis
Comparison between the patients with simple steato-sis and patients NASH were made with the Student’s t-test or Mann-Whitney t-test. Chi square t-test was used for nominal categorical variables, and the Spearman rank correlation was used to assess the association between continuous variables. Multiple regression analyses, bina-ry logistic regression and linear regression analysis were performed to identify the independent predictors for the degree of steatosis, inflammation, and fibrosis. Area un-der the receiver operating characteristic (ROC) curve was used to demonstrate the diagnostic ability of HOMA-IR, and serum leptin levels to distinguish between simple steatosis and NASH. Results are expressed as the mean ± SD. All analyses were performed with SPSS software for Windows, version 10. P value below 0.05 was considered statistically significant.
Results
Characteristics of the patients
B Canbakan et al.Leptin in nonalcoholic fatty liver disease
www.medigraphic.com
included in the study. There was no difference inrefer-ence to age between males (mean age ± SD: 44.25 ± 8.75) and females (mean age ± SD: 47.12 ± 9.07). Among pa-tients, 16/35 (46%) patients with NASH and 7/17 (41%) subjects with simple steatosis were type 2 diabetic.
Serum leptin levels were significantly higher in fe-males (r = 0.48, p = 0.0001), and positively correlated with body mass index (BMI) (r = 0.43, p = 0.002). How-ever females had significantly higher BMI than the males (31.92 ± 5.36 and 29.24 ± 4.14, respectively, p = 0.04). Serum leptin was, independently, associated with BMI (p = 0.002) but not with gender. Serum leptin levels did not correlate with serum ALT (r = -0.03, p = 0.83), or AST(r = 0.15, p = 0.28) values. To assess whether serum leptin had an effect on insulin resistance, we closely examined the correlation between leptin and carbohydrate metabo-lism. We found no association between serum leptin lev-els and the fasting insulin (r = -0.13, p = 0.5), serum glu-cose (r = 0.2, p = 0.13), and HOMA-IR (r = -0.07, p = 0.6).
Comparative analysis between subjects with simple steatosis and NASH
The mean leptin levels tended to be higher in the group with simple steatosis than the NASH group but the difference between the group was not significant. Demo-graphic, laboratory and histopathological data of
pa-tients with simple steatosis and NASH are summarized in
table I.
In bivariate analysis there was no significant associa-tion between serum leptin levels and the degree of hepat-ic steatosis (r = 0.04, p = 0.75), hepathepat-ic inflammation (r = -0.01, p = 0.92), or hepatic fibrosis (r = 0.04, p = 0.47) in NASH.
Predictors for the histological severity of NAFLD
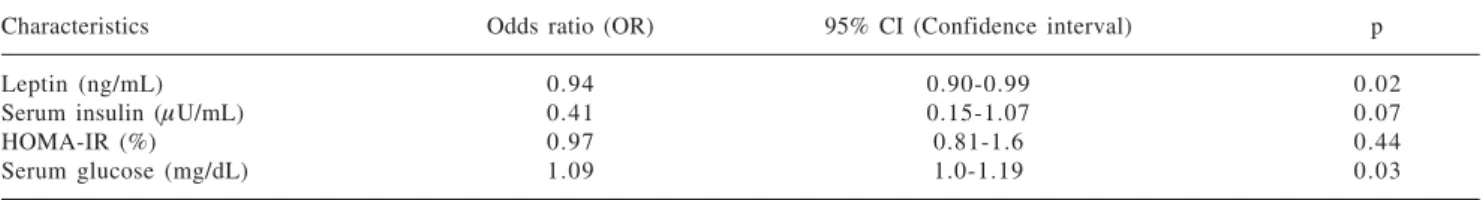
In a multivariate comparison between subjects with NASH, and subjects with simple steatosis we entered HOMA-IR, serum leptin, serum insulin, and serum glu-cose into the model. Only the increased serum gluglu-cose level was a risk factor for the histological disease severi-ty and leptin had preventive effect. The overall accuracy of this analysis was 77.5% (Table II).
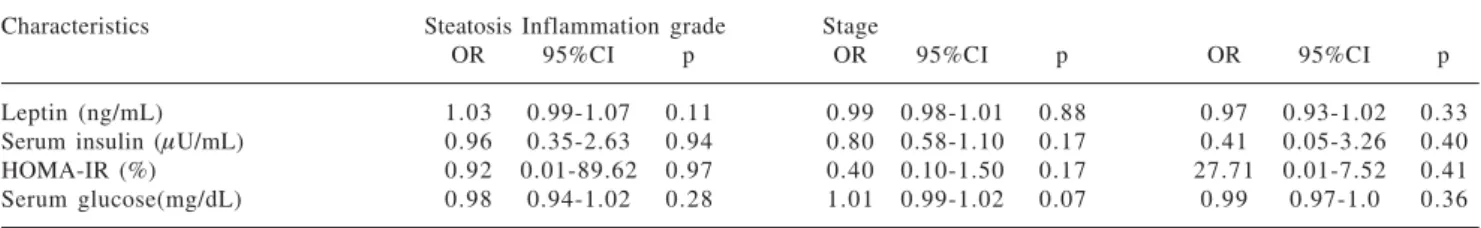
Using multiple regression analysis the independent predictors for the grade of steatosis, inflammation, and fi-brosis were investigated. The relationship between the se-verity of histological changes in NASH and serum leptin, serum glucose, serum fasting insulin levels, and HOMA-IR was analyzed. None of these variables were indepen-dent predictors for disease severity (Table III). Using se-rum leptin levels and HOMA-IR the area under the ROC curve for distinguishing between NASH and simple ste-atosis was 0.60, 95% CI 0.46-0.74, and 0.69, 95% CI
Table I. Demographic, laboratory and histopathological data of the patients with non-alcoholic simple steatosis, versus steatohepatitis. BMI: Body mass index, GGT: Gamma glutamyl transpeptidase, ALP: alkaline phosphatase, NR: normal range.
Simple steatosis Steatohepatitis p
Age (years) 48.58 ± 8.26 48.22 ± 10.69 NS
BMI (kg/m2) 30.85 ± 6.48 30.29 ± 3.99 NS
Leptin (ng/mL) 61.77 ± 36.33 52.64 ± 36.80 NS
Serum insulin (μU/mL) 8.48 ± 9.95 10.49 ± 43.36 NS
HOMA-IR (%) 1.97 ± 2.29 2.9 ± 12.15 NS
Serum glucose (mg/dL) 101.94 ± 9.94 139.77 ± 62.43 0.001
ALT (U/L); NR:7-49 5 3 ± 36.04 69.40 ± 44.63 NS
AST (U/L); NR:7-49 33.23 ± 18.03 49.34 ± 31.61 NS
GGT (U/L); NR:7-49 70.05 ± 90.10 53.77 ± 26.97 NS
ALP (U/L); NR:20-155 118.63 ± 48.28 130.62 ± 54.62 NS
Cholesterol (mg/dL); NR:50-200 227.88 ± 49.55 212.77 ± 38.75 NS
Triglyceride (mg/dL); NR:50-200 193.41 ± 84.25 210.40 ± 108.50 NS
Histological steatosis 1.35 ± 0.6 1.97 ± 0.66 0.002
inflammation grade - 1.45 ± 0.56
stage - 1.71 ± 0.85
NS = statistically not significant; NR= normal range.
Table II. In a multivariate comparison between subjects with NASH, and subjects with simple steatosis only the increased serum glucose level was a risk factor for the histological disease severity. Leptin had preventive effect. The overall accuracy of this analysis was 77.5%.
HOMA-IR: homeostasis model assessment - Insulin resistance.
Characteristics Odds ratio (OR) 95% CI (Confidence interval) p
Leptin (ng/mL) 0.94 0.90-0.99 0.02
Serum insulin (μU/mL) 0.41 0.15-1.07 0.07
HOMA-IR (%) 0.97 0.81-1.6 0.44
www.medigraphic.com
0.53-0.85, respectively (Figure 1 and Figure 2). These-rum HOMA-IR cut off value for the prediction of NASH was £ 0.1%; at this threshold the sensitivity was 78.1% and the specificity 64.7%. The sensitivity for leptin at the threshold 50 ng/mL was 60% and the specificity 70.6%. Both curves didn’t show any respective sensitivi-ty and specificisensitivi-ty for the differentiation between simple steatosis and NASH.
Serum leptin levels were neither correlated with serum NO, SOD and MDA levels (r = 0.09, p = 0.49; r = -0.35, p = 0.06; r = -0.12, p = 0.53, respectively) nor with tissue SOD and MDA levels (r = -0.22, p = 0.23, and r = -0.34, p = 0.85, respectively). The increases in plasma TNF-sRp55 levels correlated inversely with serum leptin levels (r = -0.03, p = 0.04).
Follow-up period
After six months, in NASH patients with more than the mean leptin levels had significant reductions of ALT and
AST values from 82.25 ± 11.26 to 49.83 ± 10.46, p = 0.003, and from 71.58 ± 11.46 to 41.5 ± 7.32, p = 0.005, respectively. In this group, patients with less than the mean leptin levels had no significant reductions in ALT and AST values (p = 0.06, and 0.45, respectively). The changes in relevant biochemical parameters were also not significant in patients with simple steatosis.
Discussion
There are conflicting reports about the exact role of leptin in the pathogenesis of NAFLD. Obesity and insu-lin resistance are the most consistently associated causal factors in NAFLD.7-9 Recent experiments showed that
leptin promotes insulin resistance by inducing the de-phosphorylation of insulin-receptor-substrate 1.16,27 Some
studies have shown that leptin administration might ac-tually improve the insulin resistance in patients with li-podystrophy and in mice with congenital lipodystro-phy.28,29 We did not find any significant association
be-Table III. Multiple regression did not show any correlation between laboratory parameters studided and histological severity in patients with steatohepatitis.
HOMA-IR: homeostasis model assessment - Insulin resistance.
Characteristics Steatosis Inflammation grade Stage
OR 95%CI p OR 95%CI p OR 95%CI p
Leptin (ng/mL) 1.03 0.99-1.07 0.11 0.99 0.98-1.01 0.88 0.97 0.93-1.02 0.33
Serum insulin (μU/mL) 0.96 0.35-2.63 0.94 0.80 0.58-1.10 0.17 0.41 0.05-3.26 0.40
HOMA-IR (%) 0.92 0.01-89.62 0.97 0.40 0.10-1.50 0.17 27.71 0.01-7.52 0.41
Serum glucose(mg/dL) 0.98 0.94-1.02 0.28 1.01 0.99-1.02 0.07 0.99 0.97-1.0 0.36
OR: Odds ratio; CI: confidence intervals
Figure 1. The ROC curve shows that leptin is not a predictor for differentiating between non-alcoholic simple steatosis and steato-hepatitis (NASH) (area under the ROC curve 0.6; 95 % CI: 0.46-0.74).
1,00
,75
,50
,25
0,00
0,00 ,25 ,50 ,75 1,00
1 - Specificity
Sensitivity
Figure 2. The ROC curve shows that HOMA-IR can not be used for distinguishing between non-alcoholic simple steatosis and non-alcoholic steatohepatitis (NASH) (area under the ROC curve 0.69; 95 % CI: 0.53-0.85).
1,00
,75
,50
,25
0,00
0,00 ,25 ,50 ,75 1,00
1 - Specificity
B Canbakan et al.Leptin in nonalcoholic fatty liver disease
www.medigraphic.com
tween serum leptin levels and insulin resistance. Linearregression analysis showed that serum leptin level was not an independent predictor for an increased HOMA-IR. Activated HCS’s are the main course of fibrogenic ac-tions. Isolated HSC’s have been shown to produce lep-tin.17,30-32 This finding indicates that leptin might play a
pivotal role in profibrogenic responses in the liver. Whether leptin levels are altered in NAFLD is controver-sial. There are only few studies done in humans with NAFLD. The published reports have yielded conflicting results regarding the role of leptin in disease progression. Some studies demonstrated increased leptin levels in NASH, while others found no correlation between serum leptin levels and the development of NASH.33,34 Most of
the studies are based on animal models. In ob/ob mice lacking circulating leptin, impaired wound healing and surgical scar formation was documented.35 Lean animals
but not ob/ob littermates had significant fibrosis.36,37
In-creased fibrosis and greater expression of procollagen type I were observed when leptin was injected into rats receiving carbon tetrachloride or thioacetoamide to pro-duce an acute or chronic liver damage, respectively.30
Histopathology is most relevant in grading the sever-ity of NAFLD. Therefore we focused on comparative analysis between subjects with simple steatosis and NASH. Mean leptin levels were higher in the group with simple steatosis compared to the NASH group. In bi-variate analysis there was no significant association be-tween serum leptin levels and the degree of hepatic ste-atosis, hepatic inflammation, or hepatic fibrosis in NASH. Using serum leptin levels, the area under the ROC curve for distinguishing between NASH and NAFL did not show any respective sensitivity and spec-ificity for leptin levels. Moreover in multivariate com-parison serum leptin had low preventive effect against steatohepatitis. Our data excludes the possibility that leptin leads to disease progression.
Some studies have shown that leptin contributes to ox-idative stress and necroinflammation.38,21 Leptin-
defi-cient mice had less necroinflammatory activity in models of T-cell mediated hepatitis which was induced by injec-tion of concavalin A.39 In another study macrophages
ex-pressed the functional long form of the leptin receptor, which indicates that this hormone can attenuate inflam-matory reaction.17
To determine the effect of leptin in necroinflammato-ry activity we investigated the correlation between serum leptin levels and the oxidative parameters. In our study leptin levels didn’t correlate significantly with oxidative stress parameters measured in sera as well as in tissue ho-mogenates. This data also argues against a role for leptin in NAFLD progression.
Higher ALT levels and increase in serum TNF-α levels were observed when carbon tetrachloride intoxication was accompanied by injection of leptin.30 Conversely,
leptin deficiency was associated with increased
hepato-toxicity and mortality following endotoxin administra-tion,40 an effect mediated by increased sensitivity to
TNF-a.41 These indicate the protective effect of leptin
against hepatic injury.
Our findings support this latter suggestion. The re-gression analysis showed that leptin has protective effect against the development of NASH. Leptin levels correlat-ed inversely with TNF-sRp55 levels. Moreover, during the follow-up period patients with NASH and increased leptin levels achieved significant reductions in ALT and AST values.
In conclusion, there was no significant association be-tween serum leptin levels, fasting serum insulin levels, and HOMA-IR. This argues against a potential role played by leptin in insulin resistance development.
Our findings did not show any correlation between se-rum leptin levels and oxidative stress parameters and overall histological severity. Furthermore in NASH pa-tients with elevated leptin levels, improvement in ALT and AST values with dietary advice was significantly higher. This indicates that leptin may have preventive ef-fect against progression of hepatic injury.
References
1. Nomura H, Kashiwagi S, Hayashi J, Kajiyama W, Tani S, Goto M. Prevalence of fatty liver in a general population of Okinawa, Japan. Jpn J Med 1988; 27: 142-9.
2. James OF, Day CP. Non-alcoholic steatohepatitis (NASH): a dis-ease of emerging identity and importance. J Hepatol 1998; 29: 495-501.
3. Angulo P. Nonalcoholic fatty liver disease. N Engl J Med 2002; 346: 1221- 31.
4. Hui JM, Kench JG, Chitturi S, Sud A, Farrell GC, Byth K, Hall P, Khan M, George J. Long-term outcomes of cirrhosis in nonalco-holic steatohepatitis compared with hepatitis C. Hepatology 2003; 38: 420-7.
5. Teli MR, James OF, Burt AD, Bennett MK, Day CP. The natural history of nonalcoholic fatty liver: a follow-up study. Hepatology 1995; 22: 1714-9.
6. Matteoni CA, Younossi ZM, Gramlich T, Boparai N, Liu YC, McCullough AJ. Nonalcoholic fatty liver disease: a spectrum of clinical and pathological severity. Gastroenterology 1999; 116: 1413-9.
7. Chitturi S, Farrell G, Frost L, Kriketos A, Lin R, Fung C, Liddle C, Samarasinghe D, George J. Serum leptin in NASH correlates with hepatic steatosis but not fibrosis: a manifestation of lipotoxicity? Hepatology 2002; 36: 403-9.
8. Hotamisligil GS, Spiegelman BM. Tumor necrosis factor alpha: a key component of the obesity-diabetes link. Diabetes 1994; 43: 1271-8.
9. Czaja MJ. Liver injury in the setting of steatosis: crosstalk be-tween adipokine and cytokine. Hepatology 2004; 40: 19-22. 10. Tartaglia LA, Dembski M, Weng X, Deng N, Culpepper J, Devos
R, Richards GJ, Campfield LA, Clark FT, Deeds J, Muir C, Sanker S, Moriarty A, Moore KJ, Smutko JS, Mays GG, Wool EA, Mon-roe CA, Tepper RI. Identification and expression cloning of a leptin receptor, OB-R. Cell 1995; 83: 1263-71 .
11. Wang Y, Kuropatwinski KK, White DW, Hawley TS, Hawley RG, Tartaglia LA, Baumann H. Leptin receptor action in hepatic cells. J Biol Chem 1997; 272: 16216-23.
www.medigraphic.com
13. Chen H, Charlat O, Tartaglia LA, Woolf EA, Weng X, Ellis SJ,Lakey ND, Culpepper J, Moore KJ, Breitbart RE, Duyk GM, Tepper RI, Morgenstern JP. Evidence that the diabetes gene en-codes the leptin receptor: identification of a mutation in the leptin receptor gene in db/db mice. Cell 1996; 84: 491-5.
14. Ghilardi N, Ziegler S, Wiestner A, Stoffel R, Heim MH, Skoda RC. Defective STAT signaling by the leptin receptor in diabetic mice. Proc Natl Acad Sci U S A 1996; 93: 6231-5.
15. Lee Y, Wang MY, Kakuma T, Wang ZW, Babcock E, McCorkle K, Higa M, Zhou YT, Unger RH. Liporegulation in diet-induced obesity. The antisteatotic role of hyperleptinemia. J Biol Chem 2001; 276: 5629-35.
16. Cohen B, Novick D, Rubinstein M. Modulation of insulin activi-ties by leptin. Science 1996; 274: 1185-8.
17. Potter JJ, Womack L, Mezey E, Anania FA. Transdifferentiation of rat hepatic stellate cells results in leptin expression. Biochem Biophys Res Commun 1998; 244: 178-82.
18. Marra F. Leptin and liver fibrosis: a matter of fat. Gastroenterol-ogy 2002; 122: 1529-32.
19. Giannini E, Botta F, Cataldi A, Tenconi GL, Ceppa P, Barreca T, Testa R. Leptin levels in nonalcoholic steatohepatitis and chronic hepatitis C. Hepatogastroenterology 1999; 46: 2422-5. 20. Nakao K, Nakata K, Ohtsubo N, Maeda M, Moriuchi T, Ichikawa T,
Hamasaki K, Kato Y, Eguchi K, Yukawa K, Ishii N. Association between nonalcoholic fatty liver, markers of obesity, and serum leptin level in young adults. Am J Gastroenterol 2002; 97: 1796-801. 21. Loffreda S, Yang SQ, Lin HZ, Karp CL, Brengman ML, Wang
DJ, Klein AS, Bulkley GB, Bao C, Noble PW, Lane MD, Diehl AM. Leptin regulates proinflammatory immune responses. FASEB J 1998; 12: 57-65.
22. Bouloumie A, Marumo T, Lafontan M, Busse R. Leptin induces oxidative stress in human endothelial cells. FASEB J 1999; 13: 1231-8.
23. Zhang HH, Kumar S, Barnett AH, Eggo MC. Tumour necrosis factor-alpha exerts dual effects on human adipose leptin synthe-sis and release. Mol Cell Endocrinol 2000; 159: 79-88. 24. Brunt EM, Janney CG, Di Bisceglie AM, Neuschwander-Tetri
BA, Bacon BR. Nonalcoholic steatohepatitis: a proposal for grad-ing and staggrad-ing the histological lesions. Am J Gastroenterol 1999; 94: 2467-74.
25. Buege JA, Aust SD. Microsomal lipid peroxidation. Methods Enzymol 1978; 52: 302-10.
26. Sun Y, Oberley LW, Li Y. A simple method for clinical assay of superoxide dismutase. Clin Chem 1988; 34: 497-500.
27. Sivitz WI, Walsh SA, Morgan DA, Thomas MJ, Haynes WG. Effects of leptin on insulin sensitivity in normal rats. Endocrinol-ogy 1997; 138: 3395-401.
28. Oral EA, Simha V, Ruiz E, Andewelt A, Premkumar A, Snell P, Wagner AJ, DePaoli AM, Reitman ML, Taylor SI, Gorden P, Garg A. Leptin-replacement therapy for lipodystrophy. N Engl J Med 2002; 346: 570-8.
29. Shimomura I, Hammer RE, Ikemoto S, Brown MS, Goldstein JL. Leptin reverses insulin resistance and diabetes mellitus in mice with congenital lipodystrophy. Nature 1999; 401: 73-6. 30. Ikejima K, Honda H, Yoshikawa M, Hirose M, Kitamura T, Takei
Y, Sato N. Leptin augments inflammatory and profibrogenic responses in the murine liver induced by hepatotoxic chemicals. Hepatology 2001; 34: 288-97.
31. Han DC, Isono M, Chen S, Casaretto A, Hong SW, Wolf G, Ziyadeh FN. Leptin stimulates type I collagen production in db/ db mesangial cells: glucose uptake and TGF-beta type II receptor expression. Kidney Int 2001; 59: 1315-23.
32. Baumann H, Morella KK, White DW, Dembski M, Bailon PS, Kim H, Lai CF, Tartaglia LA. The full-length leptin receptor has signaling capabilities of interleukin 6-type cytokine receptors. Proc Natl Acad Sci U S A 1996; 93: 8374-8.
33. Chitturi S, Farrell G, Frost L, Kriketos A, Lin R, Fung C, Liddle C, Samarasinghe D, George J. Serum leptin in NASH correlates with hepatic steatosis but not fibrosis: a manifestation of lipotoxicity? Hepatology 2002; 36: 403-9.
34. Chalasani N, Crabb DW, Cummings OW, Kwo PY, Asghar A, Pandya PK, Considine RV. Does leptin play a role in the patho-genesis of human nonalcoholic steatohepatitis? Am J Gastroenterol 2003; 98: 2771-6.
35. Frank S, Stallmeyer B, Kämpfer H, Kolb N, Pfeilschifter J. Leptin enhances wound re-epithelialization and constitutes a direct function of leptin in skin repair. J Clin Invest 2000; 106: 501-9.
36. Saxena NK, Ikeda K, Rockey DC, Friedman SL, Anania FA. Leptin in hepatic fibrosis: evidence for increased collagen pro-duction in stellate cells and lean littermates of ob/ob mice. Hepatology 2002; 35: 762-71.
37. Ikejima K, Takei Y, Honda H, Hirose M, Yoshikawa M, Zhang YJ, Lang T, Fukuda T, Yamashina S, Kitamura T, Sato N. Leptin receptor-mediated signaling regulates hepatic fibrogenesis and remodeling of extracellular matrix in the rat. Gastroenterology 2002; 122: 1399-410.
38. Faggioni R, Feingold KR, Grunfeld C. Leptin regulation of the immune response and the immunodeficiency of malnutrition. FASEB J 2001; 15: 2565-71.
39. Faggioni R, Jones-Carson J, Reed DA, Dinarello CA, Feingold KR, Grunfeld C, Fantuzzi G. Leptin-deficient (ob/ob) mice are protected from T cell-mediated hepatotoxicity: role of tumor necrosis factor alpha and IL-18. Proc Natl Acad Sci U S A 2000; 97: 2367-72.
40. Faggioni R, Fantuzzi G, Gabay C, Moser A, Dinarello CA, Feingold KR, Grunfeld C. Leptin deficiency enhances sensitiv-ity to endotoxin-induced lethalsensitiv-ity. Am J Physiol 1999; 276: R136-42.