Evaluation of the
role of Meis2
during inner ear
formation and
morphogenesis
Master thesis presented under
tutelage of Dr. Thomas Schimmang
and Dr. Beatriz Durán
Sara Calvo Ibáñez, September 2018
1
INDEX
2 INTRODUCTION ... 2
2.1 MEIS, a subclass of TALE Transcription Factors ... 2
2.2 TALE interaction with HOX ... 2
2.2.1 Hox-independent functions of Meis/Pbx ... 3
2.3 BRIEF SUMMARY OF INNER EAR MORPHOGENESIS ... 4
2.4 LABORATORY PREVIOUS RESULTS ... 7
2.4.1 Role of Meis2 during inner ear induction ... 7
2.4.2 Role of Meis2 after induction of the otic placode ... 7
2.5 Work hypothesis and Objectives ... 9
3 MATERIALS AND METHODS ... 10
3.1 CELL CULTURES ... 10
3.1.1 CELL LINES ... 10
3.1.2 CELL CULTURE MAINTENANCE ... 10
3.1.3 TRANSFECTIONS ... 10
3.2 TRANSGENIC MICE ... 11
3.3 GENOTYPING ... 11
3.3.1 gDNA EXTRACTION ... 11
3.3.2 DNA AMPLIFICATION ... 12
3.4 IMMUNOHISTOCHEMISTRY ... 12
3.4.1 Imaging ... 13
3.5 Gene expression analysis ... 13
3.5.1 RNA extraction ... 13
3.5.2 cDNA synthesis and qRTPCR ... 14
3.6 Statistical analysis ... 14
4 RESULTS ... 15
4.1 Quantification of Meis2 and Chd7 expression in transfected HEK cells ... 15
4.2 Meis2 and Chd7 expression changes upon conditional-deletion of Meis2 ... 17
4.3 Phenotypical analysis of inner ears after conditional deletion of Chd7 ... 18
4.4 Effects of tissue-specific over-expression of Meis2 in the inner ear ... 20
5 Discussion and Conclusions ... 22
6 BIBLIOGRAPHY ... 23
7 Supplementary Material ... 26
7.1 STATISTICAL ANALYSIS ... 26
7.2 GENOTYPING ... 29
7.2.1 CPax Meis ... 29
2 INTRODUCTION
2.1 MEIS,
A SUBCLASS OFTALE
T
RANSCRIPTIONF
ACTORSMeis genes are vertebrate orthologues of the Drosophila homolog homothorax (hth) gene which encode for transcription factors belonging to a subfamily of TALE proteins. In mammals, TALE superclass comprises two families: PBC (Pbx1-4 genes) and MEINOX, this latter including the PREP (Prep1-2 genes) and MEIS (Meis1-3 genes) sub-families (Schulte, 2014).
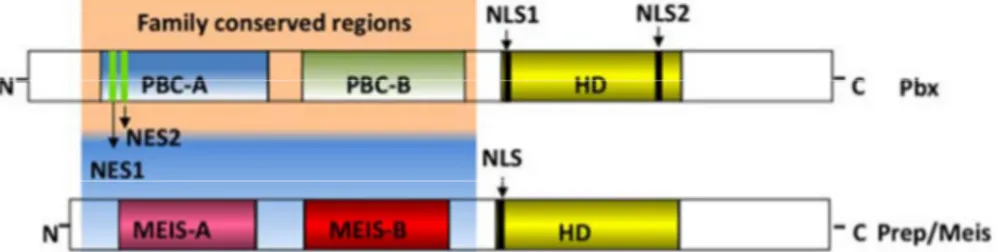
TALE (Three Aminoacid Loop Extension) proteins receive their name from the shared feature of a proline-tyrosine-proline motive insertion between the first and second helix of the highly conserved helix-loop-helix homeodomain. (Longobardi et al., 2014) This homeodomain is around 60 amino acids long and allows TALE proteins to bind to DNA, thus conferring them the ability to act as transcription factors. (Mukherjee and Bürglin, 2007). Additionally, these proteins contain protein-protein interaction domains in their amino-terminal regions that permit them to form complexes with other transcription factors.
While the homeodomain is conserved throughout the members of the TALE class, these amino-terminus regions are family specific: PBX family possess PBC-A and PBC-B domains while the MEIS-A and MEIS-B domains are present in the PREP and MEIS subfamilies.
Figure 1. Obtained from (Longobardi et al., 2014), image depicting the basic structure of the proteins in the TALE family, PBC-A and –B being the characteristic domains of PBX proteins and MEIS-A and –B being the domains present in PREP and MEIS. HD=Homeodomain, NLS= Nuclear Localization Signal,
NES=Nuclear Export Signal.
The full complexity of the TALE transcriptional regulatory network in vivo is only starting to be perceived (Penkov et al., 2013). They form heteromeric complexes with other members of the TALE family, but also with other transcriptional regulators, such as members of the Hox clusters or basic helix-loop-helix (bHLH) proteins (Agoston et al., 2014).
2.2 TALE
INTERACTION WITHHOX
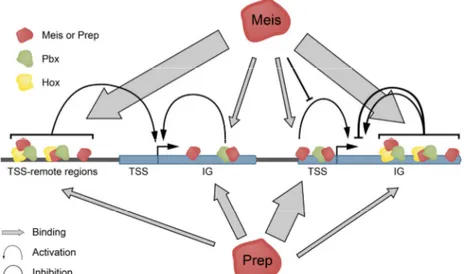
Furthermore, these associations enable binding to DNA sites beyond the known consensus binding motive of each factor alone, increasing the complexity of the system (Penkov et al., 2013). The work of Penkov and colleagues using ChIP-Seq analysis suggests that Meis and Prep gain additional binding specificity in vivo through interaction with cofactors and chromatin landmarks. They found that, while Prep1 interacts preferentially with promoters and nearby regions, Meis shows preference for intergenic and intragenic regions, therefore being more likely to be regulating enhancers.
Figure 2. Extracted from (Penkov et al., 2013), representation of PREP and MEIS as transcription factors, cooperating with themselves and HOX-proteins to regulate gene expression. Prep binds mostly
to promoters in conjunction with Pbx. Meis binds mainly to non-TSS regions in cooperation with Hox proteins, often without contacting DNA.
Hox-dependent functions of TALE include the patterning of the body axis in the developing embryo. In the hematopoietic system, Meis1 cooperates with Pbx and Hox proteins in the balancing between self-renewal and maturation of blood progenitors. Mice carrying mutations in Meis1 have multiple hematopoietic defects, as well as defects in the development of the microvasculature (Hisa et al., 2004). Furthermore, Meis1 is found to be overexpressed in most Acute Myeloid Leukaemias and in some types of Acute Lymphocytic Leukaemias (Azcoitia et al., 2005), indicating a role of Meis family proteins in the regulation of hematopoietic stem cell activity in the adult human.
In the work of M. Torres published in 2014, the authors found that MEIS factors were indirectly controlling Hoxa13 expression pattern in the limb bud, via retinoic acid degradation by regulating CYP26B1 expression (Rosello-Diez et al., 2014).
2.2.1 Hox-independent functions of Meis/Pbx
Nevertheless, functions of the MEINOX and PBC proteins extend beyond the regulation of Hox protein activity. Whereas PBX and PREP are rather broadly expressed in vertebrate embryos (Penkov et al., 2013), Meis gene expression is spatially and temporally highly dynamic and includes many regions in the embryo that lie outside of the classic HOX gene expression domains, indicating that Meis proteins can also act Hox-independently, partnering with other proteins (Irimia et al., 2011).
Among the non-HOX homeodomain proteins with which is MEIS is known to interact are PDX1 in the embryonic pancreas and myogenic bHLH proteins during skeletal muscle differentiation.
Meis1 and Meis2 participate in the developmental regulation of striatal neuron- and cortical interneuron generation, in part through direct control over the expression of Dlx (distalless-) homeodomain proteins. Strong Meis2 expression in the dorsal mesencephalon results in Meis2 displacing a repressor protein and binding to Otx2, thereby causing induction of tectum development (Agoston and Schulte, 2009). It has been reported that MEIS2 cooperates with PAX6 in the control of adult subventricular zone neurogenesis. (Grebbin et al., 2016) Previous studies had shown that MEIS2 interacts with PAX6 and Dlx2 and that this interaction is required for the acquisition of a neuronal fate in the SVZ and that Meis2 plays a role in the generation of dopaminergic neurons in the olfactory bulb (Agoston et al., 2014).
Besides the brain, Meis genes are expressed in other Hox-free embryonic regions, such as the sensory organ primordia. In particular, Meis1 is expressed in the vertebrate forebrain and sensory organ primordia, including the eye (Marcos et al., 2015)(Erickson, French and Waskiewicz, 2010)(Hisa et al., 2004), the vomeronasal organ of the mouse (Chang and Parrilla, 2016), or the inner ear (Sánchez-Guardado et al., 2011); however, the work of Sánchez-Guardado only expression pattern of Meis genes during the morphogenesis of the inner ear.
All things considered, Dr. Schimmang decided to start an investigation line with the aim of gaining a comprehensive and extensive view of
the role of the TALE transcription factor Meis2 during inner ear formation.
2.3 BRIEF
SUMMARY
OF
INNER
EAR
MORPHOGENESIS
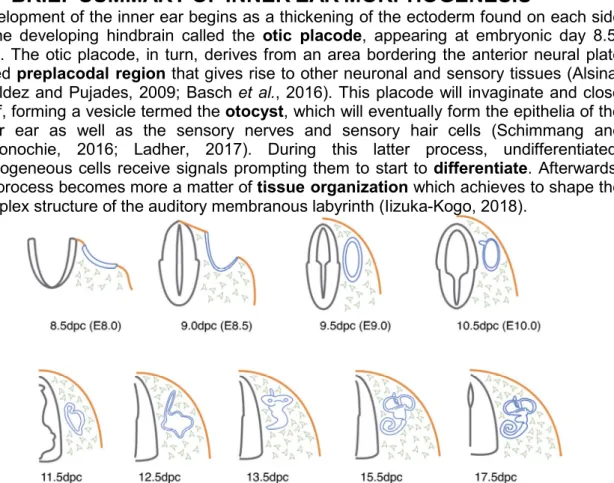
Development of the inner ear begins as a thickening of the ectoderm found on each side of the developing hindbrain called the otic placode, appearing at embryonic day 8.5-8.75. The otic placode, in turn, derives from an area bordering the anterior neural plate called preplacodal region that gives rise to other neuronal and sensory tissues (Alsina, Giraldez and Pujades, 2009; Basch et al., 2016). This placode will invaginate and close itself, forming a vesicle termed the otocyst, which will eventually form the epithelia of the inner ear as well as the sensory nerves and sensory hair cells (Schimmang and Maconochie, 2016; Ladher, 2017). During this latter process, undifferentiated, homogeneous cells receive signals prompting them to start to differentiate. Afterwards, the process becomes more a matter of tissue organization which achieves to shape the complex structure of the auditory membranous labyrinth (Iizuka-Kogo, 2018).
Figure 3 (Schimmang and Maconochie, 2016). Schematic overview of early inner ear development in the mouse. Stages of development are shown under each figure as days post-coitum (dpc). The first emergence of the inner ear is as a thickening of surface ectoderm, the otic placode (blue, 8.5 dpc) from
In the process of the organogenesis, signals coming from the hindbrain and the notochord regulate regionalization, hence dividing the otocyst intro three cardinal axis (regionalization dorso-ventral, anterior-posterior, medio-lateral).
Figure 4 (Iizuka-Kogo, 2018) Development of the membranous labyrinth of the inner ear. Dark blue: endolymphatic duct, green: six prosensory epithelia
Regarding the auditory sensory morphogenesis, the cochlear duct development begins (at E11) as a protrusion of prosensory Sox2+ cells at the ventral end of the otocyst that continues to elongate and coil in an anterior-medial direction, until it acquires a full 1 and ¾ turn in mice (Basch et al., 2016). Several transcription factors such as WNT, FGF, BMP, SHH, Notch-signaling, are known to play roles in this complex spatiotemporal regulation process (Schimmang, 2013; Schimmang and Maconochie, 2016; Iizuka-Kogo, 2018).
After an initial proliferation period, the prosensory progenitor cells exit cell cycle starting in the apex of the cochlear duct towards the base. Basal region undergoes final divisions around E14.5-E15 (Schimmang and Pirvola, 2013) (Kelley, 2006).
When sensory progenitors are post-mitotic, subsets of cells begin to differentiate in the sensory epithelium that will form the organ of Corti. Its structure can be summed up as an arrangement of 1 row of inner hair cells and 1 row outer hair cells among supporting cells, all distributed along the span of the spiral. One of the first markers of hair cells differentiation is the bHLH transcription factors Atoh1.
Interestingly this differentiation into HCs or SCs (between E12-E14) occurs in a base-to-apex manner, in contrast to the cell cycle exit.
However, this differentiation is not uniform along the epithelium. In fact, a tonotopic axis1 is stablished also in the morphology of hair cells (Lewis and Davies, 2002): the stereocilia present a stair-case pattern, the electrophysiological properties of the cells differ from base to apex.
In this process of differential differentiation, gradients of morphogenes must play a role. As well, the system of convergent extension2 is thought to be one of the underlying mechanisms creating hair bundle asymmetry (Wang et al., 2005). It is believed to start after the final cell division.
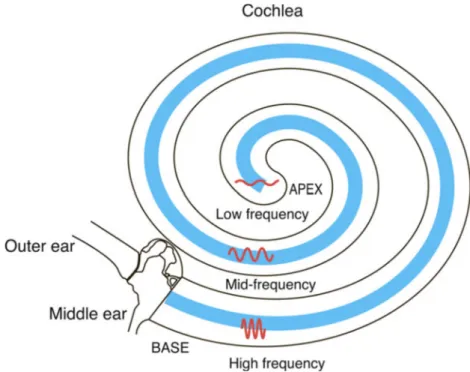
Figure 6 (Schimmang and Maconochie, 2016) Schematic diagram of the cochlea illustrating the tonotopic axis along the cochlear coil. Hair cells (found within the organ of Corti; blue) respond to different frequencies of sound waves dependent on their position along the cochlear coil as illustrated.
1
Tonotopic axis: the physical properties of the membranes of the organ of Corti follow a gradient that allows them to respond to different frequencies along the length of the cochlea.
2
2.4 LABORATORY
PREVIOUS
RESULTS
2.4.1 Role of Meis2 during inner ear induction
First, the lab members assessed the expression pattern of Meis2 in the mouse embryo using RNA in situ hibridization. Meis2 was detected in the hindbrain flanking the otic placode, the endoderm and the mesoderm and otic placode itself.
Null mutants of Meis exhibited a severe reduction of the otic vesicle, pointing to a crucial role in the induction of the otic placode. In order to identify the inducing and responding tissue in terms of Meis role on placode induction, several lines of mice with conditional-inactivation of Meis were used. Inactivation of Meis with Pax2-Cre (inner ear tissue, Pax2 is one of the earliest markers of inner ear tissues) and Foxg1-Cre (expression in ecto-, endo- and mesoderm) resulted in a smaller otic vesicles.
2.4.2 Role of Meis2 after induction of the otic placode
At E10, Meis expression was found to restricted to the dorsal part of the vesicle, and continued to be expressed in the hindbrain. At E15, Meis was detected in the cochlear duct, the ganglion, and the auditory nerve.
Deletion of Meis had no effect on the utricle and saccule, but the cochlea did not develop correctly, its shape first extending straight and then making a radical turn at the apex.
This truncated ear phenotype was replicated when Meis was conditionally inactivated using Pax2-Cre and Foxg1-Cre.
In order to identify potential gene targets of Meis that could lead to this phenotype, Dr. Duran performed RNA-seq on CrePax2Meis2 mutant inner ears at E15 and compared the gene expression data to that of the wild type tissue. In this set of experiments, differential expression was found for Chd7.
Chd7 gene belongs to the Chromodomain-Helicase-DNA-binding (CHD) family, a group of ATP-dependent enzymes able to remodel chromatin, hence having an obvious role in transcriptional regulation (Bouazoune and Kingston, 2012). Defects in this regulation lead to severe disorders in vertebrate development. Mutations in the Chd7 gene are known to cause severe human disorders, such as the CHARGE syndrome. (Villate et al., 2018) Interestingly, Chd7 is one of the genes in which (Marcos et al., 2015) found an enrichment with the Meis1/2 antibody in their Chip-Seq analysis.
APEX
BASE
Pax2CreMeis2ko
myoVII
APEX
BASE
Phenotype of wild-type (LEFT) and Pax2-Cre Meis2ko (RIGHT) at P0
An experiment of qRTPCR was performed by Dr. Duran to confirm downregulation of Chd7 mRNA levels in Meis conditional knock out compared to wild-type E15 inner ears. In this experiment, a fold change of 0,58 was found for Chd7, compared to the wild type inner ear tissue.
Expression patterns of Chd7 at P0 were analysed and found to be strong in the ganglion and hair cells.
Interestingly, when analysing Chd7 mutants, Chd7-/- presented a small otic vesicle, and inactivation of Chd7 with Foxg1-Cre led to the same phenotype of the coiled cochlea.
1
0,580352
0 0,2 0,4 0,6 0,8 1 1,2
E15 WT E15 KO
Chd7 mRNA expression (2-∆∆Ct)
0
-0,236309
-0,3 -0,2 -0,1 0 0,1 0,2 0,3
E15 WT E15 KO
2.5 W
ORK HYPOTHESIS ANDO
BJECTIVESGiven these points, the overall aim of this work will be to explore further the role of Meis2 during inner ear development, concretely to check the hypothesis that Meis2 regulates, directly or indirectly, the expression of Chd7.
As such, this work will try to explore the following research questions:
Do conditional inactivation and overexpression of Meis2 have any effect on Chd7 expression?
Does inactivation of Chd7 with the same Cre deleter result in an equivalent phenotype to that observed after inactivation of Meis2?
Does Meis2 overexpression drive to any phenotypical alteration of the morphology of the inner ear?
To answer such questions, the following specific objectives will be pursued:
1. Confirm downregulation of Chd7 in E15 cochleae after Meis conditional deletion. 2. Examine the phenotype of Chd7-inactivated E15 inner ears.
3 MATERIALS
AND
METHODS
3.1 CELL
CULTURES
3.1.1 CELL LINES
HEK293: Transformed human cell line derived from embryonic kidney (Graham et al., 1977).
HeLa. Human cell line derived from epithelial adenocarcinoma cells from the cervix of a female patient. (Gey, Coffmann and Kubicek, 1952)
OCK3. Cell lines derived from the epithelial Organ of Corti of a transgenic mouse harbouring a thermolabile large SV40 T-antigen gene under the control of an γ-interferon inducible promoter. These cells proliferate at permissive conditions (33ºC, 10% CO2), but reduce proliferation and start differentiating at nonpermissive conditions (39/37ºC, 5% CO2). (Kalinec et al., 1999)
HEI-OC1. Sisters of the above mentioned OCK3, these cell lines are derived from long-term cultures of cochleae of the same kind of transgenic mouse, and used as a model for otic cytotoxicity assays. (Kalinec et al., 2003)
3.1.2 CELL CULTURE MAINTENANCE
Adherent cells were maintained in incubators at 37ºC, 5%CO2 and humidity (?). They were grown in DMEM medium (REF) supplemented with 10% FBS (Gibco, USA), 1X GlutaMAX™ (Gibco, USA), 1% penicillin/streptomycin (REF) and 1 nM sodium pyruvate (REF) in T75 flasks.
When the cultures reached an appropriate confluence, they were subcultured to a new T75 flask following these steps: remove culture medium, wash with PBS, add trypsin-EDTA 0,05%, incubate, add an equal volume of culture media to inactivate trypsin, transfer to a 15 ml falcon tube, centrifuge 3 min 1000 rpm, remove medium and resuspend pellet in new medium to achieve desired seeding density, transfer to a new seeding surface.
3.1.3 TRANSFECTIONS
HEK-293 cells to be transfected were seeded in 6 mm diameter wells the day before in their regular culture media. This media was changed to transfection DMEM media3 without serum or antibiotics moments before the transfection.
HEK cells were transfected using Lipofectamine 2000 (Invitrogen) in a ratio of 1ng of plasmid per 3 µl of lipofectamine.
Meis-A Meis-190
Source Origene (commercial) M. Torres (Madrid) Stock concentration 3402’3 ng/µl 3041’1 ng/µl
DNA solution: 2ng of DNA
0’58 µl plasmid in 100 µl of medium
0’66 µl plasmid in 100 µl of medium
Lipofectamine solution: 1:3 ratio
6 µl lipopectamine in 100 µl of DMEM
6 µl lipofectamine in 100 µl DMEM
Table 1
DNA solution was added to the Lipofectamine solution and incubated for 15 minutes. The mixture was then distributed on the surface of the well, where the cells were growing in transfection medium. After 3-3:30h, the medium of the well was changed to the routine medium.
3
3.2 TRANSGENIC
MICE
Foxg1-Cre mice. Cre recombinase is targeted to the Foxg1 locus, and thus will act on the tissues and moments in which this gene is normally expressed (Hébert and McConnell, 2000).
Sox2-Cre mice (Hayashi et al., 2002).
Rosa 26 Reporter mice (Robertson, 1999). Reporter mice in which LacZ gene preceded by a floxed neo expression casette is targeted to the ROSA26 locus, which constitutively expressied during embryonic development. This line is a reporter of Cre activity.
Pax2-Cre mice (Ohyama and Groves, 2004). Pax2 is one of the earliest markers of the otic placode (feffer 1998). It is expressed in every cell in the developing otocyst formed by invagination of the otic placode.
Meis2flox/flox mice. In these mice, Meis2 gene is flanked by two flox sequences that will be recognized by the Cre recombinase, hence deleting the sequenced contained between them.
Reportero26Meis2a. This mouse is a knock-in line in which Meis2a expression is activated by Cre activity when the recombinase eliminates the floxed stop sequence: R26loxP-STOP-loxP-Meis2a-IRES-eYFP in the original paper (Rosello-Diez et al., 2014).
Chd7flox/flox mice. Equivalent to Meis2flox/flox
Females of identical genotype were housed together, while males were kept isolated. Each male was mated with 2 females either at early morning or during the night. If mating was successful, a vaginal plug was detected the following afternoon (in the case of matings that took place during the mornings) or early morning (0.5 dpc, matings produced during the night). These plugs, consisting of coagulated male ejaculation, persist for several hours after coitus and, while they were not a guarantee of fecundation, their presence was recorded, in order to time the beginning of the pregnancy. Hence, females in which vaginal plugs were detected were removed from the male cage and weighted daily to detect pregnancy-caused weight gain until desired embryonic stage was reached. Females that had not gained weight at that moment were used to rebreed, while females that had put on weight were sacrificed by cervical dislocation and dissected. The uterine horn/tubes were excised, and embryos collected.
3.3 GENOTYPING
Transgenic mouse lines are established, but the offspring obtained from lab crossings must be classified as to whether they carry the desired genetic modification or not. This is called genotyping, and was performed via PCR, using gene-specific primers.
3.3.1 gDNA EXTRACTION
The source of the DNA determined the protocol to be performed, mostly because of the different efficiencies of the employed methods: given the scarce material that can be biopsied from an embryo, a preferred method was that leading to minimum loss of DNA. 3.3.1.1 gGNA extraction from mouse embryo
After embryo extraction, the embryonic membrane/yolk sac was removed and placed in an Eppendorf tube. The Eppendorf was marked with necessary information and then ~100 μl of lysis buffer were added. This lysis buffer contains 0.4-0.5 μl/ml of proteinase K. The tubes were then heated at 65ºC for 30 min and agitated and heated at 95ºC for 15 min. After centrifugation at max speed, supernatant was transferred to a new Eppendorf tube and stored at 4ºC until prompt use (otherwise at -20ºC for longer periods).
3.3.1.2 gDNA extraction from mice
Buffer is a solution of 50mM Tris-HCl pH8, 100 mM EDTA, 100 mM NaCl, 1% SDS on distilled water. 1µl of proteinase K was added and the tails were incubated overnight at 55ºC and agitated. Afterwards, 250 µl of 5M NaCl were added and mixed with the tube content. After centrifugation at maximum speed for at least 10 minutes, supernatant was recovered and transferred to a new tube. 500 µl of isopropanol were added and the mixture was centrifuged at maximum speed for at least 1 min. Following this precipitation step, supernatant was discarded, and the pellet was washed with 1 ml EtOH 70% and spin-dried at maximum speed to precipitate again the DNA. Ethanol was removed completely, and pellet was resuspended in 100 µl of Elution Buffer.
3.3.2 DNA AMPLIFICATION
Embryonic and adult DNA samples were then analyzed to determine if the source organism harbour the corresponding wild-type and mutated alleles. Specific primers for these genes were used in the PCRs, and the PCR products were run on a 2% agarose gel along with molecular markers that allowed to determine the expected sizes for each gene product.
TRANSGENE PRIMER CODE SEQUENCE
Cre recombinase CRE 12 (FISCHER)
5‘ CAA TGG TAG GCT CAC TCT GGG AGA TGA TA 3‘
CRE 26 (FISCHER)
5‘ CCT GGA AAA TGC TTC TGT CCG 3‘
CRE 36 (FISCHER)
5‘ CAG GGT GTT ATA AGC AAT CCC 3‘
CRE 70 (FISCHER)
5‘ AAC ACA CAC TGG CAG GAC TGG CTA GG 3‘
Meis2 (floxed) Meis2FW (ISOGEN LIFE SCIENCE)
5‘ CAA GGA CGC AAT CTA TGG GTA 3‘
Meis2RV (ISOGEN LIFE SCIENCE)
5‘ TGC AGA AAA CTT TCC TCT TAA TCA 3‘
MEIS RV MUT (ISOGEN LIFE SCIENCE)
5‘ TCG CTG GAG AAA CAG CAG GGC 3‘
Reportero26Meis2a R26WTM2a Rev1 (FISCHER)
5‘ AGG CTG CAG AAG GAG CGG GA 3‘
R26M2 315 (FISCHER)
5‘ GCG AAG AGT TTG TCC TCA ACC 3‘
R26m2A 883 (FISCHER)
5‘ AAA GTC GCT CTG AGT TGT TAT 3‘
Chd7 (floxed) P458 (FISCHER)
5‘ ATT TTT CTG AAT GCA TCT TCA CCT 3‘
P459 (FISCHER)
5‘ AGG CAA AGC CTT TCC TTC A 3‘
Table 2
3.4 IMMUNOHISTOCHEMISTRY
The frozen samples were sectioned using the cryostat Microtom HM550, in 30 µm thick cuts. Sections were placed on glass slides, which were specially treated to electro-statically attract the frozen tissue.
After resting several minutes at room temperature, the slides were washed in 0.1%Triton-containing-PBS solution in order to allow permeabilization to occur, and placed in a humidity chamber to prevent dehydration of samples.
Blocking of potential non-specific binding sites was achieved by incubation with filtered, inactivated 10X animal serum (mostly, FBS).
Blocking was followed by overnight incubation with the primary antibody solution (desired concentration in same animal serum) at 4ºC.
After washing, incubation with secondary antibody solution took place at room temperature for 2 hours in the dark.
Finally, mounting and counterstaining were performed simultaneously with DAPI-containing Vectashield mounting medium.
PRIMARY ANTIBODY DILUTION SPECIES
anti-Meis K-830 1:800 rabbit
anti-Meis K-846 1:200 rabbit
anti-Chd7 1:500
anti-myosin VI 1:50
SECONDARY ANTIBODY DILUTION SPECIES anti-rabbit IgG-Alexa 568
conjugated
1:1000 Table 3
3.4.1 Imaging
Visualization and photography acquisition were achieved using Nikon Microscope Eclipse 80i equipped with Digital camera DXM1200C and NIS-Elements software (Nikon Corporation, Japan).
3.5 G
ENE EXPRESSION ANALYSIS3.5.1 RNA extraction
3.5.1.1 FROM CELL CULTURES
RNA isolation from adherent cell cultures was performed as follows:
1. Medium was removed and the adherent layer was washed with PBS.
2. Growth surface was washed with 1 ml Trizol and left for several minutes at room temperature. This lysate was collected in Eppendorf tubes and 200 μl of chloroform were added.
3. After vigorous mixing for 15s, the lysate was centrifuged for 15-20 min at maximum speed at 4ºC.
4. Aqueous phase was recovered and transferred to a new Eppendorf tube, to which an equivalent volume of cold isopropanol was added. The mixture was left to precipitate overnight at -20ºC.
5. Tubes were centrifuged at 4ºC at maximum speed for at least 30 min. Supernatant was discarded and the pellet was washed with 1 ml cold ethanol 70%.
3.5.1.2 FROM MOUSE COCHLEAE
Inner ears were excised from the temporal bone of E15.5 mouse embryos. Otic capsule and surrounding tissue were trimmed, and an incision was made at the basal turn of cochleae to separate them from the vestibular region. Cochleae were frozen in liquid nitrogen and stored at -80ºC until use.
These cochleae were grouped in groups of four samples (coming from 2 embryos of identical genotype) when possible, and homogenized using Omni µH Homogenizer (Omni International, USA). Afterwards, RNA extraction was performed using RNeasy Micro kit (Qiagen) according to the manufacturer’s instructions.
3.5.2 cDNA synthesis and qRTPCR
RNA extracted either from frozen tissue or from cell culture was employed to obtain cDNA using High-Capacity cDNA Reverse Transcription Kit (Applied Biosystems). Each cDNA reaction contained the following substrates:
Reagent RNA
2 μl 10X RT Buffer
2 μl 10X RT Random Primers
0’8 μl 25X dNTP Mix (100 mM)
1 μl
MultiScribe® Reverse Transcriptase (50 U/µL)
FINAL REACTION VOLUME 5’8 μl mix 14’2 μl RNA
The cDNA reaction was carried out in a thermocycler under the following conditions: 10 min at 25°C to let primers anneal and extend, 2h at 37ºC to allow DNA polymerization to occur and 3 min at 85ºC to deactivate the enzyme.
cDNA samples were amplified using SYBR™ Green PCR Master Mix (Applied Biosystems). PCR conditions were 95ºC 5 min, 43 cycles of 95ºC 15s, 60ºC 15s, 72ºC 2min, melting curves analysis.
Relative mRNA expression was calculated according to 2-∆(∆Ct) method, using GAPDH as a housekeeping gene.
GENE FORWARD REVERSE CODE SOURCE
mGAPDH 5’ TCC TGC ACC
ACC AAC TGC TT 3’
5’ GTG GCA GTG ATG GCA TGG AC 3’
mGAPDHF mGAPDHR
FISCHER
Meis2 5’ TGT TTC CTC TGT TAG CTC TGG 3’
5‘ GAA GAC CGC GATGTC CTC G 3‘
hmMEIS2-F1 hmMEIS2-R1
EUROFINS GENOMICS
Chd7 5’ GAA TAC CCC
ACA GAA AGT GCC 3’
5’ TCG CTC TTC ACT AGC TGA GCG 3’ Chd7-F1 Chd7-R1 EUROFINS GENOMICS Table 4
3.6 S
TATISTICAL ANALYSIS4 RESULTS
4.1 Q
UANTIFICATION OFM
EIS2
ANDC
HD7
EXPRESSION IN TRANSFECTEDHEK
CELLSTo detect any possible induction of Chd7 expression caused by Meis2 at the cellular level, a simple transfection-mediated overexpression experiment was designed. Two different plasmids were used:
Meis-A, supplied by OriGene, untagged, sequence-validated.
Meis-190, 36.6 kB, provided by M. Torres at CNIC (Madrid).
Prior to the transfection experiment, a screening was performed on several cell lines available at the laboratory, namely: HeLa, HEK293, Hei, Ock3. In order to choose an adequate experimental model, basal expression levels of Meis2 and Chd7 were examined via qRT-PCR.
Although exceedingly variable, the data from qRT-PCRS pointed towards high basal levels of both Meis2 and Chd7 in the otic cell lines Hei and Ock3, and thus they were deemed inappropriate for an induction experiment. On the other hand, HeLa and HEK293 exhibited weaker levels of relative expression of Meis and Chd7, with mRNA readings being lower in HEK293; in some of the samples they were even below the detection threshold. This, together with the fact that HEK cells usually accommodate well to transfections, led to the choice of HEK293 as the experimental subject.
HeL a HE K29 3 Hei Ock 3 0 1 2 3
Meis2 relative expression
Cell lines 2 -( C t) HeL a
HEK
293 Hei
Ock 3 2 -( C t)
Graph 1: Bar graph representation of the fold-change in Meis2 and Chd7 expression in cell lines HEK293, Hei and Ock3 relative to HeLa, expressed as mean±SEM (Meis2 HeLa=1, HEK293=0.4278±0,Hei=1.872±2.109,Ock3=1.502±0.8413) (Chd7 HeLa=1,HEK=1.099±0.1794,
Hei=1996±977.2, Ock3=32.96±13.57)
Hence, transfection was performed on HEK 293 cell cultures using Meis A and Meis 190 overexpression plasmids, and relative Meis2 and Chd7expression levels were monitored after 48 hours via qRTPCR. After the first series of measurements, it was detected that Meis-190 apparently was not able to elicit overexpression of Meis (Graph 2: Meis2
relative expression), and thus was discarded. The second transfection experiment was
Graph 2: Bar graph representation of the fold-changes in Meis2 mRNA in HEK cells transfected with Meis-A and Meis-190 compared to control HEK cells, after two transfection experiments.
These data confirmed that the transfection-mediated overexpression of Meis2 had worked with Meis-A plasmid; however, when the values of Chd7 quantification were compared, no statistical difference was found between control cells and cells transfected with Meis-A (Supp. Table 3). On a paired, two-tailed t-test, p-value was of 0.5334.
HE K-C
trl
HE K-M
eisA
HE K-M
eis1 90
0.0 0.5 1.0 1.5 2.0
Chd7 relative expression
HEK-Ctrl
HEK-MeisA
HEK-Meis190
Graph 3: Bar graph representation of the fold-change in Chd7 mRNA HEK cells transfected with Meis-A and Meis-190 compared to control HEK cells, expressed as mean±SEM (Ctrl=1,
4.2 M
EIS2
ANDC
HD7
EXPRESSION CHANGES UPON CONDITIONAL-DELETION OF
M
EIS2
Meis2 and Chd7 expression was tested at mRNA and protein level via qRT-PCR and immunohistochemistry, respectively.
Crossings were designed to obtain mouse embryos carrying Cre recombinase in the Pax2 locus and floxed alleles of the Meis2 gene, therefore resulting in an otic-tissue-specific deletion of Meis2. Two litters of Pax2-Cre Meis were processed as described in the Material and Methods section, and genotyped in order to obtain mutant and wild-type inner ears at stage E15,5. Wild type and mutant (Cre+ Meis(flox/flox)) mice samples coming from each litter were combined with the aim of reducing variability between samples. qRT-PCR on cochleae from E15.5 mouse embryos were performed to assess whether this conditional deletion of Meis2 had any effect on the messenger levels of Chd7, and the results are represented in the following graph.
Graph 4: Scatter-box plot of the fold change in Meis2 and Chd7 mRNA of CPaxMeis E15.5 mutant cochleae compared to wild-type. Error bars represent ±SEM. (Meis2 WT=1 MUT=0.1321±0.1284)(Chd7
WT=1,MUT=0.4979±0.0565)
Attending to these data, the conditional knock-out of Meis2 was confirmed at mRNA level. Moreover, on a paired, two-tailed t-test comparing the means of Chd7 mRNA of wild type and mutant samples, the difference between them was found to be significant (p-value*=0.0125, N=3).
4.3 P
HENOTYPICAL ANALYSIS OF INNER EARS AFTER CONDITIONAL DELETION OFC
HD7
Inner ears carrying the equivalent conditional deletion of Chd7 (Pax2-Cre Chd7flox/flox) were obtained. These inner ears replicated the apex-turn phenotype observed in CPax Meis, as depicted in the photographies below.
WILD-TYPE MUTANT
CPax Chd7
MUTANT CPax Meis
Immunostaining with anti-myosine VI of vertical and horizontal sections of mutant and wild-type inner ears allowed the visualization of hair cells and their arrangement.
WILD-TYPE MUTANT
CPax Chd7
DAPI
ANTI-MYOVI
These immunofluorescence images are of particular interest. It can be observed that, whereas the vertical sectioning of wild type cochleae shows the sensory epithelium at several points (pointed with white arrows on Image set 1), as the duct advances and coils, the sectioning of the mutant disrupts the epithelium once as the duct descends straight.
Immunostaining with anti-myosine VI of hair cells allowed to discern the 3+1 pattern of outer and inner hair cells in wild type cochleae. Although apparently this pattern was conserved at the beginning of the mutant cochlear duct (Image set 2), the histology pointed to an accumulation of hair cells towards the apex (Data not shown: no representative pictures available).
WILD-TYPE MUTANT
CPax Chd7
OVERVIEW
CLOSE UP
4.4 E
FFECTS OF TISSUE-
SPECIFIC OVER-
EXPRESSION OFM
EIS2
IN THE INNER EARIn parallel, the same kind of experiments were carried out on transgenic mice carrying Pax2-Cre and an over-expression construct (Rp26Meis2a, in which Meis2 expression is activated upon Cre recombinase action, that eliminates the floxed STOP signal that precedes the Meis2a coding sequence).
The histological cuts showed no major phenotypical changes in CrePax Rp26Meis cochleae. Regarding Meis and Chd7 expression, immunofluorescence did confirm the overexpression of Meis2, particularly in the cochlear duct (Image set 3).
WILD TYPE MUTANT
CPax Rp26Meis DAPI
ANTI-MEIS
Image set 3
However, no evident changes in the signal derived from staining with the anti-Chd7 antibody were detected (Image set 4).
WILD TYPE MUTANT
CPax Rp26Meis ANTI-CHD7
Quantitative expression analysis by qRT-PCR was performed in an equivalent manner to that of the CPax Meis wild type and mutants. Although Meis2 was clearly being overexpressed, a similar tendency was not found on Chd7. In fact, an average fold change of 0.68 was detected. However, after performing a paired, two-tailed t-test to compare wild-type and mutant, this drop in the messenger levels of Chd7 was not found to be significant (p-value=0,1238).
Graph 5: Scatter-box plot of the fold change in Meis2 and Chd7 mRNA of CPaxMeis E15.5 mutant cochleae compared to wild-type. Error bars represent ±SEM (Meis2 WT=1, MUT=3.2704±1.723) (Chd7
WT=1, MUT=0.6887±0.0613)
In the following graph, the quantitative data available for Meis2 (X axis) and Chd7 (Y axis) have been collected in a logarithmic form in order to have negative values for the down-regulation and positive values for the up-regulation. With the samples available, a correlation analysis assuming Gaussian distribution and computing Pearson correlation coefficients was performed; unsurprisingly, no correlation was found (two-tailed p-value=0.1171) for these 5 X-Y pairs.
5 D
ISCUSSION AND
C
ONCLUSIONS
The overall results are consistent with the initial work hypothesis that Chd7 is a target gene of Meis 2.
qRT-PCR data from transfection experiments only confirmed the increased Meis2 mRNA expression after transfection with plasmid Meis-A; nonetheless, no inference can be made about a Chd7 mRNA increment, since values are too variable between samples. This apparent absence of response does not come as a surprise. Many factors could be causing this, including an inadequate choice of experimental model or conditions. For instance, in (Reboulet et al., 2018), the authors remark the tight cis-regulation of TALE-binding sites, its activity depending on the cell environment and topology of the DNA itself. They report finding an inhibitory role of the HX motif in HOXA7 in HEK and MCF7 cells, but this observation was not reproduced in HeLa cells.
Data coming from mouse tissues is far more interesting. The downregulation of Chd7
mRNA in a Meis2-deletion model was confirmed. However, this effect was not confirmed in the immunohistochemistry assays. Several reasons could be behind it, such as the sections being too heterogeneous to allow for proper comparison between mutant and wild type, the immunohistochemistry protocol not being discriminative enough or even this mRNA downregulation not being big enough to be detectable at protein level. As for the expected upregulation of Chd7 in the Meis2-overexpression model, nor qRT-PCR nor immunofluorescence gave convincing data. One reason for this failure may be the requirement of additional cofactors next to Meis2
What has been proven, though, is that an equivalent deletion of Chd7 reproduces the phenotype of the Pax2-Cre deletion of Meis2, mirroring Foxg1-Cre Meis and Foxg1-Cre Chd7.
Moreover, the histological sections hint to a disruption in the patterning of the organ of Corti towards the apex. A similar phenotype has been studied by the laboratory before (Dominguez-Frutos et al., 2011), although as a result of inactivation of a different gene. Among the reasons that are speculated in the discussion to be behind this truncated cochlea development are a failure of the convergent extension mechanism required for normal patterning of the organ of Corti, or the smaller size of the otic vesicle causing a lack of sufficient prosensory progenitors.
As it has been mentioned in the Introduction section, inactivation of Chd7 and Meis not only affects the late stages of cochlear development, but it also results in smaller vesicles.
Taken altogether, these phonotypical resemblances point to Chd7 and Meis2 having an equivalent role during inner ear morphogenesis. Nevertheless, whether Meis2 directly regulates Chd7 or they belong to parallel signaling vias remains to be proven.
6 BIBLIOGRAPHY
Agoston, Z. et al. (2014) ‘Meis2 is a Pax6 co-factor in neurogenesis and dopaminergic periglomerular fate specification in the adult olfactory bulb’, pp. 28–38. doi: 10.1242/dev.097295.
Agoston, Z. and Schulte, D. (2009) ‘Meis2 competes with the Groucho co-repressor Tle4 for binding to Otx2 and specifies tectal fate without induction of a secondary midbrain-hindbrain boundary organizer’, Development, 136(19), pp. 3311–3322. doi: 10.1242/dev.037770.
Alsina, B., Giraldez, F. and Pujades, C. (2009) ‘Patterning and cell fate in ear development’, 1513(January), pp. 1503–1513. doi: 10.1387/ijdb.072422ba.
Azcoitia, V. et al. (2005) ‘The homeodomain protein Meis1 is essential for definitive hematopoiesis and vascular patterning in the mouse embryo’, Developmental Biology, 280(2), pp. 307–320. doi: 10.1016/j.ydbio.2005.01.004.
Basch, M. L. et al. (2016) ‘Where hearing starts: The development of the mammalian cochlea’, Journal of Anatomy, 228(2), pp. 233–254. doi: 10.1111/joa.12314.
Bouazoune, K. and Kingston, R. E. (2012) ‘Chromatin remodeling by the CHD7 protein is impaired by mutations that cause human developmental disorders’, Proceedings of the National Academy of Sciences, 109(47), pp. 19238–19243. doi: 10.1073/pnas.1213825109.
Chang, I. and Parrilla, M. (2016) ‘Gene Expression Patterns Expression patterns of homeobox genes in the mouse vomeronasal organ at postnatal stages’, Gene Expression Patterns. Elsevier B.V, 21(2), pp. 69–80. doi: 10.1016/j.gep.2016.08.001.
Dominguez-Frutos, E. et al. (2011) ‘N-myc Controls Proliferation, Morphogenesis, and Patterning of the Inner Ear’, Journal of Neuroscience, 31(19), pp. 7178–7189. doi: 10.1523/JNEUROSCI.0785-11.2011.
Donnay, I. (2012) ‘Characterization of TALE Genes Expression During the First Lineage Segregation in Mammalian Embryos’, (October), pp. 1827–1839. doi: 10.1002/dvdy.23873.
Erickson, T., French, C. R. and Waskiewicz, A. J. (2010) ‘Meis1 specifies positional information in the retina and tectum to organize the zebrafish visual system’, Neural Development. doi: 10.1186/1749-8104-5-22.
Gey, G. O., Coffmann, W. D. and Kubicek, M. T. (1952) ‘Tissue culture studies of the proliferative capacity of cervical carcinoma and normal epithelium.’, Cancer Research. doi: 10.1038/212665a0.
Graham, F. L. et al. (1977) ‘Characteristics of a human cell line transformed by DNA from human adenovirus type 5.’, The Journal of general virology. doi: 10.1099/0022-1317-36-1-59.
Grebbin, B. M. et al. (2016) ‘STEM CELLS AND REGENERATION Pbx1 is required for adult subventricular zone neurogenesis’, pp. 2281–2291. doi: 10.1242/dev.128033. Hayashi, S. et al. (2002) ‘Efficient gene modulation in mouse epiblast using a Sox2Cre transgenic mouse strain’, Gene Expression Patterns, 2(1–2), pp. 93–97. doi: 10.1016/S0925-4773(02)00292-7.
Hisa, T. et al. (2004) ‘Hematopoietic, angiogenic and eye defects in <em>Meis1</em> mutant animals’, The EMBO Journal, 23(2), p. 450 LP-459. Available at: http://emboj.embopress.org/content/23/2/450.abstract.
Iizuka-Kogo, A. (2018) ‘Spatiotemporal coordination of cellular differentiation and tissue morphogenesis in organ of Corti development’, Medical Molecular Morphology. Springer Japan, 0(0), pp. 1–17. doi: 10.1007/s00795-018-0185-z.
Irimia, M. et al. (2011) ‘Distinct and Redundant Expression and Transcriptional Diversity of MEIS Gene Paralogs During Chicken Development’, (April), pp. 1475–1492. doi: 10.1002/dvdy.22621.
Kalinec, F. et al. (1999) ‘Establishment and characterization of conditionally immortalized organ of Corti cell lines’, Cell Biology International. doi: 10.1006/cbir.1998.0339.
Kalinec, G. M. et al. (2003) ‘A cochlear cell line as an in vitro system for drug ototoxicity screening’, Audiology and Neuro-Otology. doi: 10.1159/000071059.
Kelley, M. W. (2006) ‘Regulation of cell fate in the’, 7(November). doi: 10.1038/nrn1987. Ladher, R. K. (2017) ‘Changing shape and shaping change: Inducing the inner ear’, Seminars in Cell and Developmental Biology. Elsevier Ltd, 65, pp. 39–46. doi: 10.1016/j.semcdb.2016.10.006.
Lewis, J. and Davies, A. (2002) ‘Planar cell polarity in the inner ear: How do hair cells acquire their oriented structure?’, Journal of Neurobiology. doi: 10.1002/neu.10124. Longobardi, E. et al. (2014) ‘Biochemistry of the tale transcription factors PREP, MEIS, and PBX in vertebrates’, Developmental Dynamics, 243(1), pp. 59–75. doi: 10.1002/dvdy.24016.
Marcos, S. et al. (2015) ‘Meis1 coordinates a network of genes implicated in eye development and microphthalmia’, Development, 142(17), pp. 3009–3020. doi: 10.1242/dev.122176.
Mukherjee, K. and Bürglin, T. R. (2007) ‘Comprehensive analysis of animal TALE homeobox genes: New conserved motifs and cases of accelerated evolution’, Journal of Molecular Evolution, 65(2), pp. 137–153. doi: 10.1007/s00239-006-0023-0.
Ohyama, T. and Groves, A. K. (2004) ‘Generation of Pax2-Cre Mice by Modification of a Pax2 Bacterial Artificial Chromosome’, Genesis, 38(4), pp. 195–199. doi: 10.1002/gene.20017.
Penkov, D. et al. (2013) ‘Analysis of the DNA-Binding Profile and Function of TALE Homeoproteins Reveals Their Specialization and Specific Interactions with Hox Genes/Proteins’, Cell Reports, 3(4), pp. 1321–1333. doi: 10.1016/j.celrep.2013.03.029. Raft, S. and Groves, A. K. (2015) ‘Segregating neural and mechanosensory fates in the developing ear: patterning, signaling, and transcriptional control’, Cell and Tissue Research. doi: 10.1007/s00441-014-1917-6.
Reboulet, J. et al. (2018) ‘Human HOX Proteins Use Diverse and Context- Dependent Motifs to Interact with TALE Class Human HOX Proteins Use Diverse and Context-Dependent Motifs to Interact with TALE Class Cofactors’, pp. 3058–3071. doi: 10.1016/j.celrep.2018.02.070.
Robertson, E. J. (1999) ‘Generalizes lacZ expression with the ROSA26 cre reporter strain’, 21(january), pp. 70–71.
10.1242/dev.106831.
Sánchez-Guardado, L. Ó. et al. (2011) ‘Meis gene expression patterns in the developing chicken inner ear’, Journal of Comparative Neurology. doi: 10.1002/cne.22508.
Schimmang, T. (2013) ‘Transcription factors that control inner ear development and their potential for transdifferentiation and reprogramming’, Hearing Research. Elsevier B.V., 297, pp. 84–90. doi: 10.1016/j.heares.2012.11.001.
Schimmang, T. and Maconochie, M. (2016) ‘Gene expression profiling of the inner ear’, Journal of Anatomy, 228(2), pp. 255–269. doi: 10.1111/joa.12376.
Schimmang, T. and Pirvola, U. (2013) ‘Coupling the cell cycle to development and regeneration of the inner ear’, Seminars in Cell and Developmental Biology. Elsevier Ltd, 24(5), pp. 507–513. doi: 10.1016/j.semcdb.2013.04.004.
Schulte, D. (2014) ‘Meis: New friends of Pax’, Neurogenesis, 1(1), p. e976014. doi: 10.4161/23262133.2014.976014.
Tada, M. and Heisenberg, C.-P. (2012) ‘Convergent extension: using collective cell migration and cell intercalation to shape embryos’, Development. doi: 10.1242/dev.073007.
Villate, O. et al. (2018) ‘Functional analyses of a novel splice variant in the CHD7 gene, found by next generation sequencing, confirm its pathogenicity in a Spanish patient and diagnose him with CHARGE syndrome’, Frontiers in Genetics, 9(JAN), pp. 26–31. doi: 10.3389/fgene.2018.00007.
7 S
UPPLEMENTARY
M
ATERIAL
7.1 STATISTICAL
ANALYSIS
Statistical analysis of
2-∆∆Ct of Meis2 HeLa HEK293 Hei Ock3
Number of values 3 1 3 3
Minimum 1 0,4278 0,523 0,6807
25% Percentile 1 0,4278 0,523 0,6807
Median 1 0,4278 0,79 1,464
75% Percentile 1 0,4278 4,302 2,362
Maximum 1 0,4278 4,302 2,362
Mean 1 0,4278 1,872 1,502
Std. Deviation (quantification of variality or
scatter) 0 0 2,109 0,8413
Std. Error of Mean (quantification of how
precisely the mean is known) 0 0 1,218 0,4857
Lower 95% CI of mean 1 -3,367 -0,5877
Upper 95% CI of mean 1 7,111 3,592
Sum 3 0,4278 5,615 4,507
D'Agostino & Pearson normality test
K2 N too small N too small N too small N too small One sample t test (comparison of means
against hypothetical value = 1)
Sample difference has zero SD
Too few points
Theoretical mean 1 1
Actual mean 1,872 1,502
Discrepancy 0,8717 0,5022
95% CI of discrepancy -4,367 to
6,111
-1,588 to 2,592
t, df t=0,7159
df=2 t=1,034 df=2
P value (two tailed) 0,5483 0,4098
Significant (alpha=0.05)? No No
Statistical analysis of 2-∆∆Ct of Chd7 HeLa HEK293 Hei Ock3
Number of values 4 2 4 3
Minimum 1 0,9202 29,96 10,13
25% Percentile 1 0,9202 206 10,13
Median 1 1,1 1856 31,67
75% Percentile 1 1,279 3925 57,08
Maximum 1 1,279 4240 57,08
Mean 1 1,1 1996 32,96
Std. Deviation 0 0,2537 1954 23,51
Std. Error of Mean 0 0,1794 977,2 13,57
Lower 95% CI of mean 1 -1,18 -1114 -25,43
Upper 95% CI of mean 1 3,379 5105 91,35
Sum 4 2,199 7982 98,88
D'Agostino & Pearson normality test
K2 N too small N too small N too small N too small
One sample t test
Sample difference has
zero SD
Theoretical mean 1 1 1
Actual mean 1,1 1996 32,96
Discrepancy 0,09959 1995 31,96
95% CI of discrepancy -2,18 to 2,379 -1115 to 5104 -26,43 to 90,35
t, df t=0,5551 df=1 t=2,041 df=3 t=2,355 df=2
P value (two tailed) 0,6774 0,1339 0,1427
Table Analyzed 2^ddCt CHD7
Transfections
Column B HEK-MeisA
vs. vs,
Column A HEK-Ctrl Paired t test
P value 0,5334
P value summary ns Significantly different (P < 0.05)? No One- or two-tailed P value? Two-tailed t, df t=0,746 df=2 Number of pairs 3 How big is the difference?
Mean of differences 0,2101 SD of differences 0,4879 SEM of differences 0,2817 95% confidence interval -1,002 to 1,422 R squared (partial eta squared) 0,2177 How effective was the pairing?
Correlation coefficient (r) Horizontal line
Table Analyzed CPaxMeis E15.5 (CHD7 mRNA)
Column B MUT
vs. vs,
Column A WT
Paired t test
P value 0,0125
P value summary *
Significantly different (P < 0.05)? Yes
One- or two-tailed P value? Two-tailed
t, df t=8,873 df=2
Number of pairs 3
How big is the difference?
Mean of differences -0,502 SD of differences 0,098 SEM of differences 0,05658 95% confidence interval -0,7455 to -0,2586 R squared (partial eta squared) 0,9752 How effective was the pairing?
Correlation coefficient (r) Horizontal line Table Analyzed CPaxRp26Meis (CHD7 mRNA)
Column B MUT
vs. vs,
Column A WT
Paired t test
P value 0,1238
P value summary ns
Significantly different (P < 0.05)? No One- or two-tailed P value? Two-tailed
t, df t=5,078 df=1
Number of pairs 2
How big is the difference?
Mean of differences -0,3113 SD of differences 0,08669 SEM of differences 0,0613 95% confidence interval -1,09 to 0,4676 R squared (partial eta squared) 0,9627 How effective was the pairing?
Correlation analysis LOG10(CHD7) VS LOG10(MEIS2)
Pearson r
r 0,7833
95% confidence interval -0,3205 to 0,9849
R squared 0,6135
P value
P (two-tailed) 0,1171
P value summary ns
Significant? (alpha = 0.05) No
7.2 GENOTYPING
7.2.1 CPax Meis
CROSS M F
ID G13-3 G?-30 GENOTYPE CPax (+/-)
Meis (F/+) Meis(F/F) PLUG DETECTED 07/08/2018 EMBRYO EXTRACTION 22/08/2018
LITTER RECOMBINASE TRANSGENE
EMBRYO Cpax Meis
1 +
2 flox/flox
3 + flox/flox
4 +
5
6 +
7 flox/flox
CROSS M F
ID G13-3 G9-2
GENOTYPE CPax (+/-)
Meis (F/+) Meis(F/F) BIRTH DATE - 28/5/18
PLUG DETECTED 08/08/18 (night plug) EMBRYO EXTRACTION 23/08/18
LITTER RECOMBINASE TRANSGENE
23/8/18 Cpax Meis
1 flox/+
2 flox/+
3 flox/flox
4 + flox/+
5 flox/flox
6 + flox/flox
7 + flox/flox
7.3 CP
AXR
P26M
EISCROSS M F
ID G1-3 G2-7
GENOTYPE Rp26 Cpax(+/-) PLUG DETECTED 09/08/18 (night plug) EMBRYO EXTRACTION 23/08/2018
LITTER RECOMBINASE TRANSGENE
EMBRYO Cpax Rp26Meis
1 +
2 +
3 +
4
5
6
7 + +
8
9 +
PCR Cre WT 280 MUT 390