Communications Market
Report
Research Document
Foreword
This is the fourth of Ofcom’s annual reports to focus on trends and developments in the UK’s communications market, with the aim of providing a context for decision-making by Ofcom, as well as by commercial and public sector organisations.
The communications sector plays a vital role in the UK’s economy and in the life of its
citizens. We estimate that revenue of over £50bn was generated in 2006 by a combination of broadcasting and telecoms networks and services. And figures from the Office of National Statistics suggest that in terms of Gross Value Added, telecoms, broadcasting and the content-related components of the creative industries contribute over three times as much as the UK’s electricity, gas and water supply industries combined.
But given the amount of time we spend using communications services this is perhaps not surprising. We estimate that, on average, each person now spends more than seven hours cumulatively every day watching, listening, making phone calls and web-browsing. This reflects both the growing importance of communications services in our work and leisure lives and a growing desire, particularly among the young, to use multiple services
simultaneously.
Driving this growing role in our lives is the widening availability of increasingly sophisticated telecoms services and a greater number of audiovisual services accessible via the internet. Yet despite this, real household monthly spend on communications services fell for the second year running in 2006, down 1.5% to £92.65, driven by falling fixed and mobile call prices amid growing competition in the telecoms sector.
Much of the growth in the sector stems from the arrival of ‘converged’ equipment, capable of receiving services from more than one operator and over multiple platforms. Many operators now also offer communications ‘bundles’ comprising a variety of different services. To reflect this, we have changed the structure of this year’s report by introducing a section on
convergence at the start of the document. This adopts an approach which follows the
progress of services and content from their creation and packaging, through distribution over fixed and wireless networks, and into navigation and then use by consumers.
We have also commissioned new research which looks at the impact on traditional media of two key digital technologies: the mobile phone and the digital video recorder (DVR). In both cases we observe signs of a challenge to traditional industry economics, with up to 78% of DVR owners claiming that they regularly fast forward through advertisements while watching recorded programmes, and growing substitution of the new generation of high specification mobile handsets for devices such as cameras, portable music players and games consoles.
Last year we reported on the particular threat to traditional media posed by the changing consumption habits of 16-24 year-olds. This year we explore the results of the first wave of a continuous research project commissioned by Ofcom into the use of communications by UK children. This research finds, for example, that more than 75% of 11 year olds claim that they own each of: TV sets, games consoles and mobile phones.
This publication forms the second of Ofcom’s three major 2007 Communications Markets Reports (CMRs). The Nations and Regions CMR, published in May, looked at issues affecting the rural and urban populations in different parts of the UK, and the International CMR, to be published around Christmas, aims to place the UK in a wider perspective, reflecting the globalisation of the sector and the growing importance of the European Union on regulatory issues.
We hope that this report will contribute to a greater understanding of the changing ways in which communications services are delivered and consumed in the UK. As such, it is
intended to support Ofcom’s regulatory goal to research markets constantly and to remain at the forefront of technological understanding. It also fulfils the requirements of section 358 of the Communications Act to publish an annual statistical review.
We welcome feedback on all Communications Market Reports and would be particularly interested to hear views on the Convergence section of this document. Please email Ofcom’s Market Intelligence team on [email protected]
Contents
Section
Page
Foreword 2
1 Converging communications markets
11
2 Television
99
3 Radio
187
4 Telecommunications
253
Glossary 320
Key points: converging communications
markets
• The availability of broadband to more than half of UK households has driven the development of converged services and devices.
• Convergence has opened up major revenue opportunities for the producers of many content types. Over the first half of 2007 90% of UK singles sales by volume came from digital downloads to the computer or a mobile handset. The market for computer game playing has also been transformed, with millions of consumers worldwide now engaging in shared online gaming experiences.
• Audiovisual content, by contrast, continues to be largely broadcaster-funded,
although independent producer revenue from new media rights more than doubled to £42m in 2006.
• The traditional advertiser-funded model of broadcast audiovisual output faces
pressures both from the growing popularity of online advertising (it rose by nearly half in 2006 to £2bn) and from the multichannels (which attracted advertising revenue of over £1bn in 2006).
• The terrestrial broadcasters have in turn embraced the internet as a new distribution platform with Channel 4, ITV and the BBC all launching internet-based on-demand and/or live access to their content.
• Increasingly sophisticated devices are beginning to influence consumer behaviour. Fifteen percent of individuals now have a digital video recorder (DVR) and up to 78% of adults who own them say they always, or almost always, fast-forward through the adverts when watching recorded programmes.
• Access to communications devices is widespread among children, with more than three quarters of 11 year olds claiming ownership of a TV set, a games console and a mobile phone.
• Bundled communications services are increasingly popular with consumers, with 40% of households now taking more than one communications service from the same provider (up a third on last year). A majority of broadband customers take it as part of a bundle.
• Each person now consumes more than seven hours of media and communications services cumulatively per day. However, the tendency to consume some media simultaneously means that the actual time spent on media is likely to be less than this.
Key points: television
• Total television industry revenue stood at nearly £10.8bn in 2006, up 1.4% on 2005. The gap between subscription and advertising revenue widened further during the year; subscriptions rose by 3.5% to over £4bn while advertising fell by 2.2% to £3.5bn.
• The industry as a whole broadcast 1.8 million hours of output in 2006. Together, hours of output from channels in the genres of Entertainment, Factual, News, Leisure, Children’s, Sport and Ethnic output grew to just over one million – 15% of these were first-run originated content.
• In-house production fell 8.7% over the year to £1,430m, while spend on independent production and acquisitions grew 6.8% to £3,077m. All of the public service
broadcasters exceeded their independent programme quota of 25% by at least five percentage points.
• Hours of first-run originated regional output have fallen by 20% since 2001 to total 11,919 in 2006; spend has fallen by 9.2% to £324m over the same period.
• Digital television penetration broke through the 80% barrier in Q1 2007, taking the total number of homes with multichannel television to 20.4 million (80.5% of the total).
• There are now more Freeview devices connected to the main television set in the home than pay satellite set top boxes. By Q1 2007, 8.4 million homes had Freeview, up 33.3% on the year, while 8.0 million households took pay satellite, up 8.3%.
• When all television sets in the UK are taken into account, 49% have yet to be converted to digital.
• Ofcom awarded 109 licences to broadcast in the UK in 2006; 29% of these were for Entertainment channels, 28% for Ethnic genre channels and 17% for Factual. The number of ethnic channel licences awarded grew by 20% over the year.
• The five main networks have been losing audience share but have been able to offset this to some extent by the strong performance of their spin-off channels; Film4, More4, E4, ITV3 and ITV4 were among the top ten gainers in share in the year to December 2006.
• The combined audience share of the five terrestrial channels is greater on Freeview (68%) than on cable and satellite platforms (49%). However, the downward trend is more pronounced on Freeview (which lost six percentage points in the year to March 2007).
Key points: radio
• Total funding for the UK’s radio industry stood at £1.15bn in 2006, down 0.6% on 2005. We estimate that BBC radio expenditure reached £637m or 55% of the total. National commercial radio earned around £270m from net advertising revenue (23%), while local commercial radio added a further £153m (13%). Commercial sponsorship made up the final £91m (7.9%).
• Radio reach has been stable over the last five years at around 90%. However, total listening hours fell by 1.4% in the year to Q1 2007, and are down 4.0% on five years ago. Listening hours have fallen furthest among 25-34 year olds, down by 17.3% over five years, and among children, down 8.7%. However, the over-55’s are now listening to more radio, with hours up by 5.5%.
• The fall in hours has mainly affected local radio, with BBC local radio listening down by 6.7% over the year and local commercial radio down by 4.1%. By contrast,
national stations have increased their listening hours, with national commercial radio, in particular, increasing share across all age groups, up by 1% over the year. BBC network stations also gained hours, up by 0.5%.
• The BBC’s share of radio listening rose to 56% in Q1 2007, up three percentage points since 2002, while the share of commercial radio fell to 42%, down by four percentage points. BBC network stations’ share at 45.4% was higher than all commercial radio. However, national commercial share (10.7%) overtook BBC local and nations’ listening (10.6%) for the first time.
• Three main groups accounted for 67% of all commercial radio listening by Q1 2007. GCap Media had a 31% share (34% in Q1 2006), Emap 24% (up by 1%) and Chrysalis (now Global Radio) 12%, (up by 0.4%).
• DAB digital radio will develop further in 2008, with the launch of the second national commercial DAB multiplex. The new national licence was awarded to the 4Digital Group Limited in July 2007 and the new network will carry ten national digital radio services as well as text and data services.
• Ofcom is licensing further local DAB multiplexes during 2007, with seven advertised and two awarded by July. A further three multiplex licences are scheduled to be advertised later in the year.
• Cumulative DAB digital radio set sales passed 5 million during Q1 2007 with 1.8 million sales in the previous 12 months. RAJAR estimates that 19.5% of UK adults now own a DAB set, up eight percentage points on last year. There are currently over 300 DAB radio set models on the market, with the average price for a portable set now around £70.
• Some 58% of listeners say they have accessed radio through one of thedigital platforms (up seven percentage points on last year); 41% have listened via DTV, 24% over the internet, and 8% via mobile phone. Twenty seven per cent of UK adults now own an MP3 player, with 5% using them to listen to radio podcasts.
Key points: telecoms
• Average household spend on telecoms services fell by nearly a pound in 2006 to £64.73 per month. For the first time, average mobile spend fell (by 70p to £31.72) as falling prices more than compensated for an increase in the total number of
connections and in the average number of voice calls and text messages per
subscriber. Like-for-like prices (based on a basket of services with average usage at 2006 levels) fell by nearly 9%.
• Total industry revenue in 2006 was £47.0bn, of which £38.5bn was retail revenue (i.e. revenue from end-users). This was an increase of 1.4% on 2005 but represents significantly slower growth than the previous five years as fixed-line revenues declined and growth in mobile and broadband revenues slowed.
• More than half of UK households had broadband by March 2007. The average (blended) headline speed in June 2007 was 4.6Mbit/s, although actual speeds experienced are often considerably lower, varying according to the quality and length of line from premises to exchange and the number of simultaneous users.
• Households with a mobile connection (93%) exceeded households with a fixed connection (90%) for the first time in 2006. Average calls per mobile connection rose above 100 minutes a month for the first time, while average calls per fixed-line connection fell below 300 minutes.
• At the end of 2006 there were nearly 70 million active mobile phone subscriptions in the UK, with further growth being driven by multiple handset or SIM ownership. Of these, 35% were contract connections (1% higher than a year previously).
• 3G moved into the mainstream in 2006 with connections growing by 70% to reach 7.8 million. The combined total of 3G customers on O2, Orange, T-Mobile and Vodafone networks is now higher than those on 3G-only operator 3UK.
• Local loop unbundling accelerated through 2006 so that by the end of March 2007, 72% of UK premises were connected to an unbundled exchange (an increase from 45% in March 2006). The proportion of premises in unbundled areas taking LLU services rose from 3% in March 2006 to 9% in March 2007.
• BT’s share of fixed voice volumes fell below 50% in 2006, for the first time. Indirect operators (those offering services over another provider’s infrastructure) were the main beneficiaries as their share of fixed-line voice calls rose from 25% in 2005 to 28% in 2006.
• Analysis of time spent online reveals that Britain is a nation of shoppers and social networkers. More time was spent on eBay than on any other web site, and social networking sites Bebo, MySpace, Facebook and YouTube are all in the top ten sites by time spent.
The Communications Market 2007
1
1 Converging
communications
Contents
1.1 Introduction
13
1.2 Key market data
15
1.3 Overview of market convergence
19
1.3.1 Defining convergence 19
1.3.2 The evolution of convergence 19
1.3.3 Service bundling 21
1.3.4 Approach to the rest of this section 24
1.4 Content and voice
27
1.4.1 Professionally produced content 27
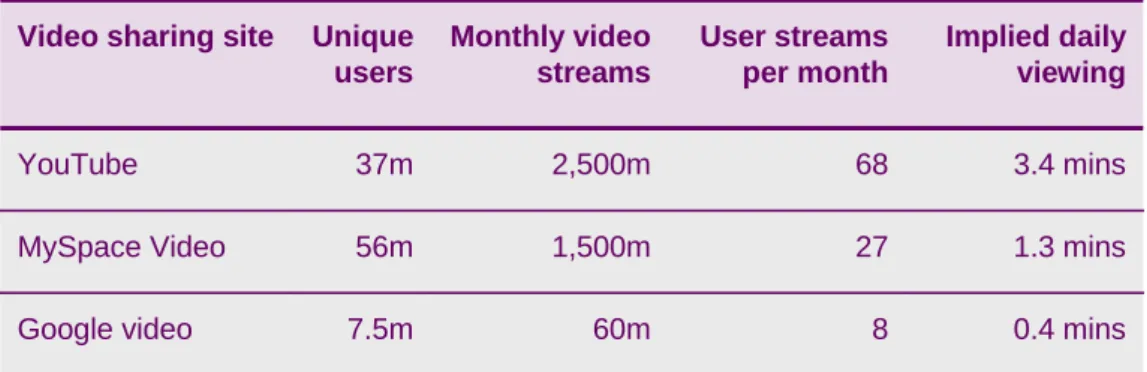
1.4.2 User-generated content 36
1.5 Aggregation
43
1.5.1 Audiovisual output 43
1.5.2 Audio 46
1.5.3 Aggregating user-generated content 47
1.6 Distribution
49
1.6.1 Digital distribution platforms in the UK 49
1.6.2 The characteristics of spectrum 53
1.6.3 The growing capabilities of digital distribution platforms 56
1.6.4 Future developments 60
1.7 Devices
65
1.7.1 Overall device take-up 65
1.7.2 TV sets 66
1.7.3 DAB radio sets 67
1.7.4 Mobile handset functionality 67
1.7.5 Digital video recorders 69
1.8 Navigation
73
1.8.1 The role of the electronic programme guide in navigation 74
1.8.2 Navigation online 76
1.9 Consumption
79
1.9.1 Cross-media consumption 79
1.9.2 Use of the internet 80
1.9.3 Use of mobile phone features 82
1.9.4 Use of digital video recorders 84
1.9.5 Adults’ attitudes towards other digital communications services 89 1.9.6 Children’s consumption of digital communications 91
1.1 Introduction
In recognition of the changing shape of the communications sector, we have altered the structure of this year’s Communications Market Report. More and more operators are providing services which cross the traditional boundaries of communications; for example telecommunications operators are offering content over their infrastructure, and
broadcasters are using the internet and mobile platforms for distribution. And consumption habits are changing too. We believe that this calls for a new approach on how Ofcom reports market developments.
This chapter begins with key industry measures of availability, take-up, spend, revenue and consumption time, for the telecoms, TV and radio sectors. We then move away from an industry-by-industry analysis to provide an overview of converging markets. The heart of this chapter follows the progress of services and content: from their creation and packaging; through distribution over fixed and wireless networks; into navigation; and then use by consumers. Readers can then find detailed industry analysis for telecommunications, television and radio in the three chapters which follow this one.
Data in this report cover the 2006 calendar year, with additional Q1 2007 data where available. We show trends using a five year historical time series where possible and use nominal figures unless stated. Comments and responses to this report, and the converged approach we have adopted in particular, would be very welcome at
1.2 Key market data
In 2006 consumers embraced digital communications devices and services in increasing numbers, while operators began to harness new business opportunities made possible through converging technologies. The availability of many platforms continued to widen and particular progress was made with:
• Local loop unbundling, where the number of premises with access to an unbundled exchange rose more than a half to 72%;
• 3G mobile, where the proportion of the population living in a postal district where at least one operator reported at least 50% area coverage rose from 84.3% to 91.4%;
• Broadband speeds, where blended headline speeds increased from 1.6Mbit/s at the end of 2005 to 4.6Mbit/s in June 2007; and
• IPTV, where Tiscali TV rolled out its service beyond London and Stevenage in 2007 to Birmingham, Newcastle and Edinburgh, and we now estimate the service to be available to 15% of homes.
Figure 1.1 Digital communications service availability, 2005 and 2006
UK-wide n/a 82% n/a 37% n/a 39.8% n/a 74.1% 99.8% 100% Wales 2.0 0.0 0.0 0.0 5.0 28.0 0.0 6.9 n/a 0.0 Change 86% 73% 98% 45% 10% 45% 99.6% 84.3% n/a 100.0% 2005 88% 73% 98% 45% 15% 72% 99.6% 91.4% 99.8% 100.0% 2006 n/a n/a n/a Digital satellite 30% 23% 48%
Digital cable6
31.3% 50.4% 77.2% LLU4 n/a n/a n/a DSL3 59.5% 75.3% 95.2%
3G mobile2
n/a n/a n/a IPTV5 58% 57% 73%
Digital Terrestrial TV7
99.6% 98.0%
100%
2G mobile1
n/a n/a
n/a
DAB digital radio8
100% Scotland 100% England Fixed line Platform 100% N Ireland UK-wide n/a 82% n/a 37% n/a 39.8% n/a 74.1% 99.8% 100% Wales 2.0 0.0 0.0 0.0 5.0 28.0 0.0 6.9 n/a 0.0 Change 86% 73% 98% 45% 10% 45% 99.6% 84.3% n/a 100.0% 2005 88% 73% 98% 45% 15% 72% 99.6% 91.4% 99.8% 100.0% 2006 n/a n/a n/a Digital satellite 30% 23% 48%
Digital cable6
31.3% 50.4% 77.2% LLU4 n/a n/a n/a DSL3 59.5% 75.3% 95.2%
3G mobile2
n/a n/a n/a IPTV5 58% 57% 73%
Digital Terrestrial TV7
99.6% 98.0%
100%
2G mobile1
n/a n/a
n/a
DAB digital radio8
100% Scotland 100% England Fixed line Platform 100% N Ireland Notes
1. Percentage of population living in postal districts where at least one operator reports at least 95% 2G area coverage. Sourced from GSM Association / Europa Technologies.
2. Percentage of population living in postal districts where at least one operator reports at least 50% 3G area coverage. Sourced from GSM Association / Europa Technologies.
3. Percentage of premises able to receive DSL services based on data reported by BT. 4. Percentage of premises connected to an LLU-enabled exchange.
5. IPTV availability figure calculated on the assumption that Tiscali TV is now available in London, Stevenage, Birmingham, Newcastle and Edinburgh.
6. Digital cable availability only. Analogue cable is still available in a small number of additional areas. 7. Availability of services from all six digital multiplexes.
8. DAB digital radio coverage figure based on a Digital One estimate. Both the BBC and Digital one have built new transmission masts during 2006/07.
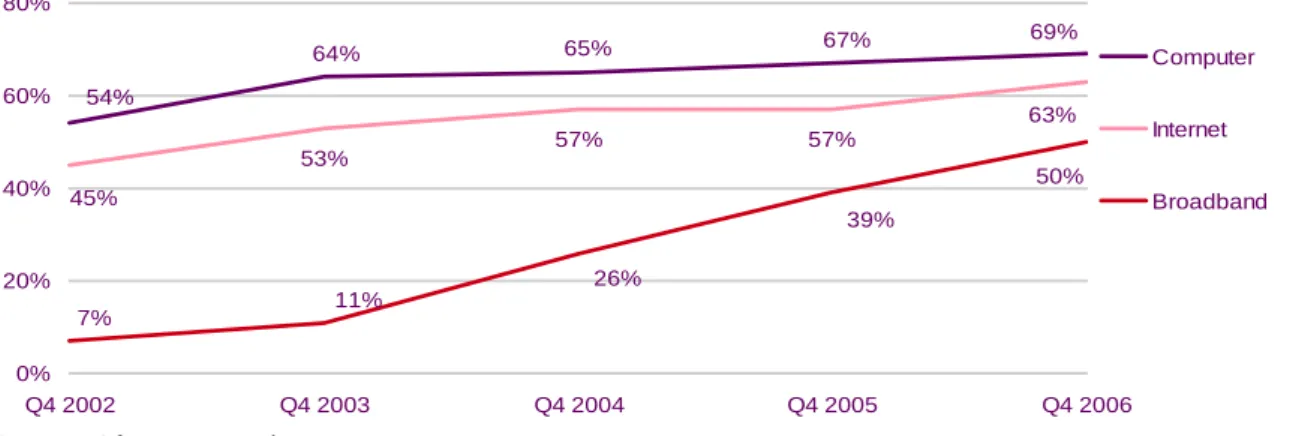
Improved coverage was a factor driving increased consumer take-up of digital devices and services in 2006. Fifty-two percent of homes had taken broadband services by the end of the first quarter of 2007; digital television penetration rose seven percentage points to 80.5% by the end of the same period; 15% of homes now have a digital video recorder (DVR); and 11.2% of mobile subscribers connect through a 3G mobile network.
Figure 1.2 Digital communications technologies take-up , 2005 and 2006
Proportion of individuals (%)
Innovators Early
Adopters
Early Majority
Late Majority
Late Adopters MP3 player = 40%
100%
0% 50%
75%
20%
Fixed line = 90.0% Digital TV = 80.5%
Broadband = 52%
DVR = 15%
2006 2005
DAB = 19% 3G = 11%
LLU = 9%
Innovators Early
Adopters
Early Majority
Late Majority
Late Adopters MP3 player = 40%
100%
0% 50%
75%
20%
Fixed line = 90.0% Digital TV = 80.5%
Broadband = 52%
DVR = 15%
2006 2005
DAB = 19% 3G = 11%
LLU = 9%
Source: Ofcom research and operator data
Notes: All figures relate to the end of Q1 2007 except for 3G which is end of 2006. All figures are measured as a proportion of individuals except for 3G, which represents the proportion of mobile subscribers, LLU which represents the proportion of premises in unbundled areas and DTV, which represents the proportion of homes with a digital television reception device on the main set.
Figure 1.3 Household spend on communications services, 2006
£ per month, 2006 prices
£29.85 £27.95 £26.16 £23.91 £22.81
£24.37 £28.31 £31.36 £32.42 £31.72
£6.47 £7.90 £9.15 £9.38 £10.20
£23.24 £24.39
£25.03 £25.77 £25.42
£86.55 £91.13
£94.24 £94.03 £92.65
£0 £20 £40 £60 £80 £100
2002 2003 2004 2005 2006
Radio
TV
Internet and broadband
Mobile voice and text
Fixed voice
Source: Operators and Ofcom estimates
Despite an expanding range of media available to many consumers, the amount of time spent watching television and listening to radio each day continued to exceed comfortably the number of minutes spent making landline or mobile phone calls. However, for the last four years there have been signs that use of the internet may be starting to substitute to some extent for broadcast media; since 2003 TV viewing hours per head have fallen by 3.6% while radio listening declined 2.0%. Mobile has made some inroads into the fixed sector over the period, increasing by 58% between 2002 and 2006 to 3.7 minutes per day per person, while fixed line minutes fell by 8% over the same period to 6.9 minutes per day per person. The increasing tendency of consumers to perform ‘media stacking’, whereby more than one medium is consumed at the same time, should be taken into account when comparing these figures – while the total media consumption time per day in 2006 amounted to 433 minutes per person the total time spent on media is likely to be less as some of these minutes ‘double up’.
Figure 1.4 Time spent using communications services
Minutes per day per person
216
173 170
14
36
7.5 2.4 6.9 3.7
224*
0 50 100 150 200 250 300
2002 2006
TV
Radio
Internet
Fixed
Mobile -3.6% -2.0% +158% -8% +58%
Change 2002 - 2006
Source: BARB, RAJAR, operators, Nielsen//Netratings and Ofcom calculations
Notes: The TV figure is for 2003 rather than 2002 to avoid the effects of changes in BARB panel composition. Daily figures were calculated from monthly data on the assumption that there are 30.4 days in the average month; the exception was internet consumption where the quoted figures relate to May 2002 and April 2006, and the number of days in those months were used. The internet consumption figures for 2006 excludes the use of applications. The numbers quoted in this report are not comparable to those in the 2006 edition, owing to a change in source.
component. It was fuelled partly by increasing subscriber numbers, but mostly by rising average revenue per user, offset somewhat by falling advertising revenue. Radio advertising also experienced a contraction in 2006, but unlike TV it did not have the ‘cushion’ of growing subscription revenue; so total radio revenue fell by nearly 9% in 2006.
Figure 1.5 Communications industry revenue
Revenue (£bn)
£32.2bn £34.4bn £36.3bn £38.0bn
£8.9bn £9.3bn
£10.1bn £10.6bn £10.8bn
£42.2bn £44.8bn
£47.6bn £49.8bn £50.4bn
£38.5bn
£0 £10 £20 £30 £40 £50 £60
2002 2003 2004 2005 2006
Radio
TV
Telecoms
Growth 05-06 (%)
-8.8%
+1.8%
+1.3%
1.3 Overview of market convergence
1.3.1 Defining convergence
A variety of definitions of convergence exist, and this report does not lay claim to provide the definitive description. Instead, it proposes an approach from which future definitions (and the analysis that follows from them) can be improved.
At its most fundamental level convergence has been facilitated by the replacement of analogue technologies with their digital counterparts. This has resulted in networks which were designed to carry one medium instead carrying a variety of media. Similarly, many devices can now handle a multiplicity of media types where formerly they had one dedicated purpose. So convergence could perhaps be said to have an impact on three key areas:
• Content – offering an opportunity for content producers to create use mixed-media formats (e.g. TV/interactive/web) and new ways to distribute existing content;
• Networks – upgrades that widen the capabilities and capacity of historically separate and single-purpose distribution infrastructure; and
• Devices – the creation of equipment that offers functionality typically delivered on stand-alone devices.
1.3.2 The evolution of convergence
With these definitions in mind, Figure 1.6 illustrates that communications markets have been converging for some time, but that the pace has accelerated since 2005.
Figure 1.6 The convergence timeline
• Electronic Telegraph launches • MS Windows
3.1 launches • Sky encrypts its
channels • First World
Wide Web browser, Mosaic, launches
1993
• Cable triple-play: telephone, TV & broadband • iPod launches
• Satellite TV launches 1989
• First email sent • Colour TV
launches 1967
• Ceefax launches
1973
• VCRs first available 1976
• IBM PC launches 1981
• Skype launches
• OnDigital folds • Freeview
launches 2002
• Sky Digital and OnDigital launch • BBC Choice
and ITV 2 launch 1998
3G operators awarded licences 2000
• C4 live streaming • 4OD launches • Free broadband • BT 21CN
announced • DVB-H mobile
television trials 2006
• ITV live streaming • Virgin quad play • 52% homes
broadband • Joost launches • BBC iPlayer
launches • BT Movio
launches and closes 2007 2003
• First text message sent
• BT Fusion launches • Fixed line SMS 2005
• BBC Online launches
1997
1992 1994
Source: Ofcom
Ten years ago, the internet could only be accessed using a dial-up connection and analogue multichannel television was the only alternative to the public service broadcasters. Second generation mobile networks were still being rolled-out, text messaging was in its infancy, it was early days for audio streaming and video streaming was only just launching. In some respects, this industry had more in common with that of the 1970s than it did with today’s communications markets. Content was still often carried to consumers over a specific network, usually to a defined consumer device. The picture today is very different: a wide variety of devices are capable of supporting many different media and can connect to at least one (and often more than one) digital communications network, eliminating the ‘hard wired’ relationships between content, networks and devices.
Figure 1.7 Communications markets – 1970s, 1990s and today
Transmitter PSTN Masts
AV Audio
Voice Voice Text Pics
PSTN Audio AV PSTN Cable Towers Masts PSTN Cable Altnets Dedicated networks Dedicated devices
Some network convergence
Dedicated devices
Converging networks
Converging devices
Voice Text Pics AV Audio
1970 1995 2007
Transmitter and satellite Satellite Transmitter CONT EN T DIS T RIBU TION DE VIC E Transmitter
No segment of communications has remained untouched by convergence. Producers have new ways of exploiting content; packagers can distribute services over new platforms and to new devices, while consumers can find content using new navigational tools and can
consume it in an expanding number of ways.
Figure 1.8 Key communications market developments in 2006
Content and
rights Packaging Distribution Device Navigation
The development and production of content - audio, audio-visual, music and publishing.
Aggregating content - into channels or into portals; packaging channels into bundles.
Distributing content over infrastructure -2G, 3G, DTT, DSat, DCable, ATT, DSL.
Receiving and consuming content on a reception device.
Instruments and services that help consumers find content.
Consumption
Consumers devoting time to viewing AV output, listening to audio and surfing the internet. Descri p ti o n Producers and broadcasters agreed terms of trade for new media rights; revenue from these rights more than doubled to £42m. Consumers embraced user-generated content.
The range and breadth of packaged communications grew significantly, with new operators entering the market and historically separate services bundled together.
Distribution platforms increasingly took on the ability to carry more than one sort of media, perhaps most noticeably with mobile internet access, which became more useable.
The growing power of devices saw game consoles such as the PS3 offering realistic gameplay while mobile phones began to competed with stand-alone devices in areas such as photography
Electronic programme guides now offer an easy way to find broadcast content.
Listings magazines remain popular but have continued to see their circulation fall year-on-year.
Consumption of traditional broadcast media continues to decline, along with fixed voice minutes. Mobile voice continued to grow in popularity. K e y d e v e lop m e nts Producers and broadcasters agreed terms of trade for new media rights; revenue from these rights more than doubled to £42m. Consumers embraced user-generated content.
The range and breadth of packaged communications grew significantly, with new operators entering the market and historically separate services bundled together.
Distribution platforms increasingly took on the ability to carry more than one sort of media, perhaps most noticeably with mobile internet access, which became more useable.
The growing power of devices saw game consoles such as the PS3 offering realistic gameplay while mobile phones began to competed with stand-alone devices in areas such as photography
Electronic programme guides now offer an easy way to find broadcast content.
Listings magazines remain popular but have continued to see their circulation fall year-on-year.
Consumption of traditional broadcast media continues to decline, along with fixed voice minutes. Mobile voice continued to grow in popularity. K e y d e v e lop m e nts
straightforward acquisitions, to exclusive partnerships, to the bundling of products and services from different parts of the value chain: content and rights, packaging, distribution, device, navigation and consumption. Below we list a selection of company deals and partnerships from the last 12 months.
Figure 1.9 Selected deals and partnerships since September 2006
3 agrees to offer Sky Mobile TV to its subscribers 3, BSkyB
Nov 2006
3 UK offers Google Search and Google Maps on the Planet 3 mobile portal 3, Google
Aug 2007
Nokia installs Microsoft’s new content access technology into certain handset series. The two companies also agree to collaborate in efforts to improve consumer access to and experience of digital content
Nokia, Microsoft Aug 2007
The 4Digital Group, led by majority shareholder Channel 4 Radio, submits a bid for the new DAB national radio multiplex licence. The licence was awarded to the group in July 2007
Channel 4, BSkyB, Emap, UTV, Carphone
Warehouse, UBC Media Group
Mar 2007
BSkyB buys a 17.9% stake in ITV BSkyB, ITV
Nov 2006
3 links up with a range of operators, manufacturers and application providers to launch its X-series service
3, Skype, Sling Media, Yahoo!, Nokia, Google, eBay, Microsoft, Orb, Sony Ericsson Nov 2006
Sky and Amstrad announce the terms of a recommended cash offer to be made by Sky Digital Supplies for Amstrad
BSkyB, Amstrad July 2007
Tiscali to add the full set of Sky basic channels to its line-up BSkyB, Tiscali
June 2007
HMV offers EMI’s DRM-free catalogue for download EMI Music, HMV
June 2007
Virgin puts Football League match highlights on its broadband and mobile platforms The Football League,
Virgin Media July 2007
EMI and T-Mobile collaborate on a trial of ad-supported mobile video with advertising delivered by Rhythm New Media
EMI Music, T-Mobile, Rhythm New Media Sept 2006
ITV links up with Premium TV to stream UEFA Champions League football games over itv.com
ITV, Premium TV Oct 2006
EMI to make mobile real tones and music videos available to Jamster users EMI Music, Jamster
Nov 2006
BT announces Vodafone as its exclusive mobile partner for the BT Vision TV service BT, Vodafone
Dec 2006
EMI makes its artists’ music available to Last.fm users EMI, Last.fm
Feb 2007
Bebo and Orange launch a social networking service on the Orange network Bebo, Orange
Mar 2007 Apr 2007 Date
ITN launches free news and entertainment content on 3's video service, with advertising delivered by Rhythm New Media
ITN, 3, Rhythm New Media
Participants Deal
1.3.3 Service bundling
For consumers, perhaps the most tangible sign of convergence in 2006 was the increasing availability of bundled packages of communications services. From a small number of operators offering a narrow set of communications packages, 2006 saw the entry of a large number of new players and broader bundled offers. In most cases, each of the different services in a bundle still travels over a distinct network and is received by a separate device, and hence, in the main, bundling constitutes convergence only to the extent that the
customer can receive more than one service from the same operator.
In the face of intensifying competition, the ability to bundle services allows operators to offer different product combinations, each with varying features at different price points. For example, broadband services can be delivered with different headline speeds and may be offered more cheaply to those willing to accept longer contract lengths. In addition, customer acquisition may be boosted by supplementary promotions such as ‘free’ wireless routers with certain packages.
Bundling may also be driven by operational and longer-term strategic concerns:
• Having previously been restricted to one platform, operators can exploit economies of scale from serving multiple platforms;
• Bundling may protect operators’ existing markets; moving into another operator’s territory in anticipation of them moving in to yours; and
• Finally, bundling has become increasingly central in retaining customers, which has become progressively more important as markets become saturated, customer acquisition costs remain high and customers continue to churn.
While Figure 1.6 shows that operators have been bundling services for decades, the range of operators entering the market, the pace at which new bundles have been offered, and the complexity of some of the offerings has increased noticeably in the past year. Some of the key launches in the last 12 months are shown in the chart below:
Figure 1.10 Bundling since April 2006
• Vodafone launches bundled broadband and mobile
Jan 07 • BT launches BT
Vision, and with it, bundled TV offers
Dec 06
• TalkTalk launches bundled broadband and fixed telephony April 06
• Orange launches bundled broadband and mobile
June 06
• Sky launches bundled broadband, fixed and pay TV July 06
• NTL/Telewest launches ‘quadplay’ bundles, containing TV, fixed line, broadband and mobile
Sept 06
• Tiscali launches bundled TV and broadband Mar 07
• Orange launches Unique – a fixed mobile convergence product
Nov 06
Source: Ofcom
The table below shows the range of different services offered by the main operators. Consumers do not always need to purchase a bundle in order to receive more than one service from the same operator – but the stand-alone proposition may not offer a price discount. Conversely, in certain cases the bundled elements cannot be taken as stand-alone services. For example, Sky Broadband and Sky Talk are only available to Sky TV
Figure 1.11 Bundled service offers from major suppliers, June 2007 Y Y Y Y Y Y Y Y Broadband and mobile
Y Y Converged offers
Y Y
Fixed, TV and mobile
Y Y
Y Y Fixed and TV
Y Y Y Y
Y Fixed and mobile
Y Y Y Y
Y Broadband, fixed and mobile
Y Y
Broadband, mobile and TV
Y Y
Broadband, fixed, TV and mobile
Y Y
Y Y Broadband, fixed and TV
Y Y Y Y Y Y Y Y Y Y Fixed and broadband
Y Y Y Y Y Y Y Y Y Y Y Y Standalone broadband Y Y Y Y Y Y Y Y Broadband and mobile
Y Y Converged offers
Y Y
Fixed, TV and mobile
Y Y
Y Y Fixed and TV
Y Y Y Y
Y Fixed and mobile
Y Y Y Y
Y Broadband, fixed and mobile
Y Y
Broadband, mobile and TV
Y Y
Broadband, fixed, TV and mobile
Y Y
Y Y Broadband, fixed and TV
Y Y Y Y Y Y Y Y Y Y Fixed and broadband
Y Y Y Y Y Y Y Y Y Y Y Y Standalone broadband Tal k Tal k Tesco Tis cali To ucan Virgin M e d ia Vo da fo ne Pl us Ne t BS ky B Pi pex Orange BT Be ( O 2 ) AO L
Source: Pure Pricing
Note: Highlighted box denotes that the combination of services requires the purchase of additional services.
Service bundling has increased the range of consumer propositions significantly, as different operators may offer numerous bundles containing different dimensions to each service. Different headline broadband speeds, different ranges of TV channels and varying numbers of inclusive mobile minutes, texts and data access may make comparison between
operators not necessarily simple. The situation is complicated further by the additional offers mentioned earlier. These may include online discounts, ‘free’ extras such as wireless
routers, reduced monthly charges for longer-term contracts, and additional customer service charges such as for receiving a paper bill.
However, the greater range of offers means that if consumers shop around and spend time examining the details of different bundles, they may well find a better-value offer than they did when they purchased single services from different operators. There is also a potential impact on switching. On the one hand customers may find it more difficult to switch provider when all their services are tied up with one operator, and they may be locked in for longer, as bundled deals are generally associated with longer contracts in an effort to retain customers. Offsetting that to some degree, the rolling of services into one bundle may provide extra incentive for customers to shop around, as the advantages of switching provider become more pronounced when they are calculated for a range of services as opposed to a single one.
1.3.3.2 Take-up of multi-service offerings
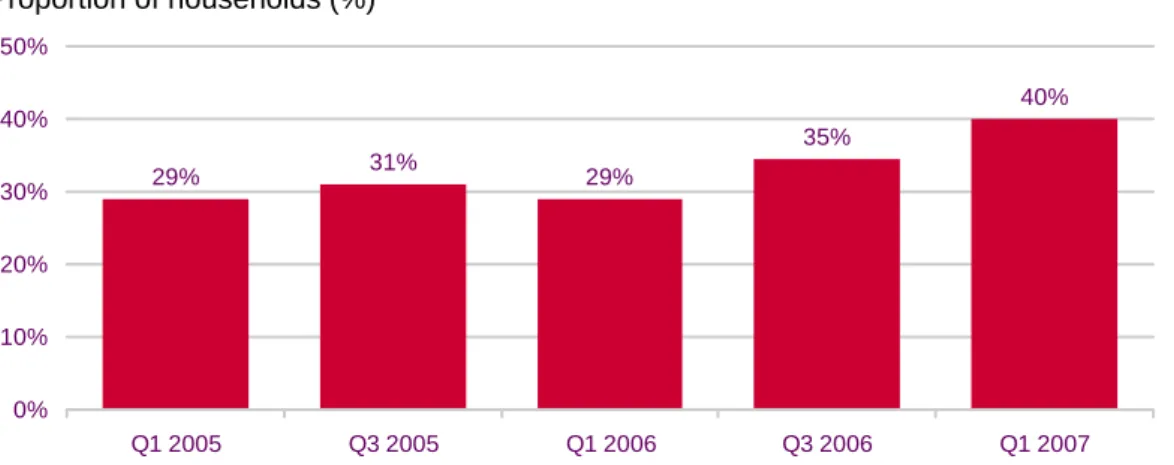
Figure 1.12 Households taking bundled services from an operator
Proportion of households (%)
29% 31% 29%
35%
40%
0% 10% 20% 30% 40% 50%
Q1 2005 Q3 2005 Q1 2006 Q3 2006 Q1 2007
Source: Ofcom research, Q1 2007
Fixed line voice is the service that most commonly features in bundles purchased, followed by broadband, the penetration of which among specified purchase bundles has increased by 23 percentage points over the last two years. The increase in the take-up of bundled
broadband is related to the growth of broadband per se, and the other services that broadband facilitates such as IPTV. The ‘other’ category contains thirteen different service combinations, the most popular of which are broadband and multichannel TV followed by fixed voice, broadband and mobile.
Figure 1.13 Bundled services purchased by consumers by type
Proportion of bundles purchased (%)
30% 36% 40% 44%
47%
12% 13%
18% 17%
18%
23% 19%
16% 13% 12%
15% 16%
13% 10% 8%
5% 4% 4% 4% 2%
14% 13% 9% 12% 13%
0% 20% 40% 60% 80% 100%
Q1 2005 Q3 2005 Q1 2006 Q3 2006 Q1 2007
Other
Fixed voice, dial-up and multichannel TV
Fixed voice and multi-channel TV
Fixed voice and dial-up
Fixed voice, broadband and multichannel TV
Fixed voice and broadband
Source: Ofcom research, Q1 2007
1.3.4 Approach to the rest of this section
The remainder of this section looks at each the communications sector from the perspective of a value chain and is structured into six sections:
a) content creation and voice;
b) content aggregation;
c) distribution over networks;
e) navigation through to content; and
f) consumers’ consumption.
To provide two practical examples of how the value chain approach can be applied to communications markets operators, compare the roles of the BBC and BT in 2007 and 20 years earlier. Figure 1.4 illustrates the ‘intensity of activity’ undertaken by each organisation at each stage of the value chain at each of those time points. It shows how both have changed their focus along the chain, reducing exposure to (or even exiting) some activities (for example, broadcast distribution in the case of the BBC) and building up a bigger role/presence at other stages of the chain (for example, BT’s acquisition of various on-demand content rights).
Figure 1.14 BBC and BT roles in the communications market value chain
Content and
rights Aggregation Distribution Device Navigation
BBC 1987
BT 1987
BT 2007 BBC 2007
A BBC now obliged to
commission proportion of output from the independent sector - and has opened up more commissioning budget to independents. A
BBC's terrestrial distribution infrastructure sold off in 1997 to Crown Castle. Now contracts for carriage on terrestrial and satellite. B
BBC monopoly on its TV and radio listings broken in 1992.
Radio Times still available,
but competes with EPGs and other listeing magazines. C
B C
D E F
BT has recently acquired film, music and sporting rights which are now available through its on-demand service BT Vision D
BT once enjoyed an exclusive role in the retailing and rental of domestic telephony devices. There are now a large number of equipment suppliers. F
The range of services that BT once offered to domestic premises were limited to voice telephony. BT now offers a broad range of packaged services to suit a variety of consumer needs. E
BBC BT
Content and
rights Aggregation Distribution Device Navigation
BBC 1987
BT 1987
BT 2007 BBC 2007
A BBC now obliged to
commission proportion of output from the independent sector - and has opened up more commissioning budget to independents. A
BBC's terrestrial distribution infrastructure sold off in 1997 to Crown Castle. Now contracts for carriage on terrestrial and satellite. B
BBC monopoly on its TV and radio listings broken in 1992.
Radio Times still available,
but competes with EPGs and other listeing magazines. C
BBC now obliged to commission proportion of output from the independent sector - and has opened up more commissioning budget to independents. A
BBC's terrestrial distribution infrastructure sold off in 1997 to Crown Castle. Now contracts for carriage on terrestrial and satellite. B
BBC monopoly on its TV and radio listings broken in 1992.
Radio Times still available,
but competes with EPGs and other listeing magazines. C BBC monopoly on its TV and
radio listings broken in 1992.
Radio Times still available,
but competes with EPGs and other listeing magazines. C
B C
D E F
BT has recently acquired film, music and sporting rights which are now available through its on-demand service BT Vision D BT has recently acquired film, music and sporting rights which are now available through its on-demand service BT Vision D
BT once enjoyed an exclusive role in the retailing and rental of domestic telephony devices. There are now a large number of equipment suppliers. F BT once enjoyed an
exclusive role in the retailing and rental of domestic telephony devices. There are now a large number of equipment suppliers. F
The range of services that BT once offered to domestic premises were limited to voice telephony. BT now offers a broad range of packaged services to suit a variety of consumer needs. E The range of services that BT
once offered to domestic premises were limited to voice telephony. BT now offers a broad range of packaged services to suit a variety of consumer needs. E
BBC BT
While reading the remainder of this section, please bear in mind four key points:
• A wide variety of data sources have been used - the analysis is undertaken using data provided to Ofcom by operators and licensees, data from Ofcom’s consumer tracker surveys, bespoke research commissioned for the report, and third party data sources;
• Analysis is not evenly distributed across each of the six stages – owing to the richness of data at some stages, and to an absence at others, we have been unable to analyse all aspects of convergence with the same level of scrutiny;
• The analytical framework may sometimes ‘strain’ – reflecting the degree to which the industries we regulate cannot yet be considered as fully converged; and
1.4 Content and voice
The effect of converging technologies has been felt across most content markets:
• Computer games manufacturers have seen their market expand as rising broadband take-up has allowed consumers to interact with one other in multi-player online games; mobile handsets are now also powerful enough to offer engaging gaming titles;
• The music industry has found that sales of singles have been boosted through online and mobile downloads;
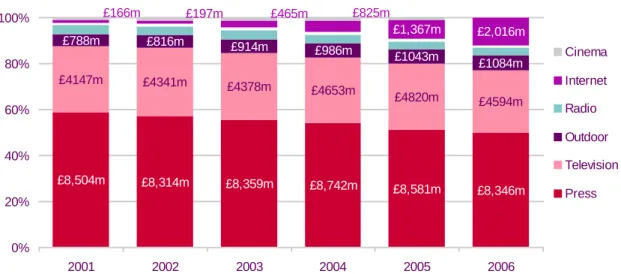
• The press were among the first to harness the opportunities of converging technologies with the launch of websites in the mid-1990s; and
• The audiovisual production industry is still predominantly funded by broadcasters but revenue from the exploitation of new media rights is growing quickly.
The analysis in this section includes all these industry-produced content forms alongside advertisements. They can be distributed using print media, mobiles, television, radio or the internet. From the perspective of communications markets, there are also those forms of content generated by individual consumers such as voice and texts.
Historically, these two forms of content (industry, consumer) enjoyed quite separate roles – ‘industry’ content tended to be distributed on a ‘one-to-many’ basis, developed with a mass-market audience in mind, while voice and texts were distributed on a ‘one-to-one’ basis. However, with the development of the world-wide web and the emergence of so-called Web 2.0 applications, these distinctions have become increasingly blurred. Mass-market industry players have found themselves able to tailor output for narrow audience segments, while consumers in turn have found an outlet that permits them to communicate with large numbers of individuals simultaneously.
For the purposes of the analysis of content and rights, this section will make a distinction between professionally-produced output and that created by individual consumers, in the form of voice, SMS and user-generated content.
1.4.1 Professionally produced content
The creative industries considered in this analysis were estimated by the Department of Culture, Media and Sport (DCMS) to have generated Gross Value Added (GVA) of £25bn in 2004 (the last year for which comparable data was available). Publishing and advertising alone accounted for approximately 64% of this figure, and 1.6% of UK-wide GVA.
Figure 1.15 Creative industries Gross Value Added (GVA) contribution, 2004
£bn, 2004 Gross value added per employee (£’000, 2004)
£9.2bn
£7.1bn
£5.1bn
£3.0bn
£0.8bn £54k
£73k
£70k
£42k
£36k
0 3 6 9 12 15
Publishing TV & radio Advertising Music Games
0 20 40 60 80
Gross Value Added (£m)
GVA per
employee (£'000)
Source: Frontier Economics analysis of ABI (Annual Business Inquiry) data
The remainder of this section considers aspects of the games, music, audiovisual industries and the press.
1.4.1.1 Online and console games
Multi-player online games increasingly popular
The growing availability of devices capable of handling a variety of media coupled with networks that are able to distribute a range of digital content has helped to transform the games landscape over the last five years. This has tested the historical division in the games industry between proprietary consoles (home and handheld) and stand-alone (i.e. non-networked) computers. The popularity of multi-player games delivered over the internet has risen significantly while distribution channels have also felt the effects of converging
technologies as, for example, games can be downloaded straight to consoles’ hard drives. These developments are blurring the distinctions between games and user-generated content, as so-called ‘massively multiplayer online’ (MMOs) games like Second Life and World of Warcraft offer consumers the chance to lead virtual lives where they and their fellow players are, in effect, the stars of the show.
What are massively multiplayer online games?
The high bandwidth connectivity provided by a broadband connection has enabled increasing numbers of consumers to participate in multi-player games over the internet.
Second Life and World of Warcraft are two such games, the former with 7 million players and the latter with 9 million subscribers worldwide. While access to a basic tier of Second Life is free, there is a monthly subscription that allows a user’s avatar (i.e. their
Not only do their business models differ, so do the user objectives. World of Warcraft requires users to slay monsters and fulfil quests; in Second Life there is no overall objective and its world is open-ended and user-generated, meaning that there are no set boundaries and that almost everything has been designed and built by users.
Several communications industry operators have joined and built a presence in Second Life. They include Reuters, the BBC, Channel 4 and Sky News, which has hosted virtual
interviews and events and report Second Life and real-life news.
Mobile games growing in popularity
Mobile phone handsets have also started to become a games platform, with around 19% of subscribers claiming to play between one and three games on their phone at least monthly; 4% claim to play daily (Figure 1.16).
Figure 1.16 Frequency of mobile phone game playing, Jan 2007
Number of mobile subscribers playing games on their mobile (m)
2.6m 4.1m
6.4m
13.1m
0m 5m 10m 15m 20m
Almost every day At least once a week One to three times a month
Total
Source: M:Metrics
Figure 1.17 Most popular mobile games genres, May 2007
Estimated subscribers (thousands)
421
246 234
220 215 203 197
177
152 136 132
109 54 0 100 200 300 400 500 A rca d e p u zzl e R e tro a rc a de Bo a rd St ra te g y Ca s in o Sp o rts W o rd o r N u m ber Qu iz Ot h e r Ca rd A c tion/ adven tu re Ra c in g F irs t-p e rs o n sh o o te r Source: M:Metrics 1.4.1.2 Music
Digital distribution reviving the singles market?
Advancing digital technologies have exerted a strong influence over the sales, formats and distribution channels of music in the UK. While overall music revenue fell by an average of 3.4% p.a. over the last five years, this has been offset somewhat by the growing popularity of both mobile and online music, with digital music trade sales (i.e. the revenue that finds its way back to the music labels) in 2006 accounting for £67m of total industry revenue of £1.1bn; 37% of digital sales (£25m) were purchased through a mobile handset while the remaining 63% (£42m) were bought online (Figure 1.18).
Figure 1.18 Total and digital music sales in the UK, 2006
Proportion of all trade sales (%)
CDs and vinyl £1,042m Online downloads £42m Digital: £67m Mobile downloads £25m 0% 20% 40% 60% 80% 100%
Total music trade sales Total digital music trade sales
Total sales = £1109m Digital sales = £67m
Source: IFPA and Screen Digest
Figure 1.19 Mobile network operators’ music services Nov 04 Q3 04 Aug 04 Mar 04 Nov 03 Jul 04 Launch £1.50 500k Planet 3 Three 600k 400k n/a 130k 500k Aug 2006 catalogue £1.50 Mobile Jukebox T-Mobile £1.50 Virgin Bites Virgin Mobile From 99p Vodafone Live! Vodafone From 99p £1.50 Track prices O2 Active Orange World Service O2 Orange Network Nov 04 Q3 04 Aug 04 Mar 04 Nov 03 Jul 04 Launch £1.50 500k Planet 3 Three 600k 400k n/a 130k 500k Aug 2006 catalogue £1.50 Mobile Jukebox T-Mobile £1.50 Virgin Bites Virgin Mobile From 99p Vodafone Live! Vodafone From 99p £1.50 Track prices O2 Active Orange World Service O2 Orange Network
Source: Screen Digest
The music market offers one of the more compelling examples of how converging technologies can help stem falling sales. Throughout the 1990s and 2000s, the singles market was in decline; in 2002, a single had to achieve sales of around 26,000 in order to get in to the top ten – by 2006 that figure had halved. The emerging popularity of single track sales through mobiles and online, however, could well reverse this trend, as illustrated in Figure 1.20. Between 2005 and 2006, digital single sales trebled and digital downloads accounted for 79% of all units sold in 2006; this proportion rose further to 90% in the first half of 2007.
Album sales have also seen year-on-year reductions in physical sales. However, these have recently been partially offset by online distribution, where volumes rose by 160% between 2005 and 2006 to 4.7m units, representing 1.4% of all sales, increasing to 3.5% by H1 2007. Recognising the importance of digital downloads to the future of the UK’s music sales, the official Top 40 began to include them in its sales figures in April 2005 (Figure 1.20).
Figure 1.20 Digital single and album sales
Unit sales 6m 24m 72m 0m 20m 40m 60m 80m 100m
2004 2005 2006
Digital single sales
0.2m 1.8m 4.7m 0m 1m 2m 3m 4m 5m
2004 2005 2006
Digital album sales
79% of all single sales
1.4% of all album sales
Source: IFPA and Screen Digest
Figure 1.21 The prevalence of unauthorised downloads, 2007
Proportion of respondents (%)
6% 8% 18% 29% 41% 41% 65% 56% 41% 0% 20% 40% 60% 80% 100%
2005 2006 2007
More often About the same Less often
57% 53% 38% 30% 24% 0 10 20 30 40 50 60
13-17 18-24 25-34 35-44 45+
16 9 2 5 5
Change since 2006 (percentage points)
"Have you ever downloaded unauthorised music?" "Thinking about [unauthorised music], do you think in the next year you will download tracks…"
6% 8% 18% 29% 41% 41% 65% 56% 41% 0% 20% 40% 60% 80% 100%
2005 2006 2007
More often About the same Less often
57% 53% 38% 30% 24% 0 10 20 30 40 50 60
13-17 18-24 25-34 35-44 45+
16 9 2 5 5
Change since 2006 (percentage points)
57% 53% 38% 30% 24% 0 10 20 30 40 50 60
13-17 18-24 25-34 35-44 45+
16 9 2 5 5
Change since 2006 (percentage points)
"Have you ever downloaded unauthorised music?" "Thinking about [unauthorised music], do you think in the next year you will download tracks…"
Source: The 2007 Digital Music Survey, Entertainment Media Research Ltd in association with Olswang. Note: n= 1721 for the first chart and n=740 for 2007 in the second chart.
1.4.1.3 Audiovisual (AV) content
Broadcast commissions still account for the lion’s share of AV revenue
Non-broadcast rights, including those generated from convergent markets, are emerging as valuable alternative sources of revenue for independent producers (see Figure 1.22). A recent survey of independent producers by trade-body PACT suggested that the revenue generated for independent producers by new media rights rose by 121% in 2006 to £42m.
Figure 1.22 Independent producer revenue from non-broadcast rights
Sales £14m £19m £59m £24m £42m £124m 0 50 100 150
Corporate New Media Other
£ (m ill io n ) 2005 2006
Source: PACT 2007
Notes: ‘Other’ activities include music publishing, consumer products, talent management and the production of commercials and idents.
The impact of converging technologies on the treatment of content rights
The agreements struck between the UK’s main broadcaster and PACT follow on from the 2003 Communications Act, which stated that rights not explicitly assigned to a broadcaster remained with the producer. Terms were agreed on a range of rights issues including catch-up windows and VoD, along with revenue-sharing agreements for pay-per-view services. These agreements were an important step in ensuring that the PSBs were able to develop full-fledged online AV propositions such as 4OD and itv.com, both of which launched in the last year.
The sale of audiovisual rights to premiership football matches by the FA Premier League provides an example of how rights holders are responding to market convergence.
For the three football seasons from 2001/02, the Premier League for the first time put new media rights to tender, offering mobile rights in addition to those for television, while internet rights were reserved for its clubs’ own websites. A multi-million deal was secured from new operator 3 for exclusive mobile rights.
A similar exercise was undertaken for the three seasons from 2004/5. However, this time internet rights were also made available to the successful TV rights bidder, BSkyB, which used football rights as a central plank in building its own online presence.
However, for the three seasons from 2007/8 it was clear that a platform-based approach was no longer practical. With the streaming of live TV channels available through mobile TV and IPTV, the Premier League instead opted for a platform-neutral approach, with successful bidders able to utilise their rights on TV, internet and mobile.
Television broadcasters led the bidding for the live match packages, with BSkyB landing four of the packages, and Setanta winning two. Other rights were sold on a “windowing” basis. BSkyB and BT won the rights to offer full matches in a window for 50-hours from 10pm on match day, which they will do through their broadband, satellite TV and IPTV platforms, and also on mobile platforms, wherever they have agreements with network providers. BSkyB, with backing from News International newspapers The Sun and The News of the World, also beat a joint bid from the five mobile operators for a package including short post-match highlights soon after full-time and in-match clips for some games. They are expected to utilise these clips through the Sky mobile application.
It is clear that although the ability to distribute content to a range of devices (TV, mobile, computer) means it is no longer practical simply to divide rights by platform, different types of rights are appropriate for different platforms. Television is particularly well suited for live, the internet for “catch up” and mobile for short “near-live” clips. The FA Premier League has been able to maximise its revenues by creating different rights packages appropriate for the different platforms, while BSkyB’s aspiration to be a leader in football on all platforms meant that it bid for all types of rights.
However, put into the context of many independents’ core business – the production of broadcast AV - the value of new media still looks modest. The rights to 1 million hours of AV output – including repeats and sporting events – were acquired by the UK’s television
Figure 1.23 Hours of broadcast AV output in 2006
Proportion of total hours (%)
21,554
13,619
11,919
100,734
Originated: 147,826
Repeats
872,152
0% 20% 40% 60% 80% 100%
Total hours of output Total hours of originations
Other digital channels
Nations & regions output
BBC digital channels
Five main channels Total hours = 1,019,978 Originated hours = 147,826
Source: Operators
Notes: Includes the five PSB channels and multichannels in the Entertainment, Factual, Leisure, Sport, News and Children’s genres.
With independent production benefiting from statutory obligations (BBC, ITV1, Channel 4 and Five) and further voluntary commitments from the BBC, the combined revenue of the top five independent producers in the UK was estimated by Broadcast to have reached £555m in 2006 (Figure 1.24).
Figure 1.24 Revenue from the UK’s top five independent producers, 2006
Revenue (£m)
£166m
£146m
£126m
£59m
£44m
£0m £50m £100m £150m £200m
Hit Entertainment Talkback Thames TWI Tiger Aspect Aardman Animation
Source: Broadcast Indies Survey 2007
1.4.1.4 Press
The press were among the first to harness converging technology
Figure 1.25 Popular and broadsheet daily circulation
Average daily sales (millions)
0 1 2 3 4
Jul-02 Jul-03 Jul-04 Jul-05 Jul-06
Daily Express Daily Mail Daily Mirror Daily Star Daily Telegraph Financial Times Guardian Independent Sun Times
Source: ABC / Mediatel.co.uk
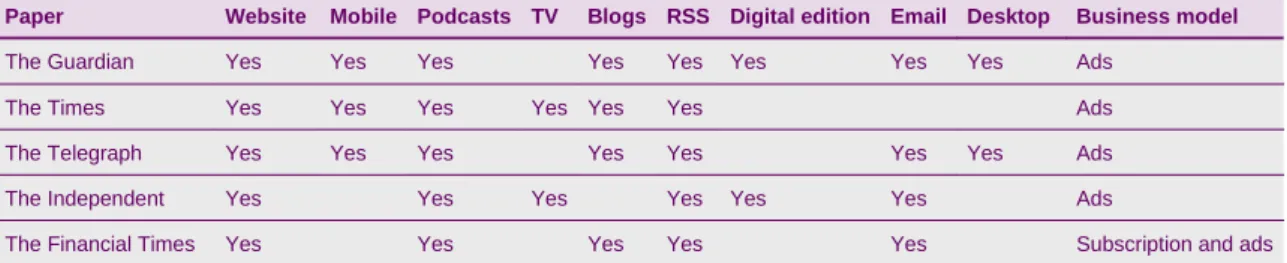
From early incarnations that focused mainly on reproducing the print edition online (the Electronic Telegraph was a pioneer in 1994), most of the UK press, popular and broadsheet, now produce online editions, with a wide range of functions and features, many of which encourage user-generated content. Most recently, The Times and the FT have branched out into tele-journalism, offering audiovisual streamed packages of their leading journalists opining on stories of the day (Figure 1.26).
Figure 1.26 Content and functionality offered online by the UK broadsheets
Yes Yes Desktop Yes Yes Yes Yes Blogs Yes Yes Yes Yes Yes RSS Yes Yes Digital edition Yes Yes Yes Yes Yes Podcasts Yes Yes Yes Mobile Yes Yes Yes Yes Yes Website
Subscription and ads Yes
The Financial Times
Ads Yes Yes The Independent Ads Yes The Telegraph Ads Yes The Times Yes Email TV The Guardian Paper Ads Business model Yes Yes Desktop Yes Yes Yes Yes Blogs Yes Yes Yes Yes Yes RSS Yes Yes Digital edition Yes Yes Yes Yes Yes Podcasts Yes Yes Yes Mobile Yes Yes Yes Yes Yes Website
Subscription and ads Yes
The Financial Times
Ads Yes Yes The Independent Ads Yes The Telegraph Ads Yes The Times Yes Email TV The Guardian Paper Ads Business model Source: Ofcom
Note: A digital edition is a full version of the print copy that can be accessed online
Figure 1.27 Unique monthly users of the broadsheet internet sites
Unique users (m)
0.0m 0.5m 1.0m 1.5m 2.0m
Oct-06 Nov-06 Dec-06 Jan-07 Feb-07 Mar-07 Apr-07 May-07
The Guardian
The Telegraph
The Independent
Times Online
Source: Nielsen//Netratings – ‘At home’ data
1.4.2 User-generated content
One-to-one – voice telephony
Signs of fixed-mobile call substitution?
Traditionally individualshave been regarded as the consumers of content – but if the definition of content is extended to include voice telephony, then they have long been a participant in content production. In 2006, 152 billion minutes of fixed calls were made across the UK, along with 82 billion minutes of mobile calls, equating to 11 minutes of telephony time per person per day (Figure 1.28).
Figure 1.28 Fixed and mobile minutes
Billions of minutes
165bn 167bn 164bn 160bn
152bn
52bn 59bn 64bn
71bn 82bn
0 50 100 150 200
2002 2003 2004 2005 2006
Voice
Mobile
Source: Operators