India in the Super-Cycle
3.
India: Mapping the country‟s diversity
11
4. Macroeconomic structure: Striking the right balance
16
5. Demographics: Young and vibrant
18
6. Middle class and consumerism: Affordability and aspirations
20
7. The challenges of making every head count
a. Education and health: Nourishing body and mind
22
b. Employment: Jobs for all
25
c. Urbanisation: A tale of many cities
27
d. Food security: Feeding more than a billion mouths
29
8. Infrastructure: Powering growth
31
9. Land resources: Breaking the gridlock
34
10. Innovation and entrepreneurship: The inspiration factor
36
11. Institutions: The bedrock of stability
38
12. Trade and capital flows: Fading boundaries
40
13. Financial markets: Making a global mark
43
14. Inequality: Bridging the chasm
45
15. Energy and environment: Securing the future
48
Appendix
The unfinished reform agenda
50
India then and now
51
India forecasts
55
Contributors
Gerard Lyons
Chief Economist and Group Head, Global Research
+44 20 7885 6988 Gerard.Lyons@sc.com
Samiran Chakraborty
Head of Research, India+91 22 6735 0049
Samiran.Chakraborty@sc.com
Anubhuti Sahay
Senior Economist+91 22 2266 0014 Anubhuti.Sahay@sc.com
Priyanka Kishore
FX Strategist+91 22 2266 4897 Priyanka.Kishore@sc.com
Nagaraj Kulkarni
Senior Rates Strategist – South Asia
+91 22 2265 5934 Nagaraj.Kulkarni@sc.com
Divya Devesh
International Graduate+91 22 6735 0246 Divya.Devesh@sc.com
1.
Overview: India responds to China’s challenge
India: the world‟s largest democracy; home to its second biggest population, with 1.2bn people, half of whom are under 25; the world's 10th largest economy, with a GDP of USD 1.7trn, and fourth biggest when measured in terms of purchasing power. All of these are impressive statistics, but they only tell part of the India story.
India has an opportunity to regain its prominent position in the world economic order. Whether it succeeds will depend on how it deals with some of its challenges over the next few decades. And there are many of these. There are many opportunities, too. In this Special Report, we aim to enlighten the reader further as to the challenges and opportunities ahead. The report delves into key challenges and explores India‟s options for overcoming them in order to emerge as a world leader.
To put the report in context, it is a follow-up to The Super-Cycle Report published on 15 November 2010. There, we argued that the world economy is now experiencing its third super-cycle. This has been led by the rise of China, India and other emerging economies, shifting the balance of economic and financial power from the West to the East.
In that report, we defined a super-cycle as: “A period of historically high global growth, lasting a generation or more, driven by increasing trade, high rates of investment, urbanisation and technological innovation, characterised by the emergence of large, new economies, first seen in high catch-up growth rates across the emerging world.”
The first super-cycle took place from 1870 to 1913. It had many features, including the emergence of the US economy, which moved from the number four position to become the world‟s major economy. The second super-cycle started after the Second World War and lasted until the early 1970s. Japan and the Asian tigers were the biggest winners in this cycle.
Chart 1: Super-cycles – world GDP growth
Sources: Angus Maddison, IMF, Standard Chartered Research
-10% -8% -6% -4% -2% 0% 2% 4% 6% 8% 10%
1820 1836 1852 1868 1884 1900 1916 1932 1948 1964 1980 1996 2012 2028 Actual world GDP growth Average world GDP growth
1870-1913: 2.7%
1820-1870: 1.7%
1913-1946: 1.7%
1946-1973: 5.0%
1973-1999: 2.8% 2000-2030: 3.6%
India has an opportunity to regain its prominent position in the world economic order
In our view, Asia, the Middle East, parts of Africa, and Latin America all bear the characteristics of the current super-cycle, which could transform the world economy over the next few decades. Such transformations do not mean that growth will remain continuously strong over the whole period or that everything will go up all the time. The business cycle still exists, even in India and China, as do considerable short-term uncertainties across the globe.
The Super-Cycle Report projects that China is likely to overtake the US to become the world‟s biggest economy over the next decade, while India could become the world‟s third-largest economy by 2030. Moreover, India is likely to grow faster, on average, than China over the next two decades. We factor in a trend rate of growth of 6.9% for China, allowing for setbacks along the way, and of 9.3% for India, again taking into account the business cycle.
Indeed, India has many of the features that will enable it to emerge as a winner in the super-cycle. We believe the winners will be those countries which have cash, commodities, or creativity, or a combination of these factors. India does not have an abundance of cash or commodities, but it has creative potential.
This high growth path is by no means guaranteed, as there are challenges ahead which require urgent policy action. Whichever country one focuses on, the outcome depends on the interaction between policy, the fundamentals and confidence.
For India, the policy framework will be particularly important. India needs to overcome its regulatory burden and address its infrastructure needs. The initial focus, perhaps naturally, is on hard infrastructure, such as its transport system and its energy infrastructure. But its soft infrastructure is also key. There is a need for continued improvement in education, health care and skills as India provides the sizeable educated labour force needed for its private sector to grow. India‟s population is rising, and over the next 20 years the working-age population should increase by over 200mn. With half its huge population under 25, India has a demographic dividend – but only if it delivers the policies and economic growth needed. We think it will.
Table 1: Ten largest economies by decade USD trn
1990 USD trn 2000 USD trn 2010 USD trn 2020 USD trn 2030 USD trn
1 US 5.8 US 10.0 US 14.6 China 24.6 China 73.5
2 Japan 3.0 Japan 4.7 China 5.7 US 23.3 US 38.2
3 Germany 1.5 Germany 1.9 Japan 5.4 India 9.6 India 30.3
4 France 1.2 UK 1.5 Germany 3.3 Japan 6.3 Brazil 11.9
5 Italy 1.1 France 1.3 France 2.6 Germany 5.0 Japan 9.4
6 UK 1.0 China 1.2 UK 2.3 Brazil 4.9 Indonesia 9.0
7 Canada 0.6 Italy 1.1 Italy 2.0 France 3.9 Germany 8.2
8 Spain 0.5 Canada 0.7 Brazil 2.0 Russia 3.5 Mexico 6.6
9 Brazil 0.5 Brazil 0.6 Canada 1.6 UK 3.4 France 6.4
10 China 0.4 Mexico 0.6 Russia 1.5 Indonesia 3.2 UK 5.6
Sources: IMF, Standard Chartered Research
India does not have an abundance of cash or commodities, but it has creative potential
If jobs are not created, the demographic dividend could become a disaster. With this in mind, one significant development this year was India‟s announcement in its annual budget that it planned to raise manufacturing‟s share of its economy from around 16% to 25% over the next decade. This is going to be crucial for job creation.
It also fits with our longer term view that there could be an Arc of Growth stretching from China, through India and into Africa. Moreover, it is not only about India opening up and growing its domestic market, although this is a key part of the story. It is also about India becoming more open as an economy. South Asia, as a region, contains one-fifth of the world's population. Yet in terms of trade, it is a closed region relative to others across the globe. If India opens up as a trading nation – and recent signs are that it is, gradually, doing so – then just as the opening up of China has transformed East Asia in recent years, India's opening up could help transform the rest of South Asia, and boost trade with the Middle East and East Africa as well. India's dynamic economy would start to have a greater global influence.
Growth potential
India‟s growth potential is huge. This is primarily because of its strong fundamentals. One way to look at this growth driver would be to compare it with China‟s. In the rest of this report, we have deliberately avoided focusing on China versus India. So I will discuss some aspects of this comparison in this introduction. Many have sought to compare India‟s and China‟s records since Deng Xiaoping opened up the Chinese economy in 1978. To me, this is an unfair debate because India opened up its economy in 1991 and then took more than a decade to really get going. So, in some respects, India's opening up may be two decades behind that of China.
In this sense, India has tremendous potential to catch up with China and the developed world. Based on our forecasts, India‟s nominal GDP could top USD 30trn by 2030, against its current level of around USD 1.7trn. By 2030, India could be 8.4 times bigger than it is today, while China is estimated to grow 4 times bigger and the EU and US 1.7 times. These figures highlight the fact that a super-cycle, with globalisation and an open trade and financial system, can be positive for all regions, although some will grow more than others. India should be one of the relative winners.
Within India, there is often a hesitation to anticipate the ability of the economy to grow at a faster pace. Often, consensus views of India's growth potential turn out to be too pessimistic. Thus, trend growth has often been assumed to be lower than that which materialises. Perhaps this is because, on the ground, the challenges are all too apparent. Yet, despite this, the economy has continued to do well. Taking all of these factors together, our 9.3% projection for average Indian growth until 2030 may prove conservative. Trend growth, in my view, could even be nearer 12-13% per annum.
In addition to taking on board the positives, we have factored in the challenges and burdens, such as infrastructure needs, land reforms, regulation, and the environmental and social issues associated with a huge population and growing economy. India also has issues with its budget deficit, not helped by spending on populist policies as politicians try to woo the electorate. This is coming more into focus, as the attention to food, fuel and fertiliser subsidies this year has shown. Moreover, the trade deficit has always been an issue, particularly for an economy with a high import bill.
India’s opening up could help transform the rest of South Asia and boost trade with the Middle East and Africa
The key challenges are infrastructure needs, regulatory overhaul, environment and social issues
Despite all of this, a positive for India is the balance of its economy, which is crucial for growth sustainability. China‟s economy is heavily skewed towards exports and investment. This is not an issue in India. Over the past five years, the average ratio of consumption to GDP has been 70%, of which private consumption made up 59%, investment 35%, and net trade (exports minus imports) -5%. This suggests that India runs on the twin engines of consumption and investment, and this has helped the economy to emerge relatively unscathed from the recent Western financial crisis. Indeed, investment has the potential to power India‟s economy over the next decade, supported by a high saving rate, currently at 34% of GDP. In fact, in terms of investment as a share of GDP, the gap with China has been closing in recent years.
The next big plus for India is its institutional framework and its strong record in macroeconomic management. India‟s democracy, sometimes seen as a hindrance to economic development, may now start to be a real benefit. This is notwithstanding the need to address the corruption challenges highlighted over the last year. Its legal and property rights should also emerge as benefits, including the enforcement of intellectual property rights.
India has 3mn elected representatives, of which 1mn are women. The recent provincial elections, which unseated three incumbent state governments, prove that good economics can also be good politics in a democracy. The results showed that the people are now seeking policies that generate jobs for India‟s young population. In turn, this is forcing politicians to deliver change. Addressing corruption is a start. Some of the so-called „sick states‟ in India recognise the need to achieve stronger growth to alleviate poverty and deliver jobs. Bihar, with its double-digit growth in recent years, is a case in point – it has moved from a lower to a higher growth path. Greater accountability may be part of the process, along with investment and social spending, including a focus on education.
There remains a deep regional divide, with the relatively industrialised west and south of the country contrasting with the poor rural hinterland in the eastern and central regions, which is still largely dependent on agriculture and lacks good infrastructure. In fact, three western states – Karnataka, Maharashtra and Gujarat – account for more than half of the country‟s exports. The pick-up in growth rates in the poorer states in recent years indicates that a rebalancing of the regional divide is underway.
Chart 2: India’s investment is catching up with China’s Investment as % of GDP
Chart 3: China vs. India: sources of growth by sector
Annual growth in output per worker %, 1993-2004
Sources: World Bank, Standard Chartered Research Sources: Bosworth and Collins (2008), Standard Chartered Research
23ppt
4 ppt
20.0% 25.0% 30.0% 35.0% 40.0% 45.0% 50.0%
1990 1992 1995 1996 1998 2000 2002 2005 2006 2008
Agriculture Industry
Services
0 2 4 6 8 10 12
China India
India’s democracy, institutional framework and its strong record in macroeconomic management are other positives
Macroeconomic policy
India‟s macroeconomic framework, with a flexible exchange rate and an independent central bank which is free to set interest rates, is a big positive when compared with China‟s. These attributes have helped to offset long-standing concerns about India‟s high fiscal deficit and government debt. Moreover, with faster economic growth, tax collection has been rising faster than government spending, while privatisation has helped the government to keep the deficit in check.
Currently, India has an inflation challenge, and the central bank is correctly responding to this by tightening policy. But in recent years, one-way expectations, as well as the strong economy, have contributed to rising asset prices. India needs to continue to make effective use of macro-prudential measures to keep its financial sector in check. But, like many emerging economies, its policy tools and institutions held up well during the crisis.
Meanwhile, India‟s dynamic financial markets, which are some of the most liquid and sophisticated in the world, have enabled the country to absorb and accommodate large capital inflows, whether equity portfolio investment or foreign direct investment. Although its bond markets need to be deepened and broadened further, these advantages should be positive as the country seeks financing for its huge investment needs. The authorities need to view the role of foreign money and investment in a positive light as the economy opens up and the financial sector matures further.
The other key differentiators for India are what we have previously termed „perspiration‟ and „inspiration‟: more people working and spending, and the economy simultaneously moving up the value curve to higher-producing areas.
Specifically, perspiration refers to India‟s encouraging demographic dividend. India‟s working-age population will increase by 117mn over the next decade, compared with 4mn in China. In the following decade, starting in 2020, India will add 98mn to its working-age population, while China‟s will contract by 51mn. This is a big positive for India, certainly in comparison with China and many other countries. For instance, by 2020, the average age in India will be 29 years, compared with 37 in China and 48 in Japan. India also has a gender advantage over China, with a higher ratio of girls to boys in new births. India‟s relative youth and its favourable gender balance are likely to yield dividends in the coming years in terms of faster growth rates.
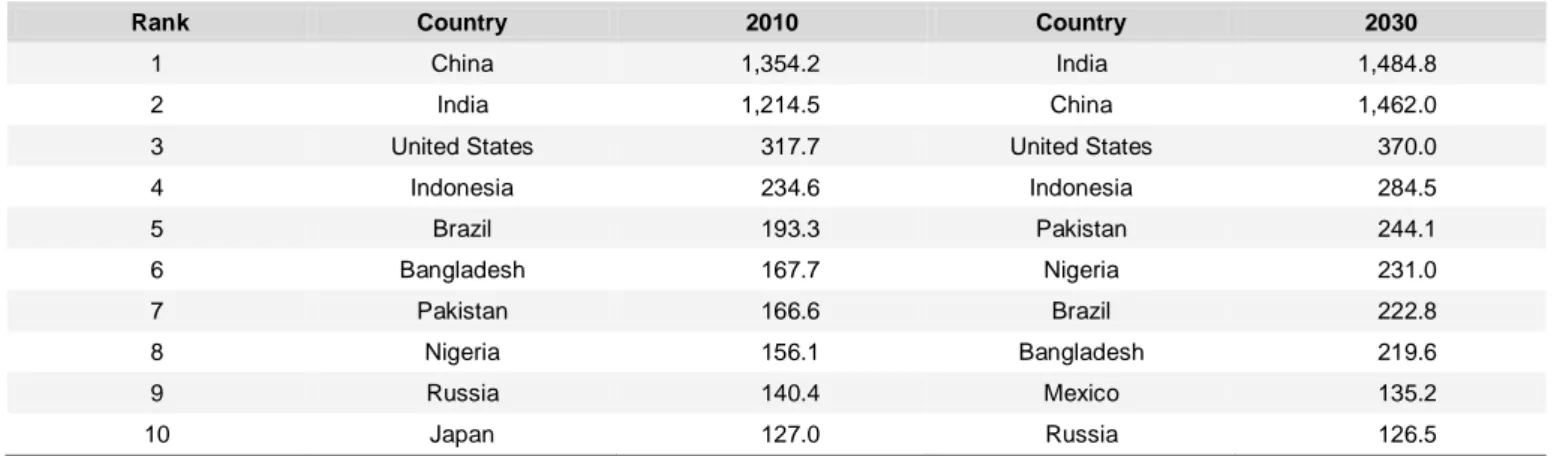
Table 2: Top 10 countries by population, million
Rank Country 2010 Country 2030
1 China 1,354.2 India 1,484.8
2 India 1,214.5 China 1,462.0
3 United States 317.7 United States 370.0
4 Indonesia 234.6 Indonesia 284.5
5 Brazil 193.3 Pakistan 244.1
6 Bangladesh 167.7 Nigeria 231.0
7 Pakistan 166.6 Brazil 222.8
8 Nigeria 156.1 Bangladesh 219.6
9 Russia 140.4 Mexico 135.2
10 Japan 127.0 Russia 126.5
Sources: UN, Standard Chartered Research
Currently, India has an inflation challenge, and the central bank is correctly responding to this by tightening policy
We expect productivity to rise rapidly as manufacturing and services employment take the place of agriculture, people move to cities, and India‟s famed entrepreneurial spirit and creativity and its growing pool of English speakers and graduates drive growth in the private sector.
A middle-income country
While it is poor now, India can become a middle-income country over the coming decade, its growing middle class driving a dynamic, domestically driven economy. This would make India an attractive market for companies to sell into, both from the West and emerging markets (EM). Consumer spending on durables is already at a tipping point. For instance, the proportion of Indian households with refrigerators stands at 18%, compared with 48% in China. The ratio for washing machine ownership is 18% in India versus 66% in China, and for television ownership it is 56% in India compared with 80% in China. The contrast in automobile ownership is more dramatic and perhaps best portrays India‟s growth potential – in the US, there are 765 cars for every 1,000 people, in China there are 128 cars, and in India, the number is only 9.
Urbanisation is likely to be another key driver of growth in India as more of its population moves from agriculture to take up manufacturing and service jobs in the cities. Last year, a report by McKinsey1 suggested that India‟s urban population
would rise from 340mn in 2008 to 590mn by 2030, and that by then, Mumbai and Delhi would be two of the world‟s five largest cities by population. Mumbai‟s economy alone would be worth USD 265bn.
The services sector is already important for India, and its share will grow further. India is already an IT superpower. Over the last decade, IT has contributed about 45% of the incremental urban employment. IT exports rose from USD 2bn in FY09 to USD 47bn in FY10. By 2020, exports could rise threefold to USD 175bn.
Furthermore, India has all the potential to move further up the value curve, with its pool of English speakers, technical education, links with Europe and North America, free-trade agreements with Asia, a head-start in IT and software, and enabling legislation. Areas talked about as potential sources of growth include tax consulting, financial services, editing and publishing, law, accountancy and design.
1India’s urban awakening: Building inclusive cities, sustaining economic growth; April 2010 Chart 4: Spending of the middle class USD bn
PPP dollars
Chart 5: Size of the middle class, mn
Daily per capita incomes of USD 10-100 in PPP terms
Sources: OECD, Standard Chartered Research Sources: OECD, Standard Chartered Research
0 10,000 20,000 30,000 40,000 50,000 60,000
2009 2020 2030
Asia Pacific Latam MENA SSA Europe North America
0 1,000 2,000 3,000 4,000 5,000 6,000 7,000 8,000
2009 2020 2030
Asia Pacific Latam MENA SSA Europe North America
We expect productivity to rise rapidly as manufacturing and services employment takes the place of agriculture
Likewise, industry has the potential to grow faster. This is likely to be driven by rising infrastructure spending, particularly in the power, road and telecom industries. More inclusive growth as purchasing power in rural areas increases, and an overall rise in per-capita income beyond inflexion points (where demand for more expensive products grows), could trigger even faster spending on consumer durables, fuelling growth in domestic industries.
Then there are the aspects of entrepreneurial spirit and creativity, which have the potential to make India a key competitor in world markets. A recent United Nations
study2 showed that the majority of global research and development (R&D) investments used to go to the OECD countries, and thus to the developed world. This is now changing, with a significant amount of corporate research and development spending going to China and India. India‟s cost advantages and growing number of science and technology graduates should make the country attractive for R&D investment.
Challenges
There are, of course, real obstacles to India achieving its potential. India‟s growth is particularly vulnerable if infrastructure investment is not rapid enough. India needs to attract foreign capital to fill the funding gap. It is estimated that USD 1trn needs to be spent on infrastructure over the next five years. Policy change is necessary to ensure the right framework for development. India‟s bureaucracy – and the corruption that often accompanies it – needs to be overhauled to make decision-making more efficient.
Public health remains an issue, and growing inequality may jeopardise future social stability. India, like the rest of the world, faces a huge resource challenge. Even with agricultural reform and investment, India will struggle to feed an increasingly affluent population, especially against a backdrop of scarce water resources. Energy demand will explode: we expect primary commercial energy consumption to grow at almost 6% a year over the next 20 years. And as energy prices rise, India will face a rapidly growing import bill.
Furthermore, India is vulnerable to high oil prices, as evidenced by its trade deficit. However, we expect its trade with the rest of the world to expand rapidly as industry gains in importance and becomes more competitive over the coming years. If India opens up as we expect, this could boost two-way trade with the rest of South Asia, East Africa and the Middle East, much as China boosted trade across East Asia. And, like China, India‟s growth should create global opportunities: it will become a big market for Western firms, as well as emerging companies from the East, to sell into.
This report goes into this unfolding story in detail. Chapter 2 provides a factsheet of key information on India. Chapter 3 provides a series of maps to help put the economy and country in perspective.
The country‟s macroeconomic structure is covered in Chapter 4, with a particular focus on the need to strike the right balance between industry and services during the super-cycle. The demographic boom is covered in Chapter 5: a growing population, rising jobs and falling dependency ratio are the drivers. The middle class and consumerism are the focus of Chapter 6, highlighting the sheer scale of the rise in incomes and the growth of the middle class.
2
UNESCO Science Report, 2010; 10 November, 2010
Industry can grow faster, driven by rising infrastructure spending, particularly in the power, road and telecom industries
India needs to attract foreign capital to fill the funding gap
India’s growth should create global opportunities: it will become a big market for Western and
Chapter 7 focuses on some of the challenging areas for India, which have the potential to be a big plus if addressed properly: education and health; employment; urbanisation; and food security.
The need to address the infrastructure challenge is the focus of Chapter 8. Linked into this, the subject of land resources is discussed in Chapter 9. Limited land resources and arcane laws make land acquisition a contentious political issue.
Above, I made reference to perspiration and inspiration. Part of the inspiration aspect is covered in Chapter 10, which looks at innovation and entrepreneurship. Chapter 11 looks at India‟s institutions, a big plus which should not be underestimated.
The need for India to integrate with the global economy through greater exports and increased capital inflows is the subject of Chapter 12. Chapter 13, meanwhile, explores the need for further financial liberalisation, with the aim to deepen and broaden India‟s financial markets in order to facilitate those inflows and efficiently channel domestic savings into infrastructure and industry.
The sustainability of India‟s growth comes into focus in Chapter 14, which looks at ways to address the contentious issues of inequality – social, economic and inter-regional. Finally, Chapter 15 explores options for India to maintain its energy security and mitigate the impact of rapid economic development on its environment.
In conclusion, India is tomorrow‟s story, and today's opportunity. Although it is important to keep the challenges in mind, India has a phenomenal opportunity to accelerate and catch up. Despite challenges, good economic fundamentals – including a growing domestic market, demographics, strong democratic institutions, a record of stable macroeconomic management, deep financial markets and a growing, more productive and creative workforce – can all ensure that India emerges a winner in the current global super-cycle.
2.
India factsheet
India is home to 17% of the global population, but covers only 2.4% of the world‟s geographical area. India has approximately 1.2bn people living in 28 states, seven Union Territories, 640 districts, 5,161 towns, 384 cities and close to 650,000 villages.
India has 50 cities with populations of more than 1mn. Cities house only 30% of the total population, but they contributed close to 63% of GDP in 2009. India‟s current urbanisation rate is significantly lower than South Korea‟s 82%, China‟s 46% and Indonesia‟s 42%. 25% of the country‟s urban dwellers live in slums.
50% of India‟s population is below 25 years old now, and the median age by 2030 will be 31, far below China‟s 42 and Japan‟s 52. India is likely to add 240mn people to its working-age population over the next two decades – almost 30% of the incremental global working-age population.
India‟s average 10-year growth rate has exceeded the global, emerging-markets, and ASEAN-5 growth rates for the past four decades.
Per-capita income in India increased from USD 100 to USD 500 over a period of 33 years (FY71-FY03), and then took only five years to double from USD 500 to USD 1,000 (FY04-FY08). India‟s middle class is likely to expand from 5-10% of the population today to 90% by 2039, according to OECD projections.
India has already become the world‟s second-fastest-growing market for automobiles, but car penetration is still very low, at 8.7 per 1,000 people.
India‟s services sector, with a 55% share of GDP, has grown faster than 10% for the last five years, contributing over 33% of exports and providing close to 25% of total employment.
India had 18.69mn internet subscribers in 2010 and close to 100mn internet users (the fourth-highest in the world). However, the penetration rate, at 8.5%, is much lower than those of China (31.6%), Brazil (34.4%), the Philippines (29.7%) and Nigeria (28.9%). According to a survey done by online auctioneer eBay, 747 rural towns in India are showing active online buying and selling trends.
The ratio of merchandise exports to GDP has climbed from 6% in FY90 to 15% now. The country has 130 operational Special Economic Zones (SEZs), which accounted for 66% of manufactured exports and 21% of IT exports in FY10.
11.4mn Indian overseas workers remitted USD 55bn in 2010, making India the world‟s largest recipient of remittance flows.
There are now 56 Indian companies on the Fortune 2,000 list, and three of the world‟s top 10 outsourcing companies are from India. India also ranks third in terms of attractiveness as a destination for FDI. Between April 2000 and February 2011, India received USD 128.7bn of FDI inflows. However, 35% of these inflows were received by one state – Maharashtra.
India has more than 26mn SMEs, which contribute 45% of industrial output and 40% of exports and employ 64mn people. Between FY03 and FY09, the total number of new companies registered rose by 170%. 57% of these companies were in emerging sectors like information technology, finance, insurance, construction and communications.
India created about 10mn jobs every year between FY00 and FY05. In the next two decades, the pace of job creation needs to rise to 13-15mn per year in order to bring the unemployment rate down to 5%.
More than eight out of 10 people currently work in the unorganised sector, either as self-employed workers (44%) or casual labourers (39%). More than 80% of India‟s females aged 15-59 are not currently in the workforce, and 40% of the country‟s population is engaged in seasonal activities with no permanent income.
India‟s literacy rate improved significantly from 48% in 1991 to 74% in 2009. However, India has a low primary enrolment rate and a high dropout rate. Also, only 2.2% of the literate population has either technical or vocational training.
In the last 60 years, India‟s life expectancy has risen from 33 to 64 years, and the infant mortality rate (IMR) has fallen from 148 to 53 per 1,000. However, the IMR is still higher than China‟s 19 and Indonesia‟s 25. Public spending on health, at 1.1% of GDP, places India in the bottom 10 in the world.
Although India has a poor ranking of 119 in the Human Development Index (HDI), it ranked 6th in terms of average annual HDI growth over the 1980-2010 period, showing substantial improvement.
India has 455mn people below the poverty threshold of USD 1.25 per day, while it has 69 billionaires (the third-highest number in the world) with wealth totalling approximately 25% of GDP.
Bihar, traditionally a laggard state, has registered more than 10% average growth in the recent past, but its per-capita income is still one-quarter that of a prosperous state like Punjab.
India‟s net sown area has stagnated at around 140mn hectares since the 1980s. Meanwhile, per-capita water availability has declined to 1,720.29 cubic metres from around 5,000 cubic metres in 1951.
With a market capitalisation of close to 85% of GDP, the Bombay Stock exchange (BSE) is the eighth-largest stock market in the world and has the largest number of listed companies (5,067).
The Indian rupee (INR) had daily average turnover (in the onshore and offshore markets combined) of USD 44.7bn in 2010, ranking 15th in terms of its share of the average daily turnover of global FX markets.
Only 2% of Indian households have a credit card, 1% invest in the equity market, and 5% hold insurance policies. Loans for housing are equal to only 6% of GDP, while loans for consumer durables and education are less than 1% of GDP.
About 12% of Indian villages have access to formal finance, although close to 40% of bank branches are in rural areas. Also 145mn Indian households are excluded from banking services. India has only 6.6 bank branches per 100,000 people, against the OECD range of 10-69. 45% of bank credit and 55% of deposits originate in the six largest cities.
India is the largest democracy in the world, with 3mn elected representatives, of which 1mn are women.
It is estimated that the central and state governments combined employ an army of about 10mn people, although only about 80,000 of them are in decision-making roles. The Indian Administrative Service, responsible for guiding the bureaucratic machinery, numbers only about 5,000.
There are over 31mn pending cases in Indian courts being handled by 14,576 judges (10.5 judges per 1mn population). It could take 320 years to clear this backlog unless the judicial process is expedited.
90% of India‟s coal deposits and 80% of its other mineral deposits are located in tribal areas. Population density in mining areas is 329 persons/square km, compared to 137 in China and 20.5 in Brazil. India‟s forest cover is now only 7.5% of its total area after close to 95,000 hectares of forest land was diverted for mining between 1980 and 2005.
3.
India: Mapping the country’s diversity
Figure 1: A political map of India Figure 2: The prosperous south and west
Source: Standard Chartered Research Sources: CEIC, Standard Chartered Research
Figure 3: Average growth rates between FY05 and FY08 Figure 4: Population density is high in parts of the north and east
Sources: RBI, Standard Chartered Research Sources: Census 2011, Standard Chartered Research
Number of people per km2
<100 100-300 300-400 400-600 >600
Max. (Bihar) 1102 Min. (Arunachal Pradesh) 17 India 368
Growth, %
<5 5-7 7-9 9-10
>10
N/A
Max. (Bihar) 11% Min. (Assam) 5% India 9%
Net state domestic product per capita (INR ’000, FY10)
<30 30-40 40-46 46-50 >50
N/A
Max. (Goa) 105.6 Min. (Bihar) 14.7
Jammu & Kashmir Himachal Pradesh
Uttarakhand Punjab
Haryana Rajasthan Gujarat
Maharashtra
Andhra Pradesh Madhya Pradesh
Uttar Pradesh
Chhattisgarh
Goa
Kerala Tamil Nadu
Delhi
Karnataka
Orissa
Arunachal Pradesh
Bihar
Assam Nagaland Manipur Mizoram Jharkhand
Meghalaya West Bengal Sikkim
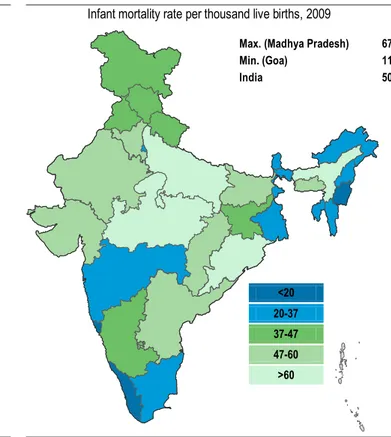
Figure 5: South and west are more literate Figure 6: Infant mortality patterns are more diverse
Sources: Census 2011, Standard Chartered Research Sources: Ministry of home affairs, Standard Chartered Research
Figure 7: Human Development Index pattern matches the income profile of states
Figure 8: Income inequality is lower in poorer states
Sources: Govt. of Meghalaya, Standard Chartered Research Sources: Planning Commission, Standard Chartered Research
Gini coefficient of rural income for FY05
<0.20 0.20-0.23 0.23-0.25 0.25-0.28 >0.28
N/A
Max. (Haryana) 0.31 Min. (Assam , Bihar) 0.17 India 0.25
HDI for 2005
<0.45 0.45-0.55 0.55-0.65 0.65-0.75 >0.75
Max. (Kerala) 0.81 Min. (Bihar) 0.44 India 0.58
Infant mortality rate per thousand live births, 2009
<20 20-37 37-47 47-60 >60
Max. (Madhya Pradesh) 67 Min. (Goa) 11 India 50
Literacy rate, %, FY11
<68 68-75 75-80 80-87 >87
Figure 9: Forest cover is concentrated in central region Figure 10: Northern and western river basins are better irrigated
Sources: Forest survey of India, Standard Chartered Research Sources: Department of Agriculture and Cooperation, Standard Chartered Research
Figure 11: Productivity pattern matches irrigation potential
Figure 12: Unemployment does not correlate with affluence levels
Sources: Department of Agriculture and Cooperation, Standard Chartered Research
Sources: Employment Survey 2009-10, Standard Chartered Research
Unemployment rate (%), FY10
<5 5-9 9-11 11-15
>15
N/A
Max. (Goa) 28.1 Min. (Karnataka) 2.9 India 9.4
9.4
Yield, kg/hectare, FY10
<1000 1000-1500 1500-2200 2200-2700 >2700
Max. (Punjab) 4,148 Min. (Rajasthan) 890 India 1,798
Area under irrigation as % of total cropped area, FY08
<25 25-40 40-50 50-60 >60
N/A
Max. (Punjab) 98 Min. (Assam) 3.4 India 46.8
As % of geographical area, 2007
<10 10-25 25-45 45-60 >60
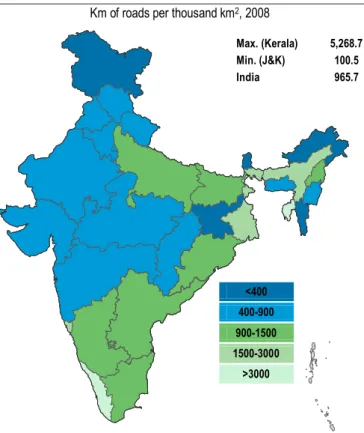
Figure 13: Northern, western and central India lag in road connectivity
Figure 14: Power availability is a precondition for economic success
Sources: MOSPI, Standard Chartered Research Sources: Ministry of Power, Standard Chartered Research
Figure 15: Mineral availability is concentrated in the eastern region
Figure 16: Teledensity is rapidly increasing
Sources: Indian Bureau of mines, Standard Chartered Research Sources: TRAI, Standard Chartered Research
Number of telephones as % of population, 2010
<40 40-50 50-70 70-90 >90
N/A
Max. (Himachal Pradesh) 105% Min. (Assam) 36% India 66%
Number of reporting mines per 10,000 km2, FY09
<5 5-10 10-20 20-50 >50
N/A
Max. (Goa) 205.3 Min. (J&K) 0.5 India 9.1
Installed capacity, watts per capita, end-FY11
<60 60-100 100-170 170-210 >210
Max. (Himachal Pradesh) 339.3 Min. (Bihar) 18.5 India 143.5
Km of roads per thousand km2, 2008
<400 400-900 900-1500 1500-3000
>3000
Figure 17: Extremely low penetration of cars Figure 18: Eastern India lacks adequate power supply
Sources: Office of State Transport Commissioners, Standard Chartered Research
Sources: NFHS 2007, Standard Chartered Research
Figure 19: Banking penetration is higher in richer states Figure 20: Southern states have managed debt better
Sources: RBI, Standard Chartered Research Sources: RBI, Standard Chartered Research
State debt as % of NSDP, FY11 (BE)
<20 20-30 30-40 40-60 >60
Max. (Mizoram) 98.1 Min. (Chhattisgarh) 18 All states 23.1
Average population per bank branch (’000), March 2009
<8 8-12 12-17 17-21 >21
Max. (Manipur) 33 Min .(Goa) 4 India 15
% of households with electricity
<60 60-70 70-80 80-90 >90
Max. (Himachal Pradesh) 98.4 Min. (Bihar) 27.7 India 67.9
Passenger cars per 1,000 people, end-FY07
<3 3-7 7-12 12-20
>20
4.
Macroeconomic structure: Striking the right balance
India will need to strike the right balance between industry and services growth during the super-cycle
Infrastructure build-up is likely to push investment rate to 40%, balancing consumption
Flexible market rates and prudential policies are key to sustaining macro stability
India‟s economy has undergone a structural change since the economic reforms introduced in the early 1990s. Agriculture as a share of GDP has fallen to 15% from 32% in 1990, while the services sector has grown to 57% from 43%. However, industry‟s share of GDP has remained constant in the 25-28% range, and employment remains lopsided, with 57% of the workforce engaged in agricultural activities and just 13% in industry (the rest are in services).
Although the share of industry has remained stagnant, capital-intensive products, which are higher up the value chain, have started to dominate. In FY11, more than 50% of India‟s industrial growth came from the production of machinery and transport equipment. It is important to sustain growth in these high-value items to achieve the government‟s target of increasing the GDP share of manufacturing from 16% to 25%, with a larger share for the organised sector. At the same time, the expected demographic trends of the next two decades suggest that India‟s cheap labour advantage will not fade anytime soon. Labour-intensive industries such as textiles and food processing can also flourish if appropriate reforms usher in labour-market flexibility. This will be necessary to keep the unemployment rate low in an economy with a rapidly expanding workforce. The services sector, which recorded growth of more than 10% between FY06 and FY10, is well diversified. Information technology and communication – the two services which have brought India global recognition – make up just 14% of the overall services sector. This diversification increases the resilience of services-sector growth.
Looking at GDP growth from the demand side, we believe India is on its way to achieving the right balance between consumption and investment, which will ensure that growth is driven by two engines. India‟s investment-to-GDP ratio was languishing at just above 20% when the country embarked on economic reforms in the early 1990s. However, in the last 20 years, India has achieved average investment growth
Chart 1: Services dominate, industry’s share stagnates % of GDP
Chart 2: A diversified mix of services % share of India’s overall services sector
Sources: CEIC, Standard Chartered Research Sources: Economic Survey FY11, Standard Chartered Research
Agriculture Industry
Services
0% 10% 20% 30% 40% 50% 60% 70%
1950s 1960s 1970s 1980s 1990s 2000s
2% 3%
10% 10% 11% 11% 11%
15%
27%
Hotels Communication Banking & insurance Real estate and other …
Transport IT& ITES Public admin & defence Others Trade
Increasing the share of organised manufacturing is imperative to achieving a better balance between industry and services
of close to 11% p.a., and the investment-to-GDP ratio has risen to 35%. The emergence of the private sector as a dominant player in the economy (real private investment grew at an annual rate of 28% between FY02 and FY07) has contributed strongly to this investment growth. We believe this trend is likely to continue, with an emphasis on infrastructure investment and better exploitation of the complementarities between public and private investment. However, a larger share for the private sector would induce more cyclicality in the growth process. In our view, a 40% investment-to-GDP ratio would provide the right macroeconomic balance. Domestic savings have grown hand in hand with investment, and the need for external finance has generally been limited to less than 3% of GDP, reducing India‟s exposure to volatile capital flows.
Domestic demand is still the dominant component of GDP, but the gradual opening of the economy has pushed up the ratio of exports (including software exports) to GDP from 7% in FY90 to 20% now. Strong import demand has generally overshadowed exports, but net exports contributed positively to economic growth in FY10. Capital-intensive exports like engineering goods and refined petroleum products now dominate India‟s exports. Maintaining export momentum is critical to limiting the vulnerability created by rising imports and to providing an additional driver of industrial growth.
Macro and financial stability also depend on policies set by the central bank and government. Flexible exchange and interest rates in the post-reform era have left the economy less prone to asset-price bubbles, even as the capital account has gradually been opened up. The Reserve Bank of India (RBI), as an independent central bank, has demonstrated its ability to steer the economy through cycles and the global financial crisis. Fiscal consolidation was achieved before the crisis, when the deficit was narrowed to 2.5% of GDP. Fiscal stimulus is now being gradually withdrawn, and the government‟s resolve to stick to its fiscal consolidation roadmap augurs well for India. However, there is no room for complacency, as close to two-thirds of government spending is still for unproductive purposes. We believe that a balanced macro structure, if accompanied by prudent macro-management policies, will play a key role in sustaining India‟s high growth rates over the current super-cycle.
Chart 3: Investment growth powers ahead % y/y, average for the period
Chart 4: Gradual opening up of the economy % of GDP
Sources: CEIC, Standard Chartered Research Sources: Economic Survey FY11, Standard Chartered Research
1990-2000
2000-08
-20% -10% 0% 10% 20%
India Russia China Japan SSA MENA Indonesia LATAM Brazil Korea Euro Area US
0% 5% 10% 15% 20% 25% 30% 35%
0% 10% 20% 30% 40% 50% 60%
FY 91 FY 95 FY 99 FY 03 FY 07 FY 11
Exports Imports
Exports + Imports (LHS)
5.
Demographics: Young and vibrant
Growing working-age population, lower dependency ratio are driving the demographic boom
India to contribute 28-30% of the world’s incremental working-age population in the next two decades
Population growth is concentrated in less developed states; policies are needed to unleash the
demographic dividend
One factor driving the current super-cycle is the vast number of people in emerging countries entering the global workforce. India, which is expected to add 162mn and 136mn people to its population in the decades to 2020 and 2030, respectively – equivalent to two Japans or one Indonesia – is likely to emerge as a winner in this super-cycle. India is likely to overtake China as the world‟s most populous country by 2021, according to UN estimates.
However, India‟s chance to become a superpower is not defined only by the massive scale of its population growth. In fact, India has added more people (170-180mn) in each of the past two decades than it is expected to add in the coming two decades. This time, however, various other factors are likely to turn the population boom into a true opportunity to boost economic growth.
First, India‟s population growth is likely to come against the backdrop of slowing growth in the world population (projected at 0.85% in the decade to 2030, versus 1.2% in the decade to 2010). Second, the current boom is likely to be concentrated in the working-age group (aged 15-59); while this was also the case in previous decades, this age group is estimated to contribute 75-80% of the current increase in India‟s population, up from 60-70% in past decades. As a result, India‟s estimated median age of 31 by 2030 is far below China‟s 42 and Japan‟s 52. These two factors together imply that about 28% and 30% of the global working-age population added in the decades to 2020 and 2030, respectively, will be from India. This is significantly higher than India‟s share of c.22% in the past two decades, and underlines the potential earning opportunity for the economy.
Chart 1: Surging working-age population mn
Chart 2: Falling dependency ratio
Sources: United Nations, Standard Chartered Research Sources: United Nations, Standard Chartered Research
0-14 15-59 60 and above
0 400 800 1,200 1,600
1990 2000 2010 2020 2030
0% 30% 60% 90%
1960 1970 1980 1990 2000 2010 2020 2030 2040
A third element of the current boom is that a falling birth rate is likely to subtract 13mn children (aged 0-14) from India‟s population during the period from 2020 to 2030, while the addition in the decade to 2020 will be negligible. This is extremely important, as it implies less time required for child care and increases the probability of higher female participation in the labour force. Since females will account for an estimated c.50% of the increase in the working-age population over this 20-year period, their participation in the workforce will be crucial if India is to reap the benefits of the demographic dividend. The latest statistics indicate that more than 80% of India‟s females aged 15-59 are not currently in the labour force. While factors like the policy environment and inadequate education and health care probably contributed to the low participation rate, child-care demands were also a key deterrent. India added 40-50mn children between 1990 and 2010. The falling number of children is also expected to reduce India‟s dependency ratio (the ratio of non-working population to working population) from 0.55 in 2010 to 0.47 by 2030, despite an increase in the older population.
This convergence of factors – a surge in the working-age group and a lower dependency ratio – should increase savings, not just because more adults are earning but also because they have to spend less on dependents. This will eventually boost growth. India‟s growing labour pool is also likely to attract more inward investment seeking to benefit from a large consumer market and the accompanying economies of scale. We discuss some of these opportunities later in this report.
However, no opportunity comes without challenges, and India needs to adopt the right policies – in education, health care and other areas – to maximise this window of opportunity. More importantly, these policies will have to focus on reducing socioeconomic inequalities between states. This is because population growth, especially the working-age group, will come largely from the least developed states, commonly known as the BIMAROU or „sick states‟. According to India‟s 2001 census, the eight BIMAROU states are expected to account for 49% and 63% of the population increases during the five-year periods to 2011 and 2026, respectively. The median age in most of the BIMAROU states will also be lower than the national average of 31 by 2026. Uttar Pradesh will remain the most populous state, with a median age of 26 – significantly below the national average of 31 and the median age of 37 for the more developed southern states of Kerala and Tamil Nadu. Since the BIMAROU states rank low in terms of health and education indicators, a focus on these regions will be extremely important.
Chart 3: Growing share of the global workforce % share of incremental world population aged 15-59
Chart 4: ‘Sick states’ drive opportunities
% contribution to India’s incremental working-age population
Sources: United Nations, Standard Chartered Research Sources: GoI, Standard Chartered Research
China
India
-40 -20 0 20 40
1990 2000 2010 2020 2030 2040
2011 2026
0 5 10 15 20 25 30 35
Punjab Orissa Delhi+ Haryana Gujarat W. Bengal Rajasthan MP Southern states Maharashtra Bihar UP
India is likely to be the most populous country by the early 2020s, driven by rapid growth in the working-age population
6.
Middle class and consumerism: Affordability and aspirations
A five-fold increase in per-capita income by 2030 will give rise to a huge middle class
The breach of important income thresholds is likely to unleash huge consumer spending
Our estimates indicate a USD 15trn opportunity as Indian consumers spend more
We estimate that India‟s real annual per-capita income will increase five-fold to about USD 5,500 by 2030 (USD 20,500 in nominal terms). This is phenomenal both in an absolute sense and in terms of its economic implications.
First, it will give rise to a huge middle class. According to the OECD, India‟s middle class (defined as those with per-capita incomes of USD 10-100 a day) will expand from 5-10% of the population today to 90% in 2039. In other words, India will have added 1bn people – almost its entire current population – to the middle class.
Second, rising incomes will create inflexion points for various products and services as previously unattainable purchases become necessities. Both of these developments are likely to unleash a substantial shift in consumer spending and consumption patterns over the next two decades.
The past few decades provide a preview of what lies ahead. As India‟s real annual per-capita GDP growth more than doubled to a CAGR of 5% in the 2000s from the 2% rate witnessed until the 1980s, real household spending shot up, giving rise to a consumer boom (see Chart 2). In nominal terms, the rise in per-capita income to USD 1,000 by FY08 – doubling in a short timeframe of five years – defined an inflexion point as households allocated a larger share of their spending to higher-quality non-food items. The share of spending on such products has risen from 42% in the early 1990s to close to 65% today, especially as consumers spend more on services like transportation and personal care products.
Chart 1: India’s burgeoning middle class
Shares of global middle-class consumption, 2000-50
Chart 2: Rapid increase in consumption as incomes rise %
Sources: OECD, Standard Chartered Research Sources: RBI, Standard Chartered Research
China India
Japan US EU Others
0% 20% 40% 60% 80% 100%
2000 2010 2020 2030 2040 2050
0 1 2 3 4 5 6
1960 1970 1980 1990 2000 2010
By 2039, India will add about 1bn people to its middle class as
per-capita income increases
This process is likely to accelerate in the next two decades. We estimate a USD 11trn market for non-food-related products and services as their share of consumption increases to 70% from the current 65% (we estimate total consumption at USD 15trn by 2030). India‟s current expenditure on food, at 35% of total spending, is higher than those of Brazil (19%) and the US (15%).
Consumer products and services are set to benefit from this shift in spending patterns. For example, automobiles, for which India is the world‟s second-fastest-growing market, could see 50-fold growth, creating close to a USD 300bn opportunity. Similarly, as female participation in the workforce increases, dependence on home appliances such as washing machines and microwave ovens is set to rise significantly. Replacement demand for such products is also expected to boost the size of the home-appliance market to more than USD 100bn in the next 20 years. For instance, while almost 90% of Indian households own a television, consumers have strong aspirations for the latest products, such as LCD TVs.
Education and health services are key enablers and beneficiaries of the demographic boom, and are expected to witness significant growth. We estimate that each of these markets can grow to 30 times its current size and be worth close to USD 750bn by 2030.
Similarly, household expenditure on financial services may explode to USD 450bn from USD 10bn currently. Credit card penetration remains low, at 2%, and only 5% of households have their financial savings parked in insurance policies, according to a survey by NCAER, an economic think tank. Another 65% of financial savings are kept in bank deposits, while households keep another 20% of such savings at home in order to have them readily available at times of need. The remaining 10% of financial savings are parked in various other products, such as postal saving schemes. Demand for housing and consumer loans has increased since the 2000s, but is also likely to witness further exponential growth. The development of such financial services will further fuel the super-cycle as financial leverage in the economy rises. Finally, while the share of expenditure on food will decline, India‟s food market – especially for packaged food and beverages – will still offer a USD 4trn opportunity for investors by 2030, more than double the size of the Indian economy today.
Chart 3: Bubbly consumerism (USD bn)
Sources: Euromonitor, Standard Chartered Research
Food + beverage
Health + education
Transport
Communication
Insurance + financial services
Household appliances
-1,000 0 1,000 2,000 3,000 4,000 5,000
2005 2010 2015 2020 2025 2030 2035
Expenditure on food products, especially packaged foods, represents a USD 4trn opportunity
by 2030 A USD 11trn market for non-food
7.
The challenges of making every head count
a. Education and health: Nourishing body and mind
Providing education and health care to the large additional population is an enormous challenge
Policy commitment is needed via increased public spending, better regulatory framework
Private sector is likely to dominate the space as public spending falls short of high demand
While the boom in its working-age population gives India a competitive edge, the challenge of educating and providing health services to this population is equally large. Insufficient efforts to nurture the young population could result in another missed opportunity, while the right focus on education and health – known as the enablers – could propel India to the forefront of the global economy and secure its role as a superpower in the years ahead. Below, we discuss issues related to education and health, and the challenges India must overcome to unleash its demographic dividend.
Education
India will have an additional 166mn3 people attending schools and colleges at various levels over the next two decades. This is close to the total number of people India will add to its population in the 2020s, or equivalent to educating an entire Japan. It is important to understand that much of the challenge emanates from the inadequate level of education which exists today.
The dimensions of India‟s education problem vary across different levels of the education system. At the primary level, the enrolment rate has improved substantially, but there is an urgent need to address issues like the high drop-out rate and teacher absenteeism (only 37.5% of India‟s schoolteachers are present and actively teaching on any given day, according to a study by the Harvard University and the World Bank). Otherwise, the recently introduced Right to Education Act will not serve its intended purpose. Similarly, the 60% enrolment rate at the secondary level is inferior to India's competitors in East Asia (70%) and Latin America (82%). If the enrolment rate is increased to 75% by 2030, as the government envisions, an additional 50mn people will have to be educated at the secondary level. In higher education, an increase in the enrolment rate from the present 14% to the global average of 26% will
3
Based on education in India , 2007-08: Participation and expenditure, United Nations population projection Chart 1: The demographic boom and challenge
Mn people, over the two decades to the ending year
Chart 2: Majority of the labour force is less educated %
Sources: United Nations, Standard Chartered Research Sources: NSEUS, Standard Chartered Research
2010
2030
0 100 200 300 400
Chg in total pop. Chg in wrkg pop. Of which females Additional no. of ppl
to be educated
Illiterate Primary Secondary
Grads
0 20 40 60
1983 1993-94 2004-05 2007-08
require creating the capacity for an additional 40mn people by 2030. The World Bank estimates that India will surpass the US and China to have the world‟s largest population of 15 to 65-year-olds with tertiary education by 2020. Public-private partnerships in education need to flourish in order for this to happen. Only 83 of India‟s 600 universities are currently private (some of the 130 so-called „deemed‟ universities may also be private). This number is still low compared to the demand for education. The education minister estimates that in order to double enrolment in higher education by 2020, India will need another 1,000 universities and more than 40,000 new colleges (up from about 30,000 now). Constraints on private-sector and foreign players setting up educational institutions need to be removed.
Many businesses in India have described skill shortages as an obstacle. According to the latest available data, 97.8% of India‟s literate population has general (non-technical) education, while only 1.9% has technical education and 0.3% has vocational education. Meanwhile, only 5% of those aged 19-24 have received any vocational training, leaving them without identifiable skill sets. While there are 12.8mn new entrants to the workforce every year, the country has the capacity to train 3.1mn people annually, highlighting the wide gap between supply and demand. Some private studies estimate that India will require an additional 700,000 doctors by 2026, but it trains only 17,000 doctors annually. Although close to 400,000 engineers are produced every year, there are questions surrounding their immediate employability. The National Skill Development Mission is actively seeking ways to enhance skill sets. If the knowledge of English that Indians generally possess can be combined with good vocational training and improved quality of education, Indian workers will not only succeed in domestic industries but could also be increasingly valuable resources in the global market. This is evident from Chart 3.
For this to happen, public spending on education – currently at 3% of GDP, versus the 4.5% average for middle-income countries – needs to rise to 6%. Though the India Planning Commission recommended doubling investment in education in 2002, little progress has been made towards this goal. Even if this is pursued over the next two decades, and the government spends c.USD 3trn and USD 12trn on education in the decades to 2020 and 2030, respectively, it is likely to fall short of the required investment – especially to educate the surging population in the 15-24 age group. Increased private participation in the education sector will therefore be necessary. In addition, the perceived quality difference between public and private institutions is likely to create demand for privately sponsored education in urban and rural centres.
Chart 3: Better education increases earning potential Marginal increase in earnings with incremental levels of education (males, %)
Chart 4: Public spending on education should increase % of GDP
Source: World Bank Sources: WDI, Standard Chartered Research
1984 1988 1994
2000
2004
0 5 10 15 20 25
Primary Middle Secondary Higher Tertiary
2.00 2.50 3.00 3.50 4.00
2005 2006 2007 2008 2009 2010
The quality of education and skill development need to be emphasised
Health care
India‟s health parameters have improved. Life expectancy has risen from 33 to 64 years in the last 60 years. The infant mortality rate has fallen from 148 to 53 per 1,000 over the same period. The crude birth rate has declined from 41 to 25, and the crude death rate has fallen from 25 to below 9. Despite these achievements, India still ranks very low compared to its peers. For instance, India‟s infant mortality rate of 53 is significantly higher than China‟s 19 and Indonesia‟s 25.
Health parameters are also uneven across the country. For instance, while poorer states like Bihar and Uttar Pradesh have high infant mortality rates of 56 and 67, respectively, Kerala‟s rate of 12 is comparable to developed economies. Similarly, the range of health services varies – private medical centres in large cities offer world-class facilities at affordable prices (leading to a boom in medical tourism), while rural areas face acute shortages of doctors and hospitals.
Low per-capita public spending on health is partly to blame for the current state of India‟s health services. At 1.1% of GDP, India‟s public spending on health placed it in the bottom 10 in the world in 2007, according to the World Bank‟s latest World Development Indicators. On this measure, India ranked better than economies like Côte d‟lvoire and Guinea, and ranked below its less developed neighbour, Bangladesh. The private sector still accounts for close to 80% of the country‟s health spending. Though the private sector is generally perceived to offer better health services, the lack of effective state regulation and oversight can lead to problems like overtreatment and unreasonable costs. Also, only 16% of India‟s labour force is in the organised sector; the informal sector, with no access to benefits such as medical insurance, often goes without badly needed health care.
As in the education field, a policy commitment to universal access to health care, especially in rural areas and with a focus on women and children, is necessary. Public spending has to be increased to the upper-middle-income economy average of 3.4% of GDP, while the private sector must play a growing role in a better-regulated framework. With increased urbanisation and changing lifestyles, rates of lifestyle diseases such as those related to stress are likely to rise, and India needs to prepare for this. While the initial costs of providing health services might outweigh the benefits, a virtuous cycle of health and growth should eventually kick in.
Chart 5: Total health spending as a share of GDP is low % of GDP
Chart 6: Private spending drives health expenditure % of total spending on health care
Source: World Bank Sources: NCEUS, Standard Chartered Research
0 4 8 12 16
US Germany South Africa UK Japan Korea China India
0 20 40 60 80
Pvt household State govt. Central govt. Private firms External aid Local govt.
Health parameters are improving, but delivery of health services varies across the country