This is the accepted version of the manuscript:
S.Phabmixay, C., Rodríguez-Escudero, A.I. y Rodríguez Pinto, J. (2019). “Benefits from the standardization of the complaint management system”. Total Quality Management & Business Excellence. https://doi.org/10.1080/14783363.2019.1633295.
Benefits from the Standardization of the Complaint Management System
Chanthaly S.Phabmixay1, Ana Isabel Rodríguez-Escudero2 and Javier Rodríguez-Pinto3,*
Department of Business Management and Marketing, University of Valladolid, Valladolid, Spain
1 Chanthaly S.Phabmixay
Facultad de Comercio, Plaza Campus Universitario 1, 47011 Valladolid (Spain) Email: [email protected]
ORCID ID: 0000-0003-4070-0821 2 Ana Isabel Rodríguez-Escudero
Facultad de Ciencias Económicas y Empresariales, Avda. Valle Esgueva 6, 47011 Valladolid (Spain)
Email: [email protected]
ORCID ID: 0000-0002-8827-5353 3 Javier Rodríguez-Pinto
Facultad de Ciencias Económicas y Empresariales, Avda. Valle Esgueva 6, 47011 Valladolid (Spain)
Email: [email protected] ORCID ID: 0000-0002-9774-3171
* Corresponding author: Javier Rodríguez-Pinto
Facultad de Ciencias Económicas y Empresariales, Avda. Valle Esgueva 6, 47011 Valladolid (Spain)
Email: [email protected] Telephone: +34983184569 Fax: +34983423899
Benefits from the Standardization of the Complaint Management System
This research provides new developments in the conceptualization of the complaint
management system by examining the benefits of the standardization of the complaint
management process. In line with a mechanistic approach of organizational behaviour,
we posit that standardization of complaint handling can help to overcome defensive
behaviour by employees and managers, who can view receiving complaints as a
decidedly negative experience. Specifically, we investigate the influence of three types
of guidelines —procedural, behavioural, and outcome— on achieving fairer solutions
for customers and, consequently, greater satisfaction with the system. The model
proposed in the present research is tested considering the managers’ perspective and
using data from a representative sample of manufacturing companies covering multiple
industries. Our findings provide novel and interesting insights on the factors to which
managers in manufacturing firms should pay closer attention when designing an
effective complaint management system. All three types of guidelines help to explain
perception of justice in the solution of complaints and, thus, customer satisfaction, but
important differences exist for the different types of guidelines and their corresponding
dimensions.
Keywords: complaint management system; customer satisfaction; perceived justice;
standardization; complaint handling guidelines
Introduction
Until recent decades, complaint management has not been an organizational area of special
interest, neither in the academic nor in the business. However, as markets mature and become
increasingly competitive, traditional objectives of offensive marketing, such as attracting new
customers and promoting brand change, are becoming harder to achieve. Consequently,
companies are motivated to be more purposeful in adopting a defensive commercial strategy
that contributes to customer retention. An effective complaint management system is an
complaint management system (Goodwin & Ross 1992, Tax, Brown & Chandrashekaran,
1998, Smith, Bolton & Wagner, 1999) and although firms continue to invest in technology,
call centres, and staff training (Grainer, Noble, Bitner, & Broetzmann, 2015), many
organizations fail to manage complaints in a way that meets the consumers’ expectations
(Van Vaerenbergh & Orsingher, 2016).
This lack of effectiveness in complaint management systems is to a large extent
explained by the employees’ and managers’ defence mechanisms, which cause them to view
complaints as an uncomfortable complication rather than an opportunity (Homburg & Fürst,
2007). Companies commonly seek to psychologically distance themselves from the
complaint process. As a result, they do not clearly communicate to their customers where,
how, and to whom they can complain and do not identify the true reasons for complaints or
analyse complaints data to detect opportunities for improvement. As such, employees’ and
managers’ defensive behaviour creates barriers to the development of an efficient complaint
management system.
We propose that one way to overcome this defensive behaviour is to normalise or
standardize the complaint handling. The theoretical foundations of our research are in line
with the mechanistic approach of organizational behaviour. This approach indicates that a
company can improve the behaviour of its members by implementing standards and
normalized operating procedures that guide their decisions and actions in line with the
organization's objectives (March & Simon, 1993). Establishing clear guidelines can help
employees to act in a more disciplined way and improve their attention to the activities they
must carry out on a day-to-day basis (Chebat & Kollias, 2000).
We research how the standardization of the complaint management system
we identify and classify the various actions and stages in the complaint handling process to
determine whether standardisation can contribute to positive complaint resolution. Although
prior literature primarily analyses specific behaviours such as facilitation (Goodwin & Ross,
1992; Davidow, 2000), punctuality (Morris, 1988; Conlon & Murray, 1996), personal
attention, apology (Smith at al., 1999) or compensation (Davidow, 2000; Estelami, 2000),
previous studies do not comprehensively examine all company actions. Table 1 shows that
literature on complaint management has addressed certain variables to a considerable extent
(e.g., facilitation, timeliness, attentiveness, apology or redress), while ignored or paid too
little attention to other variables such as customer participation in the complaint handling
process or in the solution. We thus advance knowledge on complaint management by
investigating the effect of standardisation throughout the entire complaint handling process.
Second, in our study the proposed model is tested on a representative sample of
manufacturing companies covering multiple industries. Such an approach is yet to figure
prominently in complaint handling research, which is mainly based on specific industries and
the service sector (Vos, Huitema, & De Lange-Ros, 2008). The inseparability of production
and consumption and the greater likelihood of heterogeneity in the provision of services may
explain why most research studies have been conducted in service industries. In the area of
manufacturing companies, however, far less scholarly research has been conducted into
complaint management, despite the fact that for manufacturers of industrial products and
consumer products alike, it might be of great interest. In the former case, this is because
industrial customers often need a product tailored to their business, which leads to greater
diversity in the sales and production processes, in turn increasing the likelihood of failure as
it is more difficult to guarantee consistent quality. In the case of consumer product
(Anderson & Narus, 1990) and, therefore, loose control and are not directly aware of the “voice of end user”.
Third, we contribute to the literature by examining the effect of standardising the
complaint process from the perspective of managers, not consumers. Table 1 shows that most
prior literature focuses on the perspective of consumers. Apart from two notable exceptions
(Homburg & Fürst, 2005; Homburg, Fürst, & Koschate, 2010), research into complaint
handling has mainly been conducted considering the customer perspective only. A consumer
can only assess the response the company has given to her/his particular complaint, so she/he
will only have an opinion about those aspects of the complaint handling which were relevant
in her/his particular case. For instance, there might be cases in which it is not necessary to
discuss with the customer which is the best solution because it is obvious. The managers’
viewpoint is therefore fundamental so as to make a comprehensive evaluation of the
relevance of all the behaviours, actions and stages in the complaint process.
[Table 1 about here]
In sum, taking the above-mentioned contributions as a reference, in this research we
first aim to expand current knowledge on complaint handling by outlining a theoretical model
which reflects the importance of considering the effect of standardisation throughout the
whole complaint handling process. In other words, we seek to address the lack of attention in
prior literature concerning variables that might prove relevant to consumer satisfaction, such
as participation in the process and in the solution. In addition to this theoretical approach,
other key issues the work seeks to deal with involve testing the proposed model in a
representative sample of manufacturers from a range of industries and doing so from the
on complaints management, which has thus far primarily concerned itself with exploring said
phenomenon in service companies and from the standpoint of the consumer.
Theoretical Framework
As previous discussed, a mechanistic approach suggests that the formalisation of a
management structure allows for the clear delineation of tasks, responsibilities, guidelines,
and schedules to achieve an effective functioning of the organization (Simon, 1997). Applied
to complaint management system field, mechanistic approach involves establishing a formal
structure for handling of complaints to achieve fair and fast solutions for the customer.
According to Homburg and Fürst (2005), such guidelines can be systematised into three
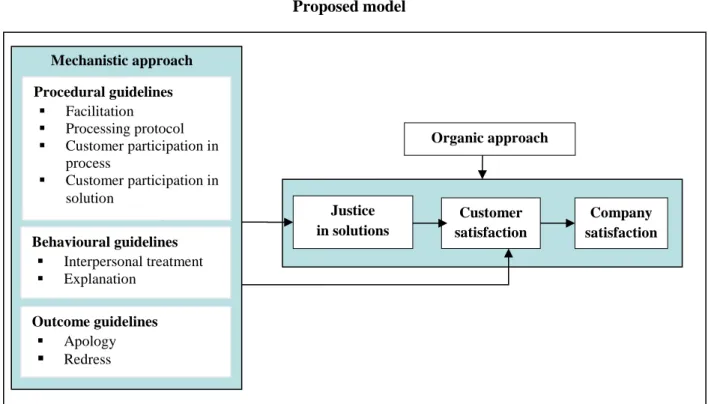
groups: procedural, behavioural and outcome guidelines. Figure 1 illustrates the model.
First, procedural guidelines are defined as the formal organizational structure for
recording and processing complaints in a way that is consistent with customers’ needs. We
understand that these standards range from the availability of different channels for receiving
complaints, processing protocol, and possible customer intervention in the complaint process
and resolution. Therefore, we consider four types of procedural guidelines: facilitation,
processing protocol, customer participation in the process, and customer participation in the
solution. We define behavioural guidelines as those that guide employee interactions with
customers to use appropriate interpersonal skills and provide relevant information about the
complaint. Based on this definition, we consider two dimensions: interpersonal treatment and
level of explanation that company gives to customer. The third block is related to the
outcome guidelines, which are defined as the tangible and intangible (psychological)
compensation the company provides to the customer to remedy the damage caused. The company’s explanation, following the appropriate behavioural guidelines, may be insufficient
redress such as the repair work, change, discount, or reimbursement (Kelley, Hoffman, &
Davis, 1993) in addition to an apology may be necessary to achieve resolution. Thus, we
consider two types of outcome guidelines: apology and redress.
Following the mechanistic approach, these guidelines influence the results of the
complaint process. Prior literature widely uses the perceived justice in solution of complaints
as a variable to determine the effectiveness of corporate responses to customer complaints
and as an antecedent to other relevant variables such as repurchase intentions and word of
mouth (Conlon & Murray, 1996; Orshinger, Valentini, & Angelis, 2010). In this study,
justice in solution of complaints construct refers to the justice perceived by customer as a
global assessment of the solution provided by the company to solve the problem.
Furthermore, because the literature finds that greater perception of justice leads to greater
customer satisfaction (Chao & Cheng, 2017), we include a company satisfaction variable,
which is the final result of establishing a good complaint management system (see Figure 1).
In sum, we develop and test a model, first, to determine whether the standardization of the complaint management system influences customers’ perception of justice in the
solution and, consequently, in their satisfaction with the system, which ultimately leads to
greater company satisfaction. Second, we examine the relevance of each guideline type
(procedural, behavioural, and outcome) in explaining the fairness of solutions. Some of these
guidelines, although necessary for organizational purposes, may not be a specific source of
consumer satisfaction but, instead, may be merely a necessary condition.
Along with the main relationships, Figure 1 shows the direct effects of the
mechanistic approach on customer satisfaction as control relationships. That is, we
investigate what types of norms are a source of satisfaction beyond the customer’s perception
results of the complaint management system. The organic approach is based on the creation
of a supportive climate which fosters greater commitment to satisfying customer needs, and leads to a better alignment of employees’ motivations and behaviours with the internal and
external demands. The inclusion of this control relationship allows us to determine the extent
to which the mechanistic explanation maintains its relevance in the presence of this variable.
[Figure 1 about here]
Hypotheses Development
Benefits from Procedural Guidelines
Within procedural guidelines, facilitation refers to the policies, procedures, and structure that
a company establishes to simplify the process of filing a complaint by customers (Davidow,
2003). Customers can interpret this facilitation as a proof of the company’s support and
willingness to solve any conflict that arises in business relationship between both parties.
When the company provides adequate information to customers about how and where to file
a complaint and makes available accessible and user-friendly reception channels, the company increases customers’ perception of justice in the solution to complaints. Goodwin &
Ross (1992) and Davidow & Leigh (1998) confirm that facilitation has a positive effect on a customer’s level of satisfaction in the handling of a complaint. Therefore, we state our first
hypothesis:
H1: Facilitating the presentation of complaints has a positive influence on
perceived justice in solutions.
When a company has an internal protocol process for the registration of complaints
a person responsible for its management, and confirmation to customer about the initiation of
the resolution process, the customer is more likely to perceive that the company diligently
attempting to solve the problem. Homburg & Fürst (2005, 2010) show that the quality of the
norms established by the company for the complaint management process positively affect customers’ evaluations. Accordingly, we posit that the existence of a well-defined protocol of
action by the organization, with an adequate allocation of tasks and responsible personnel for
its implementation, can improve customers’ perception of justice to the extent that a
competent and user-friendly complaint management system conveys a sense of security and
confidence to customers. Conversely, procedures that are inconsistent or arbitrary, especially
those that cause disruption to the customer, can contribute to a higher cost for customers and
lower their assessment of justice (Tax et al. 1998). Given this discussion, we state our next
hypothesis:
H2: A well-defined processing protocol for handling complaints has a positive
influence on perceived justice in solutions.
Customer participation in the process refers to the opportunities the company offers to
the customer to explain a complaint; in other words, the company’s efforts to hear the origin and details of the complaint from the customer’s point of view (Tax et al., 1998; Smith,
Karwan, & Markland, 2009). The ability to explain the problem increases customers’ positive
perception of process control, which can, in turn, positively influence customers’ level of
satisfaction and commitment to company (Lind & Tyler, 1988; Goodwin & Ross, 1992).
Individuals accept decisions better when they feel that they control the processes (Saxby, Tat,
& Johansen, 2000). Therefore, two-way communication, which encourages involvement by the customer and active listening by the company, can increase customers’ perception of
the company understands about the specific situation of each complaint and customer,
through active participation by both the customer and the company, the more likely
customers are to consider the resolution as fair. Therefore, we propose our next hypothesis:
H3: Enabling customers to participate in the complaint handling process has a
positive influence on perceived justice in solutions.
Customer participation in the solution are based on the opportunities that the company
provides customers to work together in search for a solution that takes into account customers’ needs and desires (Tax et al., 1998; Smith et al., 2009). Saxby et al. (2000) find
that customer participation in the solution affects customers’ acceptance or rejection of the
company’s decisions in resolving the problem. Providing avenues of participation to
customers to actively engage in reaching a jointly satisfactory solution requires the company
to be flexible and adapt the procedures according to the individual circumstances of each
complaint. This flexibility by the company is linked to a market orientation that leads to
greater customer satisfaction (Narver & Slater, 1990; Tax et al., 1998; Smith et al., 1999).
Consequently, we state the following hypothesis:
H4: Enabling customers to participate in the complaint solution has a positive
influence on perceived justice in solutions.
Benefits from Behavioural Guidelines
From a management perspective, prior research highlights the importance of interpersonal
relationships. Previous research identifies key aspects of this dimension including respect,
empathy, honesty, and tone (Morris, 1988; 2003) and explains the effect of interpersonal
communication on satisfaction, repurchase intentions, and recommendations (Blodgett, Hill,
Empirical results show that the way in which employees interact with customers significantly influences customers’ behaviour after the complaint, especially satisfaction and repurchase
actions. Alternatively, the lack of consideration of interaction factors can explain why some
customers feel unfairly treated even though they receive fair compensation (Bies & Shapiro,
1987). Therefore, we state the following hypothesis:
H5: Providing good interpersonal treatment to customers has a positive influence
on perceived justice in solutions.
The complaint management literature, in general, concurs a company’s explanation of
a complaint plays a key role in retaining or restoring customer trust and the company’s
credibility (Davidow, 2003). When the explanation allows customer to understand that the
problem is not normal but rather exceptional, the company is more likely to recover from its
error (Blodgett et al., 1997). Even when the problem can be directly attributed to the
company, providing a full explanation and acknowledging fault is better than avoiding
responsibility or blaming others. Acknowledging fault is a sign of transparency that positively affects customers’ perceptions, especially if the company also clarify the steps it
will take to prevent similar failures (Bitner, Booms, & Tetreault, 1990; Conlon & Murray,
1996; Boshoff & Leong, 1998; Davidow 2003). In short, we posit that the level of
explanation given by company to a customer that lodges a complaint is related to the perception of justice in the solution of complaint based on the company’s transparency and
willingness to respond to customers’ questions and wishes. Therefore, we propose the
following hypothesis:
H6: Properly explaining the causes of the complaints has a positive influence on
Benefits from Outcome Guidelines
Davidow (2003) argues that an apology does not cost anything. However, companies
commonly do not offer unsatisfied customers an apology, even when doing so may reduce a customer’s anger caused by a company error. In fact, in some cases, an apology may itself be
the solution to problem, especially in less critical situations (Webster & Sundaram, 1998). An
apology does not necessarily imply admission of guilt by company (Goodman, Malech, &
Boyd, 1987). Even when a firm does not claim fault for the problem, an apology can be a
good answer. Apologizing is a way of externalizing and making visible that the company considers the customer’s complaint as legitimate, that it understands the reasons for the
customer’s dissatisfaction and the seriousness of the problem, and that it will do its best to
find a solution (Davidow, 2003). In short, by apologizing, the company provides
psychological compensation to customers by acknowledging the problem and affirming a
sincere desire to reach a satisfactory resolution. As such, apologizing can increase the customer’s perception of justice in the solution of the complaint (Smith et al., 1999).
Therefore, we state the following hypothesis:
H7: Apologizing for the complaints has a positive influence on perceived justice
in solutions.
We define redress as any additional economic reward beyond the solution of the
problem. Redress may increase the customer’s perceived value of the resolution, particularly
when the problem is the fault of the company (e.g., inadequate management) and caused the
customer to be inconvenienced (Hoffman, Kelley, & Rotalsky, 1995; Davidow, 2003).
Offering more than what customer expects to compensate for a bad experience in the business relationship can increase the customer’s sense of equity (Hess, Ganesan, & Klein,
and commitment to the customer, and thus redress helps to increase the level of customer
satisfaction and positively favours their behavioural intentions after the complaint
(Vázquez-Casielles, Iglesias-Argüelles, & Valera-Neira, 2012). Therefore, we state the following
hypothesis:
H8: Redressing customers for the complaints has a positive influence on
perceived justice in solutions.
Method
Our population universe includes 2,536 Spanish companies with more than 50 employees
from different manufacturing sectors (Amadeus database). We require a minimum of 50
employees for a company to be included because smaller companies may have more
difficulty establishing a standardised procedure and to provide information on certain
variables in the model. For data collection, we use a questionnaire, which was pretested with
five manufacturing industry managers as well as the head of the contact centre division of an
integral marketing services company. The questionnaire was sent to all the companies in the
population universe together with a cover letter explaining the study and a website address
for those who preferred to fill out the questionnaire online. The cover letter was addressed to
the marketing manager, although it requested that the head of complaint handling at the
company complete the questionnaire. After making roughly 900 phone calls to urge
participation, we received 140 valid surveys.
To assess sample representativeness, we use two variables: industry type and number
of employees. Regarding the industry, the proportion test reveals no significant differences,
suggesting that the composition of the sample is similar to the population we are surveying.
test verifies that the number of employees in sample companies does not differ significantly
from the average of the population. This finding holds for each industry, with the exception
of the group of companies competing in chemical, natural rubber, and plastic materials
industries1. Overall, we find that the sample is representative of the population of companies
whose complaint handling behaviour we seek to study.
[Table 2 about here]
Given that in each company a single informant answered all the survey questions,
steps were taken to ensure that common method bias (CMB) is not an important issue in this
investigation. Following Podsakoff, Mackenzie, Lee & Podsakoff’s (2003) recommendation,
an effort was made a priori to reduce common method variance (CMV) through careful
design of the questionnaire wherein item wording was thoroughly revised so as to prevent
biased connotations and where the order of the questions was dissimilar to the sequence of
cause-effect relationships specified in the model. In addition, we apply Harman’s one-factor
test and find that our data do not have a large amount of common method variance.
According to Fuller, Simmering, Atinc, Atinc & Babin (2016), the results of this test indicate
that a large amount of CMV is not observed in our data and, what is more important, it is
therefore very unlikely that common method could substantially bias the estimated
relationships.
1 For this group of industries, firms in our sample have a significantly larger workforce. However, our sample
includes the company that employs, by far, the largest workforce of all those in these industries. The addition of
this company obviously dramatically increases the average number of employees in the sample. Excluding this
company, the average number of employees in the sample falls to 192, with a standard deviation of 298 (z
statistic = –0.40), which leads us to conclude that the companies in our sample in these sectors do not
Because the literature primarily approaches the topic from the customer’s perspective,
we had to make major adaptions to prior scales. Specifically, we based our instruments on the
scales proposed by Tax et al. (1998), Smith et al. (1999) and Homburg & Fürst (2005). We
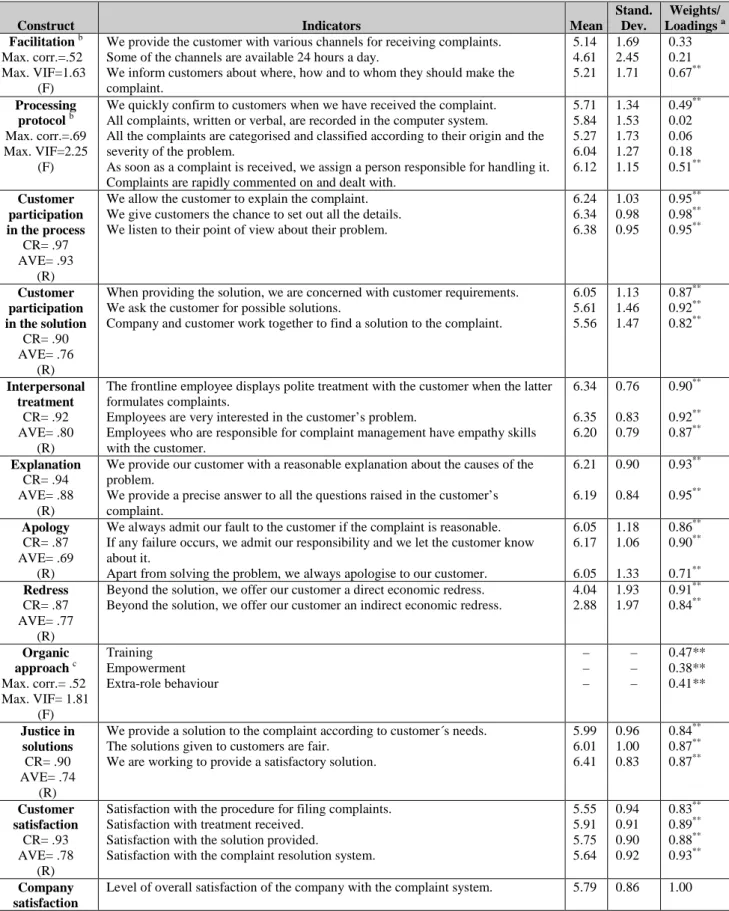
used seven-point Likert scales from 1 (disagreement) to 7 (agreement). Table 3 shows the
items used for the measurement of the constructs in our model. The mechanistic approach
variables are measured as reflective scales, except for facilitation and processing protocol,
which are operationalized as formative indices. The organic approach, introduced as a control
variable, is operationalized as a second-order reflective-formative construct. The first-order
reflective components are employee training, empowerment, and extra-role behaviours
(Hartline & Ferrell, 1996; Homburg & Fürst, 2005; Chan & Lam, 2011), which cause the
second-order formative index that we have called organic approach.
[Table 3 about here]
Results
To test our model, we employ partial least squares path modelling using SmartPLS v.3.2.8
(Ringle, Wende, & Becker, 2015) software. We select partial least squares path modelling,
since this technique allows for work with modest sample sizes and enables us to estimate
relatively complex models that simultaneously include reflective and formative constructs, as
is our case. We analyse and interpret the results of our tests in two phases: evaluation of the
reliability and validity of the measurement model and evaluation of the structural model
(Hair, Hult, Ringle, & Sarstedt, 2014).
Table 3 shows the main magnitudes of the measurement model of our variables. For
the validation of the reflective scales, literature recommends that the factor loading be higher
2014). Our reflective scales meet these conditions. To validate the formative indices, we
analyse the size and significance of the weights of each indicator once tested that there are
not multicollinearity problems. Regarding the reduced weight and the lack of significance of
some items corresponding to the facilitation and processing protocol variables, we maintain
these indicators due to their contribution or absolute importance; that is, the information they
provide without considering the other indicators of the construct is moderately elevated (the
factor loadings of these items are close to 0.5). The correlations between each pair of
indicators are less than 0.7, and the variance inflation factor is below the threshold of 5.
Finally, discriminant validity is evaluated for the set of variables using Fornell & Larcker’s
(1981) procedure and the application of the heterotrait–monotrait ratio (Henseler, Ringle, &
Sarstedt, 2015). Table 4 confirms discriminant validity.
[Table 4 about here]
Table 5 shows the effects resulting from the structural model estimation. Prior to
commenting the results of hypotheses testing, it should be noted that perceived justice in solution is positively related to customer satisfaction (β = 0.36, p < 0.01), which in turn has a
strong positive effect on company satisfaction with the complaint management system (β =
0.56, p < 0.01). Therefore, in addition to examining the hypothesized direct effects of the
mechanistic approach variables on justice in solutions, relevant indirect effects on customer
and company satisfaction will also be reported.
In relation to the hypotheses that propose a positive effect of procedural guidelines on
customer perceived justice, the effects of facilitation and processing protocol on perceived
justice are not significant; therefore, the results do not support H1 and H2, respectively.
Likewise, we find that facilitation and processing protocol are not related, neither directly nor
guideline dimensions apparently do not significantly influence the results of the complaint
management system.
[Table 5 about here]
Table 5 shows that the other two dimensions of the procedural guideline, customer participation in the process (β = 0.22, p < 0.05) and the search for a solution (β = 0.14, p <
0.05) positively influence customers’ perception of justice. These results, therefore, support
H3 and H4, respectively. In addition, customer participation in the solution has a direct effect
on customers’ level of satisfaction (β = 0.22, p < 0.05). This positive direct effect adds up to
the indirect effect (via greater justice). Thus, findings indicate that allowing customers to
participate in finding a solution to the problems they complain about is more effective to
recover customer satisfaction than other procedural guidelines (the total effect of customer
participation in the solution on satisfaction is 0.27, p < 0.05). In turn, procedural guidelines
related to customer participation in the solution positively contribute to a greater company’s
satisfaction with the complaint management system (total effect = 0.15, p< 0.05).
Related to the behavioural guidelines hypotheses, Table 5 shows that interpersonal
treatment does not significantly influence perceived justice (β = 0.10, n.s.). Therefore, H5 is
not supported. Conversely, the level of explanation positively influences the perception of
justice, thus supporting H6 (β = 0.32, p < 0.01). In addition, the level of explanation
considerably influences customer satisfaction indirectly (indirect effect = 0.11, p < 0.05),
which in turn translates into a greater company satisfaction (total effect = 0.15, p < 0.05).
The results for the outcome guidelines on perceived justice show a significant positive direct effect of the apology (β = 0.28, p < 0.01); therefore, H7 is supported. In addition, the
influence exerted by apologizing has an indirect effect, through perceived justice, on
<0.05). Unexpectedly, redress is negatively and significantly related to customers’ perception of justice (β = –0.12, p < 0.05). Consequently, H8 is not supported. Redress has no significant
effect on the other result variables, customer satisfaction and company satisfaction.
Discussion
Both academic and business literature addressing complaint management reveal that how
organisations respond to customers’ complaints is key to securing satisfaction goals
(Davidow, 2003; Homburg & Fürst, 2005). In this vein, the findings derived from our study
indicate that standardising company responses has a positive impact on customers’ perceived
justice and subsequent satisfaction with the complaint handling system. The mechanistic
approach in the complaint system plays a decisive role in explaining consumer perception of
justice and satisfaction.
Specifically, our findings indicate that three types of guidelines (procedural, behavioural, and
outcome) help to explain perception of justice in the solution of complaints and, thus,
customer satisfaction with the complaint management system. However, important
differences exist for the different types of guidelines and their corresponding dimensions.
The results for the procedural guideline show that the facilitation of the customer’s
voice and the establishment of a processing protocol do not significantly influence perceived
justice. In other words, to explain justice is more important to ensure customers can
participate in the process and in the solution than the mere fact of facilitating customers to
submit their complaints or setting up an agile and standardised processing protocol. However,
this lack of effect can be explained by the high correlations between the four procedural
processing protocols in determining the degree of perceived justice; rather, both types of
action may be considered necessary, but not sufficient, conditions.
The results of the dimensions of the behavioural guideline (interpersonal treatment
and explanation) show a similar relation. Although the level of explanation has a direct
influence on perceived justice and an indirect on customer satisfaction, employees’
interpersonal interactions with customers seems to be an irrelevant factor. This result
contradicts some prior studies (e.g., Blodgett et al., 1997, Estelami 2000, McCollough et al.,
2000). Again, the lack of significance of the effects of interpersonal treatment suggests that
its importance of this variable is lower than that of the level of explanation. However, given
that the correlations between treatment and explanation are high, we could conclude that the
two variables jointly influence perceived justice. In other words, friendly and empathetic
treatment of the customer that conveys concern for the problem has real meaning in the
explanation of why the failure occurred and the plan for its resolution. However, cordial
treatment that lacks content relevant to the complaint and its potential resolution has a practically null effect on customers’ perception of justice.
Regarding the outcome guidelines, the explanatory power of an apology is
particularly highlighted. An apology shows that the firm regrets the problem caused, whether
or not it is actually responsible for it, which might serve to lessen customer anger. In less
serious situations, it might even prove to be the actual solution to the problem. Whether or
not it is accompanied by reparation of the damage, apologizing not only directly influences
justice but also indirectly influences both customer and company satisfaction. That is,
apologizing has a positive effect on all three outcome variables considered in this research.
Interestingly, and contrary to our expectations, the effect of redress on perceived
message that the firm is the one to suffer the negative consequences of the problem, or that it
assumes at least part of the losses caused to the customer, does not work. The explanation for
this finding may be that customers perceive redress as a way for companies to quickly
remedy an injustice or mistake without either fully explaining the problem or providing
reassurances that it will not reoccur. Consequently, redress alone cannot replace good
management of the complaint system.
The findings confirm the influence of perceived justice in solutions on customer
satisfaction and show the mediating role assumed by perceived justice in the relation between
the mechanistic approach variables and customer satisfaction. Likewise, customer satisfaction
with complaint management, as expected, is a significant antecedent of the company’s
satisfaction with the complaint system.
Managerial Implications
This study shows that all three types of guidelines (procedural, behavioural, and outcome) are
important for the effective management of unsatisfied customers and the achievement a
solution that the customer perceives as fair. In this regard, we recommend that the
management of the complaint system address all three aspects: formalise the procedure for
filing the complaint, provide customers with relevant interpersonal communication, and
establish clear guidelines for resolution.
Of particular importance is customers’ participation in the process (i.e., provide an
opportunity for customers to fully express their point of view on the incident) and in the
solution (i.e., asking for customers’ opinion on how best to reach a solution and repair the
relationship). Allowing customers to contribute to the solution to their problems is doubly
and direct effect on customer satisfaction. Customers who are allowed to contribute their suggestions to the resolution of the problem may interpret the company’s willingness to hear
them as sign of respect and consideration. As such, they are more likely to evaluate the
complaint handling positively even if the final solution itself is not entirely satisfactory. The
facilitation and the processing protocol are relevant because, despite these two variables do
not per se guarantee a greater perceived justice, a company cannot effectively normalise
customer participation in the process and the solution without providing relevant and
user-friendly channels for complaint submission and ensures an agile protocol. Consequently, we
advise companies to be proactive and provide a helpful and responsive system for customers’
to address a problem.
Regarding the behavioural guidelines, we recommend that companies establish
behavioural patterns so employees respond with kindness and empathy and, above all,
provide customers a full and relevant explanation of the incident. The level of explanation is
directly related to satisfaction. That is, clearly explaining the problem and possible solutions increases a customer’s satisfaction with the complaint process even when the final solution is
not totally satisfactory. Customers’ appreciate the company’s transparency and its willingness
to explain the causes of the problem in a clear manner using understandable language.
Finally, apologizing and, if appropriate, acknowledging the error is inescapably
important in achieving customer compliance. However, redress is less effective in resolving
complaints because it does not contribute to customers’ perception of a fair outcome and thus
does not restore their confidence in the company. In fact, the customer may interpret redress
unfavourably, viewing more as an unprofessional departure and even a kind of bribe by the
company in attempt to compensate for the error without making the effort to achieve an equitable and honest solution. To understand consumers’ reactions to the economic
judgments regarding fault, which are likely to moderate the impact of such compensation in
subsequent results (Chen, Ma, Bian, Zheng, & Devlin, 2018).
Limitations and Future Research Lines
Despite our efforts to develop a study that takes into account relevant contributions, we
acknowledge some limitations that affect our research. First, due to increased complexity, we
do not take into account the role played by certain situational variables such as, among others, the variability in the type of problems addressed by customers’ complaints, the
severity of the complaints, the type of product involved in the complaint, the attribution of
responsibility, and the intensity of the commercial relationship between the customer and the
supplier. These variables may have a moderating effect on the proposed relationships, and,
therefore, their absence should be cited as a limitation when drawing conclusions. Also, due
to concerns of increasing complexity of the model, we do not address the possible effects of
the interaction between the mechanistic and organic approaches, which could theoretically be
proposed. Even though mechanistic and organic approaches imply two different conceptions
of how customer complaints and grievances can be handled more effectively, both
approaches should be seen as complementary rather than as alternatives. In any case,
important lines of research are open to us.
Similarly, future research into complaint handling might benefit from exploring the
possible causal relations between various norms from the mechanistic approach. For instance,
consumer participation in finding a solution to the complaint lodged by the client and a sound
explanation as to why the problem arose might help to ensure that financial redress is not
seen as an easy and low involvement way out for the firm. Likewise, positing facilitation as
an antecedent of customer participation in the complaint solving process should be
complaints, in addition to facilitating presentation, might also help customers themselves to
provide solutions to the problem and, thereby, increase perceived justice.
Another limitation of this study is related to the form of information collection. The
measurement of the model variables uses a single informant: the company manager with
responsibility for issues related to the handling of complaints. The use of multiple
informants—for example, other members of the company such as other employees
themselves as well as the customers—can help to avoid common method biases. Although
we do not totally rule out the possibility of common method bias in the sample, our data
show no evidence of its presence. Specifically, we observe sufficient discriminant validity
and construct correlations which in most instances are moderate. Moreover, we applied Harman’s one-factor test and found that it is very unlikely that common method could
substantially bias our estimations (see method section). Nevertheless, in light of this
limitation we wonder whether customers really do find that the least important variables
when gauging perceived justice or determining their degree of satisfaction are facilitation,
processing protocol, and redress. Future research from the consumer perspective should test
whether the importance attributed by customers to the variables we use to characterise the
mechanistic approach of the company's complaint management system coincides with the
findings of this study.
References
Anderson, J. C., & Narus, J. A. (1990). A model of distributor firm and manufacturer firm
working partnerships. Journal of Marketing, 54(1), 42–58.
Bies, R. J., & Shapiro, D. L. (1987). Interactional fairness judgments: The influence of causal
Bitner, M. J., Booms, B. H., & Tetreault, M. S. (1990). The service encounter: diagnosing
favorable and unfavorable incidents. Journal of Marketing, 54(January), 71–84.
Blodgett, J. G., Hill, D. J., & Tax, S. S. (1997). The effects of distributive, procedural, and
interactional justice on postcomplaint behavior. Journal of Retailing, 73(2), 185–210.
Boshoff, C., & Leong, J. (1998). Empowerment, attribution and apologising as dimensions of
service recovery: An experimental study. International Journal of Service Industry
Management, 9(1), 24–47.
Chan, K. W., & Lam, W. (2011). The trade-off of servicing empowerment on employees’
service performance: examining the underlying motivation and workload
mechanisms. Journal of the Academy of Marketing Science, 39(4), 609–628.
Chao, C. M., & Cheng, B. W. (2017). Does service recovery affect satisfaction and loyalty?
An empirical study of medical device suppliers. Total Quality Management &
Business Excellence, DOI: 10.1080/14783363.2017.1369351.
Chebat, J. C., & Kollias, P. (2000). The Impact of empowerment on customer contact employees’ roles in service organizations. Journal of Service Research, 3(1), 66–81.
Chen, T., k. Ma, K., Bian, X., Zheng, C., & Devlin, J. (2018). Is high recovery more effective
than expected recovery in addressing service failure? A moral judgment perspective.
Journal of Business Research, 82, 1–9.
Conlon, D. E., & Murray, N. M. (1996). Customer perceptions of corporate responses to
product complaints: the role of explanations. Academy of Management Journal, 39(4),
1040–1056.
Davidow, M. (2000). The bottom line impact of organizational responses to customer
complaints. Journal of Hospitality &Tourism Research, 24(4), 473–490.
Davidow, M., & Leigh, J. (1998). The effects of organizational complaint responses on
consumer satisfaction, word of mouth activity and repurchase intentions. Journal of
Consumer Satisfaction, Dissatisfaction and Complaining Behavior, 11, 91–102.
Estelami, H. (2000). Competitive and procedural determinants of delight and disappointment
in consumer complaint outcomes. Journal of Service Research, 2(3), 285–300.
Fornell, C., & Larcker, D. F. (1981). Evaluating structural equation models with
unobservable variables and measurement error. Journal of Marketing Research,
18(February), 39–50.
Fuller, C.M., Simmering, M.J., Atinc, G., Atinc, Y., & Babin, B.J. (2016). Common methods
variance detection in business research. Journal of Business Research, 69, 3192–
3198.
Goodman, J. A., Malech, A., & Boyd, S. (1987). Danger, angry customer. ABA Banking
Journal, 79(1), 63–66.
Goodwin, C., & Ross, I. (1992). Consumer responses to service failures: Influence of
procedural and interactional fairness perceptions. Journal of Business Research,
25(2), 149–63.
Grainer, M., Noble, C. H., Bitner, M. J., & Broetzmann, S. M. (2014). What unhappy
customers want. MIT Sloan Management Review, 55(3).
Hair, J. F., Hult, G. T. M., Ringle, C. M., & Sarstedt, M. (2014). A primer on partial least
squares structural equation modelling (PLS-SEM). Thousand Oaks, CA: Sage.
Hartline, M. D., & Ferrell, O. C. (1996). The management of customer-contact service
employees: An empirical investigation. Journal of Marketing, 60(October), 52–70.
Henseler, J., Ringle, C. M., & Sarstedt, M. (2015). A new criterion for assessing discriminant
validity in variance-based structural equation modelling. Journal of the Academy of
Hess, R. L., Ganesan, S., & Klein, N. M. (2003). Service failure and recovery: the impact of
relationship factors on customer satisfaction. Journal of the Academy of Marketing
Science, 31(2), 127–145.
Hoffman, K. D., Kelley, S. W., & Rotalsky, H. M. (1995). Tracking service failures and
employee recovery efforts. Journal of Services Marketing, 9(2), 49–61.
Homburg, C., & Fürst, A. (2005). How organizational complaint handling drives customer
loyalty: And analysis of the mechanistic and the organic approach. Journal of
Marketing,69(July), 95–114.
Homburg, C., & Fürst, A. (2007). See no evil, hear no evil, speak no evil: a study of
defensive organizational behaviour towards customer complaints. Journal of the
Academy Marketing Science, 35, 523–536.
Homburg, C., Fürst, A., & Koschate, N. (2010). On the importance of complaint handling
design: a multi-level analysis of the impact in specific complaint situations. Journal of
the Academy Marketing Science, 38, 265–87.
Kelley, S. W., Hoffman, K. D., & Davis, M. A. (1993). A typology of retail failures and
recoveries. Journal of Retailing, 69(4), 429–52.
Kwon, S., & Jang, S. S. (2012). Effects of compensation for service recovery: From the
equity theory perspective. International Journal of Hospitality Management, 31(4),
1235–1243.
Lind, E. A., & Tyler, T. R. (1988). The social psychology of procedural justice, New York:
Plenum.
March, J. G., & Simon, H. A. (1993). Organizations (2nd ed.). Cambridge, MA: Blackwell.
Martin, C. L., & Smart, D. T. (1994). Consumer experiences calling toll-free corporate
Maxham III, J. G., & Netemeyer, R. G. (2003). Firms reap what they sow: The effects of shared values and perceived organizational justice on customers’ evaluations of
complaint handling. Journal of Marketing, 67(January), 46–62.
McCollough, M.A., Berry, L. L., & Yadav, M. S. (2000). An empirical investigation of
customer satisfaction after service failure and recovery. Journal of Service Research,
3(2), 121–37.
Morris, S. V. (1988). How many lost customers have you won back today? An aggressive
approach to complaint handling in the hotel industry. Journal of Consumer
Satisfaction,Dissatisfaction and Complaining Behavior, 1, 86–92.
Narver, J. C., & Slater, S. F. (1990). The effect of market orientation on business
profitability. Journal of Marketing, 54(October), 20–35.
Orsingher, C., Valentini, S., & Angelis, M. De (2010). A meta-analysis of satisfaction with
complaint handling in services. Journal of the Academy of Marketing Science, 38(2),
169–186.
Podsakoff, P. M., Mackenzie, S. B., Lee, J. Y., & Podsakoff, J. O. (2003). Common method
bias in behavioral research: A critical review of the literature and recommended
remedies. Journal of Applied Psychology, 88(5), 879–903.
Ringle, C. M., Wende, S, & Becker, J. M. (2015): SmartPLS 3. Bönningstedt: SmartPLS
GmbH.
Saxby, C. L., Tat, P. K., & Johansen, J. T. (2000). Measuring consumer perceptions of
procedural justice in a complaint context. Journal of Consumer Affairs, 34(2), 204–
225.
Smith, A. K., Bolton, R. N., & Wagner, J. (1999). A model of customer satisfaction with
service encounters involving failure and recovery. Journal of Marketing Research,
Smith, J. S., Karwan, K. R., & Markland, R. E. (2009). An empirical examination of the
structural dimensions of the service recovery system. Decision Sciences, 40(1), 165–
186.
Tax, S. S., & Brown, S. W. (1998). Recovering and learning from service failure. Sloan
Management Review,40(1), 75–88.
Van Vaerenberg, Y., & Orsingher, C. (2016). Service recovery: An integrative framework
and research agenda. The Academy of Management Perspectives, 30(3), 328–346.
Vázquez-Casielles, R., Iglesias-Argüelles, V., & Varela-Neira, C. (2012). Service recovery,
satisfaction and behaviour intentions: analysis of compensation and social comparison
communication strategies. The Service Industries Journal,32(1), 83–103.
Vos, J. F. J., Huitema, G. B., & De Lange-Ros, E. (2008). How Organisations can Learn from
Complaints. TQM Journal, 20(1), 8–17.
Webster, C., & Sundaram, D. S. (1998). Service Consumption Criticality in Failure
Recovery. Journal of Business Research, 41(February), 153–159.
Yilmaz, C., Varnali, K., & Kasnakoglu, B. T. (2016). How do firms benefit from customer
FIGURE 1 Proposed model
Adapted from Tax et al. (1998), Davidow (2003), Maxham & Netemeyer (2003), Homburg & Fürst (2005), and Homburg et al. (2010).
Justice in solutions Procedural guidelines
Facilitation
Processing protocol
Customer participation in
process
Customer participation in
solution
Company satisfaction Customer
satisfaction Behavioural guidelines
Interpersonal treatment
Explanation
Outcome guidelines
Apology
Redress
TABLE 1
Selected studies based on the mechanistic approach
Study Process
guidelines Behavioural guidelines Outcomes guidelines Dependent Variable Type of industry Information resource Fornell &Wernefelt (1988)
Facilitation Redress Repurchase
Morris (1988) Timeliness Credibility Attentiveness
Satisfaction Word of mouth Repurchase
Services Customers
Goodwin & Ross (1992)
Facilitation Redress
Apology
Satisfaction Services Customers
Martin & Smart (1994)
Credibility Attentiveness
Apology Satisfaction Repurchase
Services Customers
Conlon & Murray (1996)
Timeliness Type of explanation (excuses, apology, justifications) Presence/absence of coupons Satisfaction Repurchase
Products Customers .
Tax, Brown & Chandrashekan (1998) Procedural justice -Process control -Decision control -Accessibility -Timing/speed -Flexibility Interactional justice -Explanation/caus al -Account -Honesty -Politeness -Effort -Empathy Distributive justice -Equity -Equality -Need Satisfaction Trust Commitment
Services Customers
Smith, Bolton & Wagner (1999)
Timeliness Redress
Apology
Satisfaction Services Customers
Davidow (2000) Facilitation Timeliness Credibility Attentiveness Apology Redress Satisfaction Word-of-mouth Repurchase intentions
Services Customers
Estelami (2000) Timeliness Attentiveness Redress Satisfaction Services and products
Customers
McCollough, Berry & Yadav (2000)
Attentiveness Redress Satisfaction Service Customers
Davidow (2003) Timeliness Accountability Facilitation
Personal interaction
Redress Perceived justice Response evaluation disconfirmation of expectations Post dissatisfaction customer responses Wirt &Mattila (2004)
Timeliness Discount/no
discount Apology/no apology Satisfaction Repatronage intentions Word of mouth
Service Customers
TABLE 2
Population and sample distribution
Industry (NACE) Number of companies in the population (%) Number of companies in the sample (%) Proportion test Average employee number of companies in the
population (std. dev.) Average employee number of companies in the sample (std. dev.) Means difference test
Food, drink and tobacco industry (10, 11, 12)
599 (23.62%)
30
(21.43%) -.63
233 (546)
247
(324) .30 Textile, clothing, leather and footwear
industry (13, 14, 15)
215 (8.48%)
12
(8.57%) .04
146 (211)
195
(372) .80 Paper, edition, graphic arts and
reproduction industry (17, 18)
235 (9.27%)
19
(13.57%) 1.49
142 (154)
141
(177) -.03 Chemical, rubber and plastics industry
(20, 21, 22)
747 (29.46%)
32
(22.86%) -1.86
232 (507)
490*
(1575) 2.64 *
Electrical, electronic and optical material and equipment industry (26, 27)
288 (11.36%)
20
(14.29%) .99
251 (557)
158
(130) -.75
Transportation Equipment (29) 263 (10.37%)
13
(9.29%) -.44
497 (1.356)
204
(208) -.84
Other manufacturing industries (31, 32) 189 (7.45%)
14
(10.00%) 1.00
145 (185)
241
(281) 1.27
Total 2536
(100.00%) 140 (100.00%) 240 (624) 262
(771) .39
TABLE 3 Construct measurement
Construct Indicators Mean
Stand. Dev.
Weights/ Loadings a Facilitation b
Max. corr.=.52 Max. VIF=1.63
(F)
We provide the customer with various channels for receiving complaints. Some of the channels are available 24 hours a day.
We inform customers about where, how and to whom they should make the complaint. 5.14 4.61 5.21 1.69 2.45 1.71 0.33 0.21 0.67** Processing protocol b Max. corr.=.69 Max. VIF=2.25
(F)
We quickly confirm to customers when we have received the complaint. All complaints, written or verbal, are recorded in the computer system.
All the complaints are categorised and classified according to their origin and the severity of the problem.
As soon as a complaint is received, we assign a person responsible for handling it. Complaints are rapidly commented on and dealt with.
5.71 5.84 5.27 6.04 6.12 1.34 1.53 1.73 1.27 1.15 0.49** 0.02 0.06 0.18 0.51** Customer participation in the process
CR= .97 AVE= .93
(R)
We allow the customer to explain the complaint. We give customers the chance to set out all the details. We listen to their point of view about their problem.
6.24 6.34 6.38 1.03 0.98 0.95 0.95** 0.98** 0.95** Customer participation in the solution
CR= .90 AVE= .76
(R)
When providing the solution, we are concerned with customer requirements. We ask the customer for possible solutions.
Company and customer work together to find a solution to the complaint.
6.05 5.61 5.56 1.13 1.46 1.47 0.87** 0.92** 0.82** Interpersonal treatment CR= .92 AVE= .80 (R)
The frontline employee displays polite treatment with the customer when the latter formulates complaints.
Employees are very interested in the customer’s problem.
Employees who are responsible for complaint management have empathy skills with the customer.
6.34 6.35 6.20 0.76 0.83 0.79 0.90** 0.92** 0.87** Explanation CR= .94 AVE= .88 (R)
We provide our customer with a reasonable explanation about the causes of the problem.
We provide a precise answer to all the questions raised in the customer’s complaint. 6.21 6.19 0.90 0.84 0.93** 0.95** Apology CR= .87 AVE= .69 (R)
We always admit our fault to the customer if the complaint is reasonable. If any failure occurs, we admit our responsibility and we let the customer know about it.
Apart from solving the problem, we always apologise to our customer.
6.05 6.17 6.05 1.18 1.06 1.33 0.86** 0.90** 0.71** Redress CR= .87 AVE= .77 (R)
Beyond the solution, we offer our customer a direct economic redress. Beyond the solution, we offer our customer an indirect economic redress.
4.04 2.88 1.93 1.97 0.91** 0.84** Organic approach c
Max. corr.= .52 Max. VIF= 1.81
(F) Training Empowerment Extra-role behaviour – – – – – – 0.47** 0.38** 0.41** Justice in solutions CR= .90 AVE= .74 (R)
We provide a solution to the complaint according to customer´s needs. The solutions given to customers are fair.
We are working to provide a satisfactory solution.
5.99 6.01 6.41 0.96 1.00 0.83 0.84** 0.87** 0.87** Customer satisfaction CR= .93 AVE= .78 (R)
Satisfaction with the procedure for filing complaints. Satisfaction with treatment received.
Satisfaction with the solution provided.
Satisfaction with the complaint resolution system.
5.55 5.91 5.75 5.64 0.94 0.91 0.90 0.92 0.83** 0.89** 0.88** 0.93** Company satisfaction
Level of overall satisfaction of the company with the complaint system. 5.79 0.86 1.00
a For reflective indicators (R) the factor loading is offered and for formative indicators (F) the weight is the value being examined. b Formative indicators with non-significant weights have factor loadings close to 0.5, hence they are retained in the measurement model.
c All the first-order components of the organic approach (training, empowerment and extra-role behaviours) are measured with three reflective
indicators.
TABLE 4
Correlation matrix and discriminant validity
1 2 3 4 5 6 7 8 9 10 11 12
1. Facilitation n.a n.a n.a n.a n.a n.a n.a n.a n.a n.a n.a n.a
2. Processing protocol 0.465 n.a n.a n.a n.a n.a n.a n.a n.a n.a n.a n.a
3. Customer participation process 0.547 0.706 0.963 0.625 0.699 0.664 0.708 0.071 0.560 0.814 0.571 0.312
4. Customer participation solution 0.417 0.560 0.573 0.872 0.496 0.560 0.523 0.163 0.529 0.666 0.630 0.343
5. Interpersonal treatment 0.369 0.579 0.644 0.440 0.896 0.819 0.724 0.080 0.540 0.804 0.621 0.436
6. Explanation 0.387 0.643 0.605 0.485 0.717 0.940 0.665 0.170 0.642 0.862 0.695 0.462
7. Apology 0.475 0.645 0.620 0.434 0.596 0.561 0.828 0.286 0.587 0.840 0.682 0.480
8. Redress 0.177 0.023 -0.048 0.128 0.068 0.136 0.208 0.877 0.264 0.124 0.152 0.195
9. Organic approach 0.432 0.407 0.514 0.460 0.474 0.564 0.494 0.206 0.701 0.664 0.550 0.356
10. Justice in solutions 0.452 0.642 0.728 0.567 0.689 0.733 0.685 0.012 0.568 0.862 0.795 0.536
11. Customer satisfaction 0.406 0.537 0.534 0.559 0.558 0.616 0.577 0.122 0.491 0.691 0.884 0.616
12. Company satisfaction 0.275 0.379 0.306 0.321 0.412 0.431 0.427 0.170 0.332 0.489 0.587 1.000
TABLE 5
Direct, indirect and total effects of the structural model relationships
Dependent variables
Justice in solutions Customer satisfaction Company satisfaction
Predictors Direct
effects
Indirect effects
Total effects
Direct effects
Indirect effects
Total effects
Direct effects
Indirect effects
Total effects
Facilitation 0.00 (H1) 0.00 0.05 0.00 0.05 0.03 0.03
Processing protocol -0.06 (H2) -0.06 0.01 -0.02 -0.01 -0.01 -0.01
Customer participation in the process 0.22*(H3) 0.22 *
-0.12 0.08* -0.04 -0.02 -0.02
Customer participation in the solution 0.14*(H4) 0.14* 0.22* 0.05* 0.27* 0.15* 0.15*
Interpersonal treatment 0.10 (H5) 0.10 0.06 0.04 0.10 0.05 0.05
Explanation 0.32**(H6) 0.32** 0.15 0.11* 0.26** 0.15** 0.15**
Apology 0.28**(H7) 0.28** 0.14 0.10** 0.24** 0.13* 0.13*
Redress -0.12*(H8) -0.12* 0.01 -0.04* -0.03 -0.02 -0.02
Justice in solutions 0.36** 0.36** 0.20** 0.20**
Customer satisfaction 0.56** 0.56**
Organic approach 0.08 0.08 0.04 0.03 0.07 0.06 0.04 0.10
R2 73.3% 55.8% 34.7%