The sources of economic growth in the Basque Country, Navarre and Spain during the period 1986 2004
24
0
0
Texto completo
(2) 02 Erauskin. 30/5/08. 36. 08:34. Página 36. Erauskin-Iurrita, I.. Las fuentes del crecimiento económico en el País Vasco, Navarra y España durante el período 1986-2004 RESUMEN: Este trabajo analiza las fuentes del crecimiento económico en el País Vasco y sus tres territorios históricos (Araba, Bizkaia y Gipuzkoa), en Navarra, y en España durante 1986-2004, poniendo especial énfasis en el papel de las infraestructuras y de las tecnologías de la información y de la comunicación (TIC) en el crecimiento, y comparando los resultados con los de la UE y los EE.UU. En primer lugar, la tasa de crecimiento de la producción fue más alta en Navarra y en España que en los EE.UU., y mucho más alta que la de la UE. El País Vasco mostró un mejor desempeño sólo durante 1995-2004. En segundo lugar, el trabajo y el capital fueron los principales motores del crecimiento de la producción. El crecimiento de la PTF fue residual e incluso decreciente en el período 1995-2004 debido al incremento en la contribución del trabajo. Estos resultados contrastan especialmente con el patrón para los EE.UU., donde el crecimiento de la PTF sigue siendo sustancial. Tercero, las infraestructuras contribuyeron aproximadamente en 0,10% al crecimiento de la producción. Cuarto, la contribución del capital TIC al crecimiento fue alrededor de 0,35% y aumentó en el período 1995-2004. Sin embargo, todavía está lejos de los niveles de la UE y especialmente de los EE.UU. Finalmente, la tasa de crecimiento de la producción por hora se situó en torno al 1,20%, mientras que el País Vasco alcanzó una posición más rezagada. El crecimiento en la intensidad de capital fue la principal fuente del crecimiento de la productividad del trabajo. Mientras que la contribución de las infraestructuras a la tasa de crecimiento del producto por hora se redujo en el período 1995-2004, la del capital TIC aumentó. Sin embargo, la contribución del capital de ICT a la tasa de crecimiento de la producción por hora se mantiene por detrás de la de la UE y de la de los EE.UU. Clasificación JEL: O47. Palabras clave: Contabilidad del crecimiento económico, productividad total de los factores.. 1. Introducción The average growth of labor productivity has shown a poor performance in Spain and in the European Union (EU) since the mid 1990s2. Additionally, the fall in the average growth rate of total factor productivity (TFP), sometimes even becoming negative, has been especially worrisome since it is usually related to the rate of growth of technological change, that is, the contribution to the growth rate of output of everything not directly related to the growth rate of inputs, such as labor (number of hours worked by the labor force) and capital (value of the services capital assets provide to the economy). 2. See, for example, Mas and Quesada (2005), Gual, Jódar and Ruiz (2006), and Escribá and Murgui (2007) for Spain, and O’Mahony and van Ark (2003), Timmer, Ypma and van Ark (2003), Sapir et al. (2004), and van Ark, O’Mahony and Ypma (2007) for the EU..
(3) 02 Erauskin. 30/5/08. 08:34. Página 37. The sources of economic growth in the Basque Country, Navarre and Spain during 1986-2004 37. However, few studies have analyzed the sources of economic growth for the Autonomous Community of the Basque Country (Basque Country, for simplicity) and each of its three historic territories, Araba, Bizkaia, and Gipuzkoa, and the Foral Community of Navarre (Navarre), as we will show below. Additionally, most of them have used econometric methods even though the literature has preferred the noneconometric approach. Furthermore, those studies have become somewhat outdated as they do not capture the recent evidence. Moreover, the impact of Information and Communications Technologies (ICT) on growth has already been studied for the US, the EU and Spain, but, as far as I know, there is no evidence for the Basque Country (and its historic territories) and Navarre. This paper studies the sources of economic growth for the Basque Country and each of its three historic territories, Araba, Bizkaia, and Gipuzkoa, Navarre and Spain during the period 1986-2004. Then these sources are compared with those of the EU, and the US. Special attention is devoted to the impact of ICT on economic growth. The role of infrastructures on growth is also analyzed3. Growth accounting is a very useful method to analyze the sources of economic growth of a country since it obtains an approximation to the contribution of inputs to growth. It decomposes the growth rate in aggregate output into the contribution of the growth rate of inputs (such as labor and capital) plus the growth rate in TFP. This paper is organized as follows. In Section 2 I revise the standard framework of growth accounting. Section 3 summarizes the results of previous studies. In Section 4 I briefly describe the sources used for this paper. The main results of the analysis are shown in Section 5. Section 6 concludes.. 2. The growth accounting methodology4 Growth accounting is a method best understood as a first approximation to the deep determinants of economic growth. However, it should not be seen as an explanation of the forces that generate growth in each input. That implies that growth accounting does not explain the causes of economic growth, which is ignored very often (Helpman, 2004, p. 26). As a result, growth accounting should be considered as a method to study the proximate causes of growth (Bosworth y Collins, 2003, p. 114). Then the growth rate of inputs, input shares and technological change should be related to economic policy, consumer preferences, natural resources, the initial endowments of physical and human capital, and so on. The principal framework of analysis for economic growth accounting is based on the pioneer work by Solow (1957)5. The analysis starts from a standard neoclassical production function. 3. See Mas (2006) for a recent revision on the impact of infrastructures and ICT on economic growth. The content of this section is mainly based on Barro and Sala-i-Martín (2004, chap. 10), and Mas and Quesada (2005, Ch. 8). 5 The initial studies on growth accounting go back to the 30s, but Solow (1957) is the main contributor to the literature on growth accounting since it integrates explicitly economic theory in the accounting exercise (Griliches, 2000, p. 12). 4.
(4) 02 Erauskin. 30/5/08. 38. 08:34. Página 38. Erauskin-Iurrita, I.. Yt = At · F (Lt, KINF · t, KICT ·t, KO, t). [1]. where Y denotes output, A the level of technology (Hicks-neutral or output augmenting), or TFP, L labor, and K capital, with 3 types of capital. Subscript INF refers to (road, water, railway, airport, port and urban) infrastructures, ICT to Information and Communications Technologies (Hardware or Office machinery and computer equipment, Software, and Communications), and O to other types of (non-residential) capital (such as Constructions other than dwellings and the infrastructures referred earlier, Transport equipment, and Machinery, equipment and other products, except hardware, software or communications)6. Labor input is measured as hours worked, unadjusted for human capital. Capital input is measured as the value of the capital services provided (Jorgenson and Griliches, 1967). Assuming competitive factor markets and constant returns to scale, then the growth rate of production can be disaggregated into the growth rate of TFP, on the one hand, and the growth rate of inputs (adjusted by their contribution to output), on the other hand, – · ∆ ln L + α – – ∆ ln Yt = ∆ ln At + α L, t t KINF, t · ∆ ln KINF, t + αKICT, t · ∆ ln KICT, t + [2] – + α KO, t · ∆ ln KO, t where – = 1 · [α + α α L, t L, T L, t–1] is the average share of labor compensation in total output, 2 1 – · [αKINF, t + αKINF, t–1] is the average share of the value of capital services α KINF, t = 2 provided by infrastructures in total output, 1 αKICT, t = · [αKICT, t + αKICT, t–1] is the average share of the value of capital services 2 provided by information and communications technologies in total output, and 1 αKO, t = · [αKO, t + αKO, t–1] is the average share of the value of capital services 2 provided by other types of capital in total output. Then the share of the compensation of employees (including an imputation for self-employed persons), CE, in total output, Y, is defined as αL, t =. CEt , Yt. the share of the value of capital services provided by infrastructures, VCSKINF, in total output, as αKINF, t =. VCSKINF, t , Yt. the share of the value of capital services provided by ICT, VCSKICT, in total output, as 6. See Mas, Pérez and Uriel (2005b) for more details..
(5) 02 Erauskin. 30/5/08. 08:34. Página 39. The sources of economic growth in the Basque Country, Navarre and Spain during 1986-2004 39. αKICT, t =. VCSKICT, t , Yt. and the share of the value of capital services provided by other types of capital, VCSKO, in total output, as VCSKO, t αKO, t = , where Yt αL, t + αKINF, t + αKICT, t + αKO, t = 1 If we have data on the quantities, Y, L, and K, and on the input shares, αL, αKINF, αKICT, and αKO, then the growth rate of TFP, ∆ ln At, can be calculated as the growth rate of output that cannot be attributed to the growth rate of inputs (weighted by their respective contributions) from equation [2] as, – · ∆ ln L – α – – ∆ ln At = ∆ ln Yt – α L, t t KINF, t · ∆ ln KINF, t – αKICT, t · ∆ ln KICT, t – – –α KO, t · ∆ ln KO, t. [3]. that is, as a “residual”. Thus the term is usually known as Solow residual7, or a “measure of our ignorance” (Abramowitz, 1956)8. According to Helpman (2004, p. 22), “it represents the aggregate effect of diverse forms of technological change”. Hulten (2001, p. 40) points out that “intuitively, it measures the shift in the production function”, which can be caused by “technical innovations, organizational and institutional changes, changes in societal attitudes, fluctuations in demand, changes in factor shares, omitted variables, and errors of measurement” (Hulten, ibid.). That is why “the residual should not be equated to technical change, even though it often is”9. In addition, Hulten (Ibid.) points out that “to the extent that productivity is affected by innovation, it is the costless part of technical change that it captures. This “manna from heaven” may reflect spillover externalities thrown off by research projects, or it may simply reflect inspiration and ingenuity”. In the same vein, as O’Mahony and van Ark (2003, p. 216) put it, “increases in measured TFP can arise for a number of reasons including investment in innovation-inducing activities such as R&D expenditu7. Griliches (2000, p. 5) points out that the first time that the term residual or residual factor is used goes back, it seems, to an article by H.W. Arndt in 1961, even though the paper is not published until 1964. The term is popularized with the publication of a monograph by the OCDE entitled “The residual factor residual and economic growth” (Vaizey et al., 1964). See Griliches (2000, Chapter 1) for more details on the origins of the residual. 8 Since in this paper labor will not be adjusted for human capital, the impact of changes in the composition of the labor forces (or “labor quality”) will be attributed to the growth in TFP. 9 According to Hulten (2001, p. 8, footnote 5), “The difference between the Hicksian shift parameter, At, and the rate of technical change arises for many reasons. The most important is that the shift parameter captures only costless improvements in the way an economy’s resources of labor and capital are transformed into real GDP (the proverbial manna from heaven). Technical change that results from R&D spending will not be captured by At unless R&D is excluded from Lt and Kt (which it generally is not). A second general reason is that changes in the institutional organization of production will also shift the function, as will systematic changes in worker effort.”.
(6) 02 Erauskin. 30/5/08. 40. 08:34. Página 40. Erauskin-Iurrita, I.. res, measurement issues including cyclical influences and pure TFP or costless increases in output arising from network externalities or spillovers. The latter encompasses activities that indirectly raise productivity but are not directly remunerated in the market”. Alternatively, equation [2] can be rewritten in intensive terms, that is, measured in hours worked, as ∆ ln Y t – ∆ ln L t = ∆ ln A t + –α K I N F, t (∆ ln K I N F, t – ∆ ln L t ) + – – +α KICT, t · (∆ ln KICT, t – ∆ ln Lt) + αKO, t · (∆ ln KO, t – ∆ ln Lt). [4]. where the growth rate of GDP per hour is decomposed into the growth rate in TFP plus the growth rate in capital intensity (weighted by her contribution). Then the growth in TFP can be derived from [4] as, – ∆ ln A t = (∆ ln Y t – ∆ ln L t ) – α KINF, t · (∆ ln K INF, t – ∆ ln L t ) + – – + αKICT, t · (∆ ln KICT, t – ∆ ln Lt) + α KO, t · (∆ ln KO, t – ∆ ln Lt). [5]. Equations [2], [3], [4] or [5] have been obtained using non-econometric procedures, which in addition to being the estimation method most frequently used in the literature, it has important advantages10. The econometric estimation of equation [1] implies usually adopting a CobbDouglas production function under constant returns to scale. Then a specific functional form is suggested for the TFP term At. Substituting this term in equation [1] and taking logs, the production function is estimated, thus obtaining the impact of different inputs on output. Additionally, based on those results, the level of TFP and the sources of growth can be estimated11.. 3. Results of previous studies Several studies have analyzed the sources of economic growth for Spain as a whole. However, very few have studied the sources of growth for the autonomous communities and provinces of Spain. Additionally, the results of those studies differ due to the methodologies (econometric or not)12, and data sets (provided by international, natio10. The main advantage of the econometric method is that there is no need to assume that the marginal social product of inputs coincide with the observed prices of inputs. However, it has many disadvantages. First, the growth rate of inputs cannot be taken as exogenous with respect to the changes in the growth rate of TFP. Second, in case measurement errors arise in the growth rate of inputs, then the estimates would be inconsistent. This is especially relevant for capital. Finally, the regression equation should be extended so that changes in input shares and the growth rate of TFP are allowed as time evolves (Barro and Sala-i-Martin, 2004, pp. 441-442). 11 For more details, see Goerlich and Mas (2001, Chapter VI), for example. 12 Additionally, there are other minor methodological differences. For instance, some studies make some adjustment to output to exclude actual and imputed rents paid in the case of owner-occupied dwellings since residential capital is excluded [Timmer, Ypma and van Ark (2003)]. Others exclude rents from output, and the contribution of domestic service from output and employment [Mas and Quesada (2005)], for example..
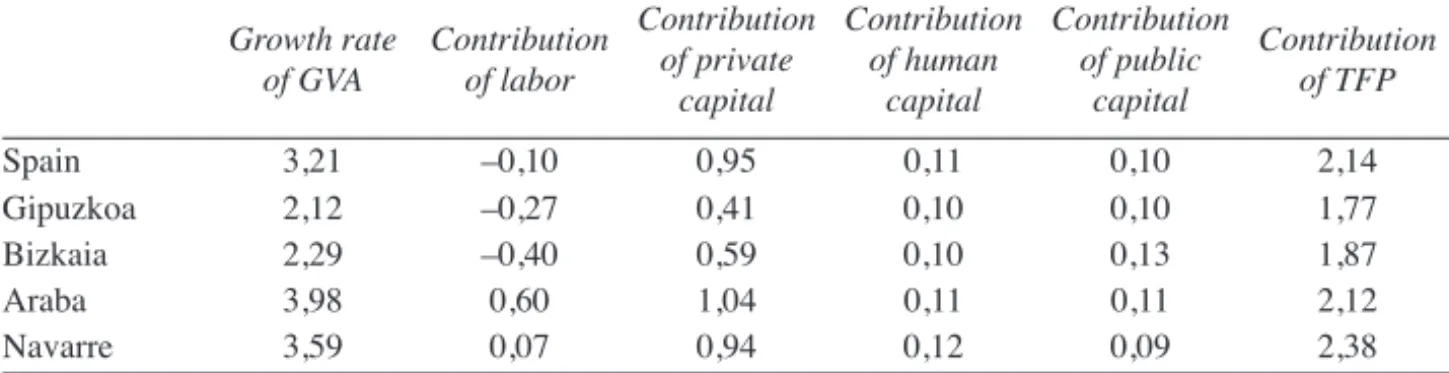
(7) 02 Erauskin. 30/5/08. 08:34. Página 41. The sources of economic growth in the Basque Country, Navarre and Spain during 1986-2004 41. nal or local statistics offices) employed and, of course, due to the different time periods analyzed. Escribá and Murgui (1998) found that the main contribution to the growth rate of gross value added (GVA) for the period 1980-1993 was explained both by the growth rate of TFP and private capital using noneconometric procedures13. The growth rate of labor played a minor role. Those results applied broadly to the private productive sector as a whole and to the 5 big private productive industries (agriculture, manufacturing, energy, construction, and private productive services) in Spain and in its autonomous communities, even though there were remarkable differences from some territories to others and from some industries to others. Gallastegui (2000) estimated the sources of growth in the Basque Country as a whole for the period 1985-1994 in 18 industries econometrically14. The evidence showed that the evolution of the stock of private productive capital, employment, the stock of public capital (infrastructures), the training of workers, and the expenditure in research and development were the variables that most contributed to the growth rate of GVA: they all explained approximately 60% of the growth rate in the Basque Country. In contrast, technological change accounted for 30% of the growth rate15. Goerlich and Mas (2001) studied the sources of economic growth for Spain as a whole and for each of the provinces in Spain based on econometric procedures16. As we can see in Table 1, the results were qualitatively quite similar to those of Escribá and Murgui (1998): the growth rate in TFP was the most important source of economic growth during 1965-1996, followed by the contribution of private capital, while the contribution of labor (and other variables such as human capital and public capital) was very low, or even negative in some territories17. Table 1.. The sources of economic growth in Spain, the historic territories of the Basque Country, and Navarre, 1965-1996 Growth rate Contribution of GVA of labor. Spain Gipuzkoa Bizkaia Araba Navarre. 3,21 2,12 2,29 3,98 3,59. –0,10 –0,27 –0,40 0,60 0,07. Contribution Contribution Contribution Contribution of private of human of public of TFP capital capital capital 0,95 0,41 0,59 1,04 0,94. 0,11 0,10 0,10 0,11 0,12. 0,10 0,10 0,13 0,11 0,09. 2,14 1,77 1,87 2,12 2,38. Source: Goerlich and Mas (2001, p. 350). 13 The regional database BD.MORES was employed in the analysis [See Dabán et al. (1998) for more details on the database]. 14 The analysis was mostly based on the data provided by Eustat (Basque Statistics Office). The data on capital stock was provided by Fundación BBV. See Appendix 1 in Gallastegui (2000) for more details. 15 The remaining 10% was due to cyclical factors and to specific variables in each industry. 16 Fundación BBVA was the main provider for the data. 17 Additionally, they found that part of the growth rate could be attributed to structural change (mainly due to the loss of agricultural employment). However, most of the evolution of the GVA was explained by the accumulation of capital, instead of the evolution in sectorial employment..
(8) 02 Erauskin. 30/5/08. 42. 08:34. Página 42. Erauskin-Iurrita, I.. Timmer, Ypma and van Ark (2003) analyzed the impact of ICT on the growth rate in the EU, comparing it with that in the US18, based on noneconometric procedures19. The EU performed worse than the US in terms of growth in the periods 1980-1995 and 1995-2001 (2,11% and 2,42% vs. 2,93% and 3,52%) (See Tables 2 and 3). The sources of growth in the EU changed very much from one period to the other. Whereas growth in output was explained mainly both by growth in TFP and capital in the period 1980-1995, the increasing contribution of labor, and not the contribution of ICT capital (even though it increased), was the main feature of the recent period in the EU. On the other hand, the contribution of all the sources to economic growth (but labor) increased in the US from one period to the other, but relative contributions maintained more or less stable. Higher labor and capital growth accounted for higher US growth in the first period, whereas capital and labor growth were the engines of growth in the second. The contribution of ICT capital to GDP growth increased both in the EU and in the US, but it was clearly higher in the US. On the other hand, the growth rate in Spain was higher than in the EU in both periods, but lower than in the US in the first period. Additionally, the sources of growth for Spain resembled very much those of the EU. However, the main contribution of TFP growth in the period 1980-1995 was stronger in Spain than in the EU (1,57% vs. 1,13%), and the increasing role of labor in the second period was even higher in Spain, thus turning negative the growth in TFP, 1,16%-point behind that of the EU (–0,62% vs. 0,46%). The contribution of ICT capital increased a meager 0,01%-point in Spain from the first period to the second. Table 2. The sources of GDP growth in Spain, the EU, and the US, 1980-1995. Spain EU US. GDP growth. Contribution of labor. Contribution of ICT capital. Contribution of non-ICT capital. Contribution of TFP. 2,49 2,11 2,93. –0,30 –0,16 1,10. 0,27 0,32 0,55. 0,94 0,83 0,58. 1,57 1,13 0,70. Source: Timmer, Ypma and van Ark (2003, p. 51).. Table 3. The sources of GDP growth in Spain, the EU, and the US, 1995-2001. Spain EU US. GDP growth. Contribution of labor. Contribution of ICT capital. Contribution of non-ICT capital. Contribution of TFP. 3,67 2,42 3,52. 2,77 0,69 1,13. 0,28 0,46 0,82. 1,24 0,81 0,75. -0,62 0,46 0,82. Source: Timmer, Ypma and van Ark (2003, p. 51). 18. See Jorgenson, Ho and Stiroh (2005) for a recent survey on the impact of ICT on economic growth in the US. 19 The analysis was mainly based on the data provided by the OECD (Organisation for Economic Cooperation and Development) and National Statistics Offices. More details can be found in Source Appendix 1 and Source Appendix 2 in Timmer, Ypma and van Ark (2003)..
(9) 02 Erauskin. 30/5/08. 08:34. Página 43. The sources of economic growth in the Basque Country, Navarre and Spain during 1986-2004 43. Focusing on the sources of labor productivity growth, “the story is different”, as Timmer, Ypma and van Ark (2003, p. 12) put it. Tables 4 and 5 show the results. The broader picture is nicely summed up by O’Mahony and van Ark (2003, p. 17) in the introduction of one of their recent studies: “Since the mid 1990s the average growth rates of real GDP, labour productivity and total factor productivity in the European Union have fallen behind those in the United States. What makes this remarkable is that this is the first time since World War II that these performance measures have shown lower growth rates for the EU for several years in a row.” In the period 19801995 the higher growth rate in the EU was mainly based on the higher contributions of TFP and non-ICT capital deepening, much higher than those of the US. In the recent period the lower growth rate in the EU was explained by lower contributions of TFP and ICT capital deepening than in the US. The performance of labor productivity growth for Spain was again quite similar and more extreme than that for the EU. In the period 1980-1995, when the EU grew more than the US, Spain (2,78%) grew even more than the EU: the contribution of TFP fuelled higher growth. In the period 1995-2001, when the EU grew less than the US, Spain (–0,40%) grew even less than the EU: the contribution of capital deepening (both ICT and non-ICT) was very low and that of TFP was even negative. Table 4.. Spain EU US. The sources of growth for GDP per hour in Spain, the EU and the US, 1980-1995 Growth GDP per hour. Contribution of ICT capital per hour. Contribution of non-ICT capital per hour. Contribution of TFP. 2,78 2,33 1,37. 0,27 0,32 0,48. 0,93 0,88 0,19. 1,57 1,13 0,70. Source: Timmer, Ypma, and van Ark (2003, p. 52).. Table 5.. Spain EU US. The sources of growth for GDP per hour in Spain, the EU, and the US, 1995-2001 Growth GDP per hour. Contribution of ICT capital per hour. Contribution of non-ICT capital per hour. Contribution of TFP. –0,36 1,37 1,87. 0,17 0,42 0,72. 0,09 0,48 0,33. -0,62 0,46 0,82. Source: Timmer, Ypma, and van Ark (2003, p. 52).. The impact of ICT capital on economic growth for the period 1985-2002 was studied by Mas and Quesada (2005) using noneconometric procedures20. The results for 20. The data on National Accounts is based mainly on INE (National Statistics Institute of Spain) and capital stock is provided by Fundación BBVA ..
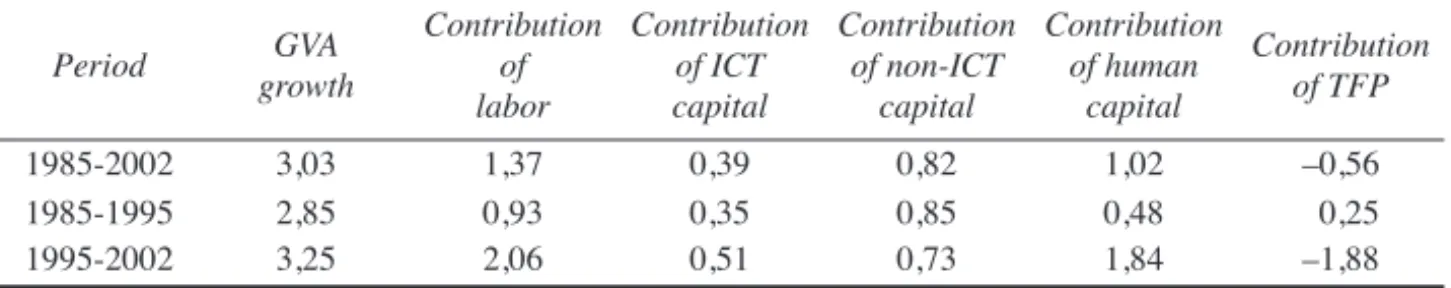
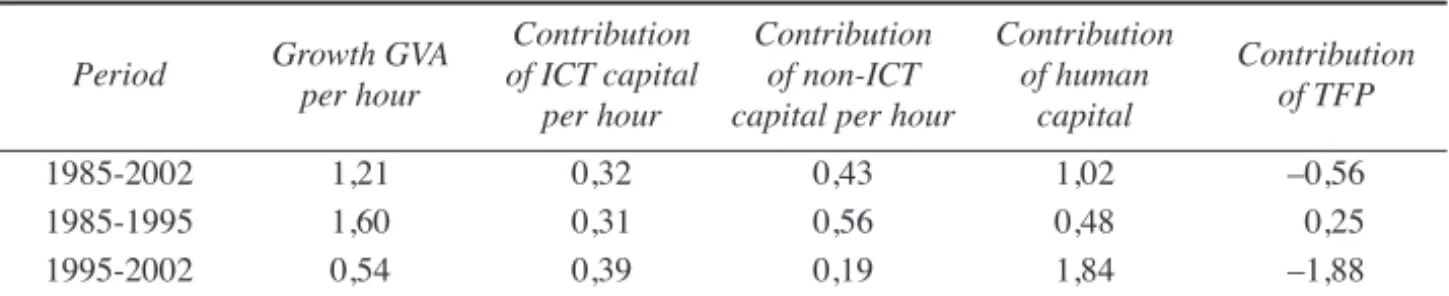
(10) 02 Erauskin. 30/5/08. 44. 08:34. Página 44. Erauskin-Iurrita, I.. output growth (Table 6) are broadly similar to those by Timmer, Ypma and van Ark (2003): GVA growth was around 3% and two were the main engines of growth in the whole period, labor and capital growth, both accounting for around 85% of output growth, and thus leaving a residual role for the combined contribution of TFP and human capital. However, whereas the contribution of ICT capital was around one third of the contribution of total capital in Mas and Quesada (2005)21, in the case of Timmer, Ypma and van Ark (2003) it reached around 20%. More similarities are also found if we focus on the results for the two subperiods. Important changes took place in the sources of growth between 1985-1995 and 1995-2002. While (non-ICT) capital growth was the biggest contributor to output growth in the first period, labor growth mainly backed output growth in the second. Additionally, TFP plus human capital growth declined substantially from the first period to the second. In terms of labor productivity (Table 7), capital deepening was the main contributor to the growth rate of GDP per hour, even if we consider both subperiods separately. Additionally, the recent subperiod was characterized by lower growth of output per hour, explained by lower capital deepening and much lower TFP growth, as in Timmer, Ypma and van Ark (2003). Erauskin (2005) analyzed the sources of economic growth for the Basque Country (and its historic territories), Navarre and Spain for the period 1986-2000 in the 5 big private productive industries (agriculture, energy, manufacturing, construction, and private productive services) and in the productive private sector (the 5 big private productive industries altogether). Using noneconometric procedures22, he found that output growth in the Basque Country and its historic territories, Navarre and Spain was mainly explained by the growth rates of private capital and TFP during 1986-1995. The contribution of TFP to growth was very positive. On the other hand, while labor was the main contributor to output growth in the recent period 1995-2000, the contribution of TFP growth to output growth declined substantially [as in Timmer, Ypma and van Ark (2003), and Mas and Quesada (2005)], except for Navarre. The performance of TFP was especially poor in Gipuzkoa and Araba. Table 6. Period. GVA growth. 1985-2002 1985-1995 1995-2002. 3,03 2,85 3,25. The sources of output growth in Spain. Contribution Contribution Contribution Contribution Contribution of of ICT of non-ICT of human of TFP labor capital capital capital 1,37 0,93 2,06. 0,39 0,35 0,51. 0,82 0,85 0,73. 1,02 0,48 1,84. –0,56 0,25 –1,88. Source: Mas and Quesada (2005, p. 283), and own elaboration.. 21. The weight of the contribution of ICT capital on total capital implied a much higher weight than that of the value of ICT capital stock over the total value of capital stock (Mas and Quesada, ibid., p. 285). 22 INE (National Statistics Institute of Spain) mostly provides the data on National Accounts, and Fundación BBVA on capital..
(11) 02 Erauskin. 30/5/08. 08:34. Página 45. The sources of economic growth in the Basque Country, Navarre and Spain during 1986-2004 45. Table 7.. The sources of growth for output per hour in Spain. Period. Growth GVA per hour. 1985-2002 1985-1995 1995-2002. 1,21 1,60 0,54. Contribution Contribution of ICT capital of non-ICT per hour capital per hour 0,32 0,31 0,39. 0,43 0,56 0,19. Contribution of human capital. Contribution of TFP. 1,02 0,48 1,84. –0,56 0,25 –1,88. Source: Mas and Quesada (2005, p. 283), and own elaboration.. Finally, the EU KLEMS Productivity Report, first released in March 2007, provides new data on economic growth, productivity, employment creation, and capital formation at the industry level for EU member states, Japan and the US from 1970 onwards. According to the Report23, focusing on the aggregate evidence, labor productivity slowed down since 1995 in the EU-15, from 2,4% during 1970-1995 to 1,4% during 1995-2004, with remarkable differences from some countries to others. The performance of Spain was especially poor since productivity improved only 0,3% in the period 1995-2004. On the other hand, the higher output growth rate in the EU-1024 during 1995-2004 (2,2% vs. 1,9% during 1980-1995) was backed mainly by capital (whereas the contribution of ICT capital increased in the recent period, that of non-ICT capital declined) and a higher contribution of labor. In contrast, labor was by far the main contributor of the higher output growth rate in Spain during 1995-2004. In addition, the contribution of ICT capital to output growth increased slightly in the recent period. Thus TFP growth fell significantly both in the EU and Spain, but the figure for Spain was especially disappointing, –0,9%. More evidence will be provided in Section 5.. 4.. Data Sources. The data for the EU and the US is based entirely on the recently released EU KLEMS Growth and Productivity Accounts database: gross value added, gross value added (volume indices), number of hours, labor compensation, capital compensation, ICT share, Non-ICT share, Labor services (volume indices), ICT capital services (volume indices), Non-ICT capital services (volume indices), and so on. The data on National Accounts for the Spanish territories is based on the Contabilidad Regional de España database from the Instituto Nacional de Estadística (INE), for the periods 1986-1995 (base 1986), 1995-2000 (base 1995), and 2000-2004 (base 2000): Gross Value Added at factor prices (until 1995), Gross Value Added at basic prices (from 1995 to 2000), Total Gross Value Added (from 2000 onward), GVA deflator, total employment, number of employees, gross compensation of employees, 23. Growth accounting exercises are performed using noneconometric procedures, and the data is mostly obtained from the OECD and National Statistics Offices. 24 That is, EU-15 excluding Greece, Ireland, Luxembourg, Portugal, and Sweden..
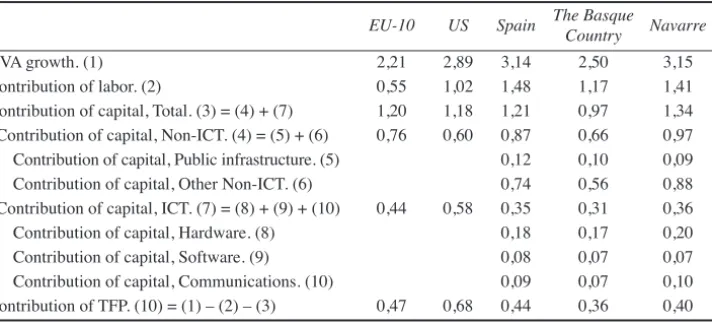
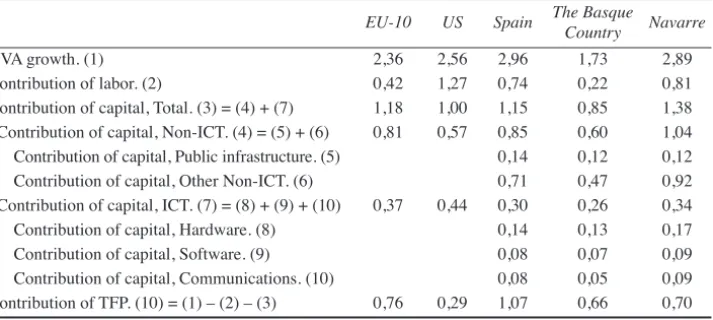
(12) 02 Erauskin. 30/5/08. 46. 08:34. Página 46. Erauskin-Iurrita, I.. and so on. The data on the number of hours worked has been obtained from the EU KLEMS database. Fundación BBVA and Instituto Valenciano de Investigaciones Económicas (FBBVA-IVIE) provide the database for the estimates of the capital stock in the Spanish territories so that the value of capital services can be computed. Mas, Pérez and Uriel (2005b) were the first estimating the capital stocks for Spain as a whole (19642002), following the new methodology suggested by the OECD (2001a; 2001b)25. The first estimates for Spain and each of its provinces (1964-2003) can be found in Mas, Pérez and Uriel (2006a). The methodology to obtain the value of capital services in this paper follows Mas, Pérez and Uriel (2005b) with the most recent data provided by Mas, Pérez and Uriel (2007) for the period 1964-2004 (disaggregated by provinces).. 5. The results The evidence on the sources of economic growth for Spain, the Basque Country, Navarre, Araba, Bizkaia and Gipuzkoa will be shown for the whole period 1986-2004, and for three subperiods, 1986-1995, 1995-2004, and 2000-2004, in order to capture the increasing importance of ICT on the performance of the economy and make reasonable comparisons with previous studies26. First, the sources of output growth for Spain, the Basque Country, and Navarre are analyzed and then the growth rates of output per hour. Additionally, they are compared to those of the EU, and the US. Second, we study the sources of growth for Araba, Bizkaia, and Gipuzkoa, comparing them to those of the Basque Country. 5.1. The evidence for the Basque Country and Navarre In the period 1986-2004 output growth was higher in Navarre and Spain than in the US and much higher than in the EU, while the Basque Country lagged behind (Table 8)27. Labor and capital growth were clearly the main engines of economic growth in Spain, the Basque Country, and Navarre, whereas, capital and labor growth did the same job in the EU and the US. Thus growth in TFP played a residual role, except for the US. The minor contribution of TFP growth contrasts with the results about the Basque Country in previous studies, such as those by Escribá and Murgui (1998), or Goerlich and Mas (2001), where growth in TFP was, by far, the fundamental variable, and to a lesser extent that by Gallastegui (2000). However, the results of this paper are broadly similar to those of a recent study by Erauskin (2005). On the other hand, the contributions of ICT capital were around 0,35%, sligthly below those for 25. See Mas, Pérez and Uriel (2006b) for a brief summary of the new methodology. Please note that no adjustment has been made for the data other than excluding residential capital from the analysis. 27 The contribution of labor includes changes in the composition of the labor force (or “quality of labor”), as well as changes in the number of hours worked in the results for the EU and the US. Additionally, the evidence on growth accounting for the EU refers only to 10 “old” European countries (EU-15 except Greece, Ireland, Luxembourg, Portugal, and Sweden). 26.
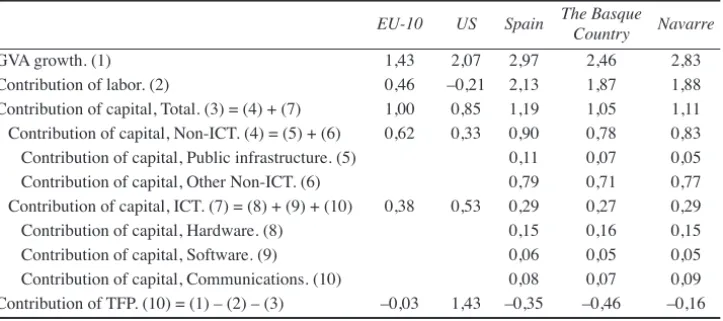
(13) 02 Erauskin. 30/5/08. 08:34. Página 47. The sources of economic growth in the Basque Country, Navarre and Spain during 1986-2004 47. Table 8.. Sources of output growth, 1986-2004. GVA growth. (1) Contribution of labor. (2) Contribution of capital, Total. (3) = (4) + (7) Contribution of capital, Non-ICT. (4) = (5) + (6) Contribution of capital, Public infrastructure. (5) Contribution of capital, Other Non-ICT. (6) Contribution of capital, ICT. (7) = (8) + (9) + (10) Contribution of capital, Hardware. (8) Contribution of capital, Software. (9) Contribution of capital, Communications. (10) Contribution of TFP. (10) = (1) – (2) – (3). EU-10. US. Spain. 2,21 0,55 1,20 0,76. 2,89 1,02 1,18 0,60. 0,44. 0,58. 0,47. 0,68. 3,14 1,48 1,21 0,87 0,12 0,74 0,35 0,18 0,08 0,09 0,44. The Basque Navarre Country 2,50 1,17 0,97 0,66 0,10 0,56 0,31 0,17 0,07 0,07 0,36. 3,15 1,41 1,34 0,97 0,09 0,88 0,36 0,20 0,07 0,10 0,40. Sources: EU KLEMS database (for the EU and the US), INE, FBBVA-IVIE database and EU KLEMS database (for other territories), and own elaboration. The contribution of labor includes the impact of changes in the composition of the labor force for the EU-10 and the US.. the EU and clearly well below those for the US. The lowest value is found in the Basque Country. Additionally, it is worth pointing out that even only the contribution of hardware in its own (above 0,15%) was higher than that of infrastructures (around 0,10%). However, other type of non-ICT capital was the main contributor (more than 60%) in total capital. The period 1986-1995 was characterized by lower output growth rates, with important differences from some territories to others: the growth rate in the Basque Country did not reach 1,8%, while the figures for other territories were above 2,3% (Table 9). Capital was the main contributor to output growth, except for the US, while the contribution of labor was low in the Basque Country and the EU. In addition, most TFP growth rates were important, and higher than in the whole period. On the contrary, in the recent period 1995-2004, high output growth was backed fundamentally by labor growth, except for the EU (Table 10). The growth in TFP declined considerably (except for the US) and it even became negative in Spain. While infrastructures contributed to output growth slightly less than in the period 1986-1995, the contributions of ICT capital increased substantially in the period 1995-2004: the Basque Country did slightly worse than Spain and Navarre. However, they all are still far from the level in the US. The most recent period 2000-2004 exhibits a gloomier performance: lower output growth rates, lower contributions of ICT capital, and more negative TFP growth rates in most cases (Table 11). In terms of labor productivity, growth rates of output per hour were above 1,20% in the whole period 1986-2004, except for the Basque Country (Table 12). Capital deepening (non-ICT primarily) was, in general, the most important source of labor productivity growth, still leaving some role to TFP growth28. ICT capital contributed 28. The contribution of labor composition per hour calculates the impact of changes in the composition of the labor force (in terms of hours worked) for the EU-10 and the US again..
(14) 02 Erauskin. 30/5/08. 48. 08:34. Página 48. Erauskin-Iurrita, I.. Table 9.. Sources of output growth, 1986-1995. GVA growth. (1) Contribution of labor. (2) Contribution of capital, Total. (3) = (4) + (7) Contribution of capital, Non-ICT. (4) = (5) + (6) Contribution of capital, Public infrastructure. (5) Contribution of capital, Other Non-ICT. (6) Contribution of capital, ICT. (7) = (8) + (9) + (10) Contribution of capital, Hardware. (8) Contribution of capital, Software. (9) Contribution of capital, Communications. (10) Contribution of TFP. (10) = (1) – (2) – (3). EU-10. US. Spain. 2,36 0,42 1,18 0,81. 2,56 1,27 1,00 0,57. 0,37. 0,44. 0,76. 0,29. 2,96 0,74 1,15 0,85 0,14 0,71 0,30 0,14 0,08 0,08 1,07. The Basque Navarre Country 1,73 0,22 0,85 0,60 0,12 0,47 0,26 0,13 0,07 0,05 0,66. 2,89 0,81 1,38 1,04 0,12 0,92 0,34 0,17 0,09 0,09 0,70. Sources: EU KLEMS database (for the EU and the US), INE, FBBVA-IVIE database and EU KLEMS database (for other territories), and own elaboration. The contribution of labor includes the impact of changes in the composition of the labor force for the EU-10 and the US.. Table 10.. Sources of output growth, 1995-2004. GVA growth. (1) Contribution of labor. (2) Contribution of capital, Total. (3) = (4) + (7) Contribution of capital, Non-ICT. (4) = (5) + (6) Contribution of capital, Public infrastructure. (5) Contribution of capital, Other Non-ICT. (6) Contribution of capital, ICT. (7) = (8) + (9) + (10) Contribution of capital, Hardware. (8) Contribution of capital, Software. (9) Contribution of capital, Communications. (10) Contribution of TFP. (10)=(1)-(2)-(3). EU-10. US. Spain. 2,06 0,67 1,22 0,71. 3,19 0,76 1,35 0,63. 0,51. 0,72. 0,17. 1,08. 3,33 2,23 1,28 0,88 0,11 0,77 0,39 0,22 0,07 0,10 -0,18. The Basque Navarre Country 3,28 2,12 1,10 0,73 0,08 0,65 0,36 0,21 0,06 0,09 0,06. 3,41 2,02 1,29 0,91 0,07 0,84 0,39 0,22 0,06 0,11 0,10. Sources: EU KLEMS database (for the EU and the US), INE, FBBVA-IVIE database and EU KLEMS database (for other territories), and own elaboration. The contribution of labor includes the impact of changes in the composition of the labor force for the EU-10 and the US..
(15) 02 Erauskin. 30/5/08. 08:34. Página 49. The sources of economic growth in the Basque Country, Navarre and Spain during 1986-2004 49. Table 11.. Sources of output growth, 2000-2004. GVA growth. (1) Contribution of labor. (2) Contribution of capital, Total. (3) = (4) + (7) Contribution of capital, Non-ICT. (4) = (5) + (6) Contribution of capital, Public infrastructure. (5) Contribution of capital, Other Non-ICT. (6) Contribution of capital, ICT. (7) = (8) + (9) + (10) Contribution of capital, Hardware. (8) Contribution of capital, Software. (9) Contribution of capital, Communications. (10) Contribution of TFP. (10) = (1) – (2) – (3). EU-10. US. Spain. 1,43 0,46 1,00 0,62. 2,07 –0,21 0,85 0,33. 0,38. 0,53. –0,03. 1,43. 2,97 2,13 1,19 0,90 0,11 0,79 0,29 0,15 0,06 0,08 –0,35. The Basque Navarre Country 2,46 1,87 1,05 0,78 0,07 0,71 0,27 0,16 0,05 0,07 –0,46. 2,83 1,88 1,11 0,83 0,05 0,77 0,29 0,15 0,05 0,09 –0,16. Sources: EU KLEMS database (for the EU and the US), INE, FBBVA-IVIE database and EU KLEMS database (for other territories), and own elaboration. The contribution of labor includes the impact of changes in the composition of the labor force for the EU-10 and the US.. Table 12.. Sources of growth for output per hour, 1986-2004.. GVA per hour growth. (1) Contribution of labor composition per hour (2) Contribution of capital per hour, Total. (3) = (4) + (7) Contribution of capital per hour, Non-ICT. (4) = (5) + (6) Contribution of capital per hour, Public infrastructure. (5) Contribution of capital per hour, Other Non-ICT. (6) Contribution of capital per hour, ICT. (7) = (8) + (9) + (10) Contribution of capital per hour, Hardware . (8) Contribution of capital per hour, Software. (9) Contribution of capital per hour, Communications. (10) Contribution of TFP. (9) = (1) – (2) – (3). The Basque Navarre Country. EU-10. US. Spain. 1,77 0,26 1,05 0,63. 1,66 0,21 0,77 0,24. 1,23. 0,97. 1,31. 0,42. 0,53. 0,46. 0,68. 0,79 0,51 0,08 0,43 0,28 0,16 0,06 0,06 0,44. 0,61 0,35 0,06 0,29 0,26 0,16 0,05 0,05 0,36. 0,92 0,61 0,04 0,57 0,30 0,17 0,06 0,07 0,40. Sources: EU KLEMS database (for the EU and the US), INE, FBBVA-IVIE database and EU KLEMS database (for other territories), and own elaboration. The contribution of labor composition per hour captures the impact of changes in the composition of the labor force per hour for the EU-10 and the US..
(16) 02 Erauskin. 30/5/08. 50. 08:34. Página 50. Erauskin-Iurrita, I.. 0,30% to output growth in Navarre, and less in Spain and the Basque Country: their levels are well below those for the US or the EU. Additionally, the contribution of ICT capital was higher than that of infrastructures, but lower than that of non-ICT capital (except for the US). In the period 1986-1995 higher growth rates of output per hour were fuelled by (mainly non-ICT) capital deepening and TFP growth (Table 13). In the recent period 1995-2004 output per hour grew much less than during 1986-1995, in Spain and the Basque Country especially, due to the stronger impact of labor growth (Table 14). Lower capital deepening (non-ICT especially) was the main contributor, except for the US. However, while the contribution of infrastructures and other non-ICT capital fell drastically, the contribution of ICT capital to growth increased sligthly, even though it is below the levels for the EU and the US yet. It is worth noting that the contribution of ICT capital was even higher than that for non-ICT capital in the US and in the Basque Country. However, while the Basque Country is characterized by a low contribution of non-ICT capital, the US, on the contrary, displays a high contribution of ICT capital. In addition, TFP growth was low everywhere, but the US. The most recent period 2000-2004 exhibited low growth rates in output per hour in Spain, the Basque Country, and Navarre, while the EU and the US performed much better (Table 15). Capital was generally the main source of output growth in this period: the contribution of ICT capital declined substantially in the period, while that of non-ICT capital increased slightly. The performance of TFP growth was unsatisfactory, except for the US.. Table 13.. Sources of growth for output per hour, 1986-1995.. GVA per hour growth. (1) Contribution of labor composition per hour (2) Contribution of capital per hour, Total. (3) = (4) + (7) Contribution of capital per hour, Non-ICT. (4) = (5) + (6) Contribution of capital per hour, Public infrastructure. (5) Contribution of capital per hour, Other Non-ICT. (6) Contribution of capital per hour, ICT. (7) = (8) + (9) + (10) Contribution of capital per hour, Hardware . (8) Contribution of capital per hour, Software. (9) Contribution of capital per hour, Communications. (10) Contribution of TFP. (9) = (1) – (2) – (3). The Basque Navarre Country. EU-10. US. Spain. 2,25 0,34 1,14 0,78. 0,93 0,18 0,47 0,09. 2,01. 1,43. 1,84. 0,37. 0,38. 0,76. 0,29. 0,94 0,66 0,12 0,55 0,28 0,13 0,08 0,07 1,07. 0,78 0,53 0,12 0,41 0,25 0,13 0,07 0,05 0,66. 1,14 0,83 0,09 0,74 0,31 0,16 0,08 0,07 0,70. Sources: EU KLEMS database (for the EU and the US), INE, FBBVA-IVIE database and EU KLEMS database (for other territories), and own elaboration. The contribution of labor composition per hour captures the impact of changes in the composition of the labor force per hour for the EU-10 and the US..
(17) 02 Erauskin. 30/5/08. 08:34. Página 51. The sources of economic growth in the Basque Country, Navarre and Spain during 1986-2004 51. Table 14.. Sources of growth for output per hour, 1995-2004.. GVA per hour growth. (1) Contribution of labor composition per hour (2) Contribution of capital per hour, Total. (3) = (4) + (7) Contribution of capital per hour, Non-ICT. (4) = (5) + (6) Contribution of capital per hour, Public infrastructure. (5) Contribution of capital per hour, Other Non-ICT. (6) Contribution of capital per hour, ICT. (7) = (8) + (9) + (10) Contribution of capital per hour, Hardware . (8) Contribution of capital per hour, Software. (9) Contribution of capital per hour, Communications. (10) Contribution of TFP. (9) = (1) – (2) – (3). The Basque Navarre Country. EU-10. US. Spain. 1,28 0,17 0,96 0,48. 2,39 0,24 1,07 0,39. 0,46. 0,50. 0,78. 0,64 0,35 0,03 0,32 0,69 0,29 0,19 0,04 0,06 1,08 -0,18. 0,44 0,17 0,01 0,16 0,27 0,18 0,04 0,05 0,06. 0,69 0,40 0,00 0,40 0,29 0,19 0,03 0,07 0,10. 0,47. 0,16. Sources: EU KLEMS database (for the EU and the US), INE, FBBVA-IVIE database and EU KLEMS database (for other territories), and own elaboration. The contribution of labor composition per hour captures the impact of changes in the composition of the labor force per hour for the EU-10 and the US.. Table 15.. Sources of growth for output per hour, 2000-2004.. GVA per hour growth. (1) Contribution of labor composition per hour (2) Contribution of capital per hour, Total. (3) = (4) + (7) Contribution of capital per hour, Non-ICT. (4) = (5) + (6) Contribution of capital per hour, Public infrastructure. (5) Contribution of capital per hour, Other Non-ICT. (6) Contribution of capital per hour, ICT. (7) = (8) + (9) + (10) Contribution of capital per hour, Hardware . (8) Contribution of capital per hour, Software. (9) Contribution of capital per hour, Communications. (10) Contribution of TFP. (9) = (1) – (2) – (3). The Basque Navarre Country. EU-10. US. Spain. 0,99 0,18 0,85 0,49. 2,78 0,26 1,09 0,53. 0,23. 0,04. 0,39. 0,58 0,40 0,04 0,36 0,56 0,19 0,13 0,02 0,04 1,43 –0,35. 0,51 0,31 0,02 0,30 0,19 0,13 0,02 0,04 –0,46. 0,55 0,35 0,00 0,35 0,20 0,13 0,02 0,05 –0,16. 0,36. –0,04. Sources: EU KLEMS database (for the EU and the US), INE and FBBVA-IVIE database (for other territories), and own elaboration. The contribution of labor composition per hour captures the impact of changes in the composition of the labor force per hour for the EU-10 and the US.. 5.2. The evidence for Araba, Bizkaia, and Gipuzkoa In the period 1986-2004 the growth rates of output were very similar in the Basque Country, around 2,5% (Table 16). They were mainly fuelled by labor and capital growth: TFP growth was very low. Bizkaia was an exception since TFP grew substantially due to a remarkably low contribution of (mostly non-ICT) capital. Period 1986-1995 was characterized by lower output growth rates (Table 17): the performance of Araba and Bizkaia was very poor. The growth rate of output was backed by the contribution of capital and TFP growth, whereas labor growth contributed.
(18) 02 Erauskin. 30/5/08. 52. 08:34. Página 52. Erauskin-Iurrita, I.. residually, except in Gipuzkoa. In the recent period 1995-2004 higher output growth rates were sustained by labor, and, to a lesser extent, capital growth (Table 18). TFP growth became very negative. The pattern is very different for Bizkaia: a low contribution of labor and especially capital explain the substantial positive TFP growth in Bizkaia. Additionally, the contribution of ICT capital to output growth increased considerably in the Basque Country in the period 1995-2004, in Araba and Gipuzkoa especially. The most recent period 2000-2004 exhibits even more negative growth rates in TFP (less so in Bizkaia again) due to the lower growth rates of output (Table 19). Focusing on labor productivity, in the whole period analyzed the growth rate of output per hour was around 1% or above for Araba and Bizkaia, while Gipuzkoa lagged behind (Table 20). Growth in capital deepening was the main source of growth in output per hour. In contrast, TFP growth was substantial in Bizkaia due to a much lower (non-ICT) capital deepening. Moreover, the contribution of ICT capital to the growth rate of output per hour in Bizkaia was the lowest of all territories. In the first period 1986-1995 the performance of labor productivity improved remarkably in the Basque Country, with figures around 1,4%, due to a lower growth rate of labor (Table 21). Thus growth in TFP was important in this period. The economic performance changed completely in the period 1995-2004 (Table 22): lower growth rates of output per hour and increasing contributions of (especially ICT) capital led to negative TFP growth rates. Bizkaia, on the contrary, achieved a higher growth rate than the other territories, accompanied by a high TFP growth: the contribution of capital was very low, and even the contribution of ICT capital was higher than that of non-ICT capital. It is a remarkable feature that the contribution of public infrastructures to the growth rate of output per hour fell considerably in this period, even becoming negative in Araba and Gipuzkoa. In the most recent period 2000-2004 the performance was worse since labor productivity growth fell considerably, and TFP growth became even more negative, even though less so in Bizkaia (Table 23). Table 16.. Sources of output growth, 1986-2004.. GVA growth. (1) Contribution of labor. (2) Contribution of capital, Total. (3) = (4) + (7) Contribution of capital, Non-ICT. (4) = (5) + (6) Contribution of capital, Public infrastructure. (5) Contribution of capital, Other Non-ICT. (6) Contribution of capital, ICT. (7) = (8) + (9) + (10) Contribution of capital, Hardware. (8) Contribution of capital, Software. (9) Contribution of capital, Communications. (10) Contribution of TFP. (10) = (1) – (2) – (3). The Basque Country. Araba. Bizkaia. Gipuzkoa. 2,50 1,17 0,97 0,66 0,10 0,56 0,31 0,17 0,07 0,07 0,36. 2,52 1,17 1,34 0,99 0,08 0,91 0,35 0,20 0,06 0,09 0,02. 2,36 0,94 0,76 0,48 0,11 0,37 0,28 0,16 0,07 0,06 0,65. 2,73 1,55 1,07 0,74 0,10 0,64 0,33 0,19 0,06 0,08 0,11. Sources: EU KLEMS database (for the EU and the US), INE, FBBVA-IVIE database and EU KLEMS database (for other territories), and own elaboration. The contribution of labor includes the impact of changes in the composition of the labor force for the EU-10 and the US..
(19) 02 Erauskin. 30/5/08. 08:34. Página 53. The sources of economic growth in the Basque Country, Navarre and Spain during 1986-2004 53. Table 17.. Sources of output growth, 1986-1995.. GVA growth. (1) Contribution of labor. (2) Contribution of capital, Total. (3) = (4) + (7) Contribution of capital, Non-ICT. (4) = (5) + (6) Contribution of capital, Public infrastructure. (5) Contribution of capital, Other Non-ICT. (6) Contribution of capital, ICT. (7) = (8) + (9) + (10) Contribution of capital, Hardware. (8) Contribution of capital, Software. (9) Contribution of capital, Communications. (10) Contribution of TFP. (10) = (1) – (2) – (3). The Basque Country 1,73 0,22 0,85 0,60 0,12 0,47 0,26 0,13 0,07 0,05 0,66. Araba. Bizkaia. Gipuzkoa. 1,69 0,13 1,05 0,78 0,09 0,69 0,28 0,14 0,06 0,07 0,51. 1,38 –0,06 0,74 0,50 0,13 0,37 0,24 0,12 0,07 0,05 0,69. 2,32 0,71 0,91 0,64 0,12 0,52 0,27 0,14 0,07 0,06 0,70. Sources: EU KLEMS database (for the EU and the US), INE, FBBVA-IVIE database and EU KLEMS database (for other territories), and own elaboration. The contribution of labor includes the impact of changes in the composition of the labor force for the EU-10 and the US.. Table 18.. Sources of output growth, 1995-2004.. GVA growth. (1) Contribution of labor. (2) Contribution of capital, Total. (3) = (4) + (7) Contribution of capital, Non-ICT. (4) = (5) + (6) Contribution of capital, Public infrastructure. (5) Contribution of capital, Other Non-ICT. (6) Contribution of capital, ICT. (7) = (8) + (9) + (10) Contribution of capital, Hardware. (8) Contribution of capital, Software. (9) Contribution of capital, Communications. (10) Contribution of TFP. (10) = (1) – (2) – (3). The Basque Country 3,28 2,12 1,10 0,73 0,08 0,65 0,36 0,21 0,06 0,09 0,06. Araba. Bizkaia. Gipuzkoa. 3,36 2,20 1,63 1,21 0,07 1,13 0,43 0,25 0,07 0,11 -0,48. 3,33 1,94 0,78 0,46 0,08 0,38 0,32 0,19 0,06 0,07 0,61. 3,14 2,38 1,23 0,84 0,07 0,76 0,40 0,23 0,06 0,11 -0,47. Sources: EU KLEMS database (for the EU and the US), INE, FBBVA-IVIE database and EU KLEMS database (for other territories), and own elaboration. The contribution of labor includes the impact of changes in the composition of the labor force for the EU-10 and the US.. Table 19.. Sources of output growth, 2000-2004.. GVA growth. (1) Contribution of labor. (2) Contribution of capital, Total. (3) = (4) + (7) Contribution of capital, Non-ICT. (4) = (5) + (6) Contribution of capital, Public infrastructure. (5) Contribution of capital, Other Non-ICT. (6) Contribution of capital, ICT. (7) = (8) + (9) + (10) Contribution of capital, Hardware. (8) Contribution of capital, Software. (9) Contribution of capital, Communications. (10) Contribution of TFP. (10) = (1) – (2) – (3). The Basque Country 2,46 1,87 1,05 0,78 0,07 0,71 0,27 0,16 0,05 0,07 –0,46. Araba. Bizkaia. Gipuzkoa. 2,7F1 1,78 1,82 1,50 0,07 1,43 0,31 0,18 0,05 0,09 –0,88. 2,36 1,86 0,77 0,52 0,06 0,46 0,25 0,14 0,05 0,06 –0,27. 2,50 1,93 1,05 0,75 0,07 0,68 0,30 0,17 0,04 0,08 –0,48. Sources: EU KLEMS database (for the EU and the US), INE, FBBVA-IVIE database and EU KLEMS database (for other territories), and own elaboration. The contribution of labor includes the impact of changes in the composition of the labor force for the EU-10 and the US..
(20) 02 Erauskin. 30/5/08. 54. 08:34. Página 54. Erauskin-Iurrita, I.. Table 20.. Sources of growth for output per hour, 1986-2004. GVA per hour growth. (1) Contribution of labor composition per hour (2) Contribution of capital per hour, Total. (3) = (4) + (7) Contribution of capital per hour, Non-ICT. (4) = (5) + (6) Contribution of capital per hour, Public infrastructure. (5) Contribution of capital per hour, Other Non-ICT. (6) Contribution of capital per hour, ICT. (7) = (8) + (9) + (10) Contribution of capital per hour, Hardware . (8) Contribution of capital per hour, Software. (9) Contribution of capital per hour, Communications. (10) Contribution of TFP. (9) = (1) – (2) – (3). The Basque Araba Bizkaia Gipuzkoa Country 0,97 0,98 1,11 0,74 0,61 0,35 0,06 0,29 0,26 0,16 0,05 0,05 0,36. 0,96 0,66 0,04 0,62 0,30 0,18 0,05 0,07 0,02. 0,46 0,22 0,08 0,14 0,24 0,15 0,05 0,04 0,65. 0,63 0,36 0,04 0,32 0,27 0,17 0,05 0,05 0,11. Sources: EU KLEMS database (for the EU and the US), INE, FBBVA-IVIE database and EU KLEMS database (for other territories), and own elaboration. The contribution of labor composition per hour captures the impact of changes in the composition of the labor force per hour for the EU-10 and the US.. Table 21.. Sources of growth for output per hour, 1986-1995.. GVA per hour growth. (1) Contribution of labor composition per hour (2) Contribution of capital per hour, Total. (3) = (4) + (7) Contribution of capital per hour, Non-ICT. (4) = (5) + (6) Contribution of capital per hour, Public infrastructure. (5) Contribution of capital per hour, Other Non-ICT. (6) Contribution of capital per hour, ICT. (7) = (8) + (9) + (10) Contribution of capital per hour, Hardware . (8) Contribution of capital per hour, Software. (9) Contribution of capital per hour, Communications. (10) Contribution of TFP. (9) = (1) – (2) – (3). The Basque Araba Country 1,43 1,53 0,78 0,53 0,12 0,41 0,25 0,13 0,07 0,05 0,66. 1,02 0,75 0,09 0,66 0,27 0,14 0,06 0,07 0,51. Bizkaia Gipuzkoa 1,45. 1,38. 0,75 0,51 0,14 0,37 0,24 0,13 0,07 0,05 0,69. 0,69 0,45 0,09 0,35 0,24 0,13 0,06 0,05 0,70. Sources: EU KLEMS database (for the EU and the US), INE, FBBVA-IVIE database and EU KLEMS database (for other territories), and own elaboration. The contribution of labor includes the impact of changes in the composition of the labor force for the EU-10 and the US.. Table 22.. Sources of growth for output per hour, 1995-2004.. GVA per hour growth. (1) Contribution of labor composition per hour (2) Contribution of capital per hour, Total. (3) = (4) + (7) Contribution of capital per hour, Non-ICT. (4) = (5) + (6) Contribution of capital per hour, Public infrastructure. (5) Contribution of capital per hour, Other Non-ICT. (6) Contribution of capital per hour, ICT. (7) = (8) + (9) + (10) Contribution of capital per hour, Hardware . (8) Contribution of capital per hour, Software. (9) Contribution of capital per hour, Communications. (10) Contribution of TFP. (9) = (1) – (2) – (3). The Basque Araba Bizkaia Gipuzkoa Country 0,50 0,42 0,78 0,10 0,44 0,17 0,01 0,16 0,27 0,18 0,04 0,05 0,06. 0,90 0,57 –0,01 0,58 0,32 0,21 0,04 0,07 –0,48. 0,17 –0,06 0,02 –0,09 0,23 0,17 0,04 0,03 0,61. 0,57 0,28 –0,01 0,28 0,30 0,20 0,03 0,06 –0,47. Sources: EEU KLEMS database (for the EU and the US), INE, FBBVA-IVIE database and EU KLEMS database (for other territories), and own elaboration. The contribution of labor composition per hour captures the impact of changes in the composition of the labor force per hour for the EU-10 and the US..
(21) 02 Erauskin. 30/5/08. 08:34. Página 55. The sources of economic growth in the Basque Country, Navarre and Spain during 1986-2004 55. Table 23.. Sources of growth for output per hour, 2000-2004.. GVA per hour growth. (1) Contribution of labor composition per hour (2) Contribution of capital per hour, Total. (3) = (4) + (7) Contribution of capital per hour, Non-ICT. (4) = (5) + (6) Contribution of capital per hour, Public infrastructure. (5) Contribution of capital per hour, Other Non-ICT. (6) Contribution of capital per hour, ICT. (7) = (8) + (9) + (10) Contribution of capital per hour, Hardware (8) Contribution of capital per hour, Software. (9) Contribution of capital per hour, Communications. (10) Contribution of TFP. (9) = (1) – (2) – (3). The Basque Araba Bizkaia Gipuzkoa Country 0,04 0,33 -0,05 0,06 0,51 0,31 0,02 0,30 0,19 0,13 0,02 0,04 –0,46. 1,22 0,99 0,02 0,97 0,23 0,15 0,02 0,05 –0,88. 0,22 0,05 0,01 0,04 0,16 0,12 0,02 0,02 –0,27. 0,53 0,32 0,02 0,30 0,21 0,14 0,02 0,05 –0,48. Sources: EU KLEMS database (for the EU and the US), INE and FBBVA-IVIE database (for other territories), and own elaboration. The contribution of labor composition per hour captures the impact of changes in the composition of the labor force per hour for the EU-10 and the US.. 6. Conclusions The average growth rates of labor productivity and TFP have performed poorly since the mid 1990s in Spain and in the EU. This is a very worrying issue since the rate of growth of TFP is related to the rate of growth of technological change. More precisely, the growth of TFP is equal to the growth rate of output minus the growth rate of inputs, such as labor (number of hours worked by the labor force) and capital (value of the services capital assets provided to the economy, computed through the FBBVA-IVIE database), weighted by their respective contributions, through growth accounting. However, few studies have decomposed the contribution of inputs and TFP to the economic growth in the Basque Country and Navarre. This paper studies the sources of economic growth in the Basque Country and its three historic territories, Navarre, and Spain during 1986-2004, comparing them with those of the EU and the US, and paying special attention to the role of public infrastructures and ICT capital on growth. The main conclusions can be divided into six categories. First, the rates of growth of output were generally higher in the period 1995-2004 than during 1986-1995. However, the most recent period 2000-2004 showed a poorer performance. Additionally, output grew more in Navarre and Spain than in the US, and much more than in the EU, in all the periods considered. On the other hand, while the growth rate in the Basque Country was lower than that for the US in the first period, it was higher than in the US during 1995-2004 (even though it was somewhat lower than that in Navarre or Spain). Second, labor and capital were generally the main engines of output growth during 1986-2004. TFP growth played a residual role. Additionally, while the contribution of labor increased substantially in the recent period 1995-2004, the growth in TFP declined drastically in most territories (except the US) and it even turned nega-.
(22) 02 Erauskin. 30/5/08. 56. 08:34. Página 56. Erauskin-Iurrita, I.. tive in some of them. The performance of Spain, the Basque Country, and Navarre was especially poor. This contrasts with most previous studies for the Basque Country, where the growth in TFP was crucial, but it coincides with some recent work. Only Bizkaia gets a positive TFP growth rate in the Basque Country due to lower contributions of capital and labor during 1995-2004. The results for the most recent period 2000-2004 are even gloomier for TFP growth. Third, the contribution of infrastructures to output growth was around 0,10% in the period 1986-2004, and it declined in the recent period 1995-2004. Fourth, ICT capital contributed approximately 0,35% to output growth during 1986-2004. Navarre and Spain were the highest contributors, while the Basque Country had lower figures (the contribution in Bizkaia only reached 0,28%). Additionally, the contribution of ICT capital (or even hardware in its own) to output growth was higher than that of infrastructures. Most of these numbers were slightly below those for the EU, and undoubtedly below the contribution in the US. The numbers increased during 1995-2004 in all the territories, and considerably in Araba, and Gipuzkoa, but they declined substantially in the recent period 2000-2004. Fifth, labor productivity generally grew above 1,20% during 1986-2004, while the Basque Country lagged behind. Growth in (primarily non-ICT) capital deepening was the main contributor to the growth rate of output per hour. The contribution of ICT capital to output growth was around 0,28%, which is far from that for the EU, and still further from that for the US. Additionally, it is much higher than the contribution of infrastructures. While the period 1986-1995 exhibited a better performance, the recent period 1995-2004 showed lower and more unequal growth rates of output per hour, especially worrying for Gipuzkoa. Growth in capital intensity, backed by an increasing contribution of ICT capital (in Araba and Gipuzkoa especially), was again the main source of growth in output per hour. Bizkaia shows a different pattern of growth: a somewhat higher growth rate was fuelled mainly by TFP growth since the contribution of (mostly non-ICT) capital deepening was very low. The situation for the most recent period 2000-2004 is worse than for the period 1995-2004: lower growth rates of output per hour, more negative growth rates of TFP, and lower contributions of ICT capital to output. Summing up, the results of the study show that poor labor productivity and TFP growth are serious weaknesses for the Basque Country, Navarre, and Spain since high output growth has been accompanied by high labor growth in the recent period 1995-2004. However, the increasing contribution of ICT capital (even though it seems to decay in the last few years), and the sustained contribution of non-ICT capital (including infrastructures) to output growth over the whole period are important strengths in the growth process for the territories analyzed.. References Abramowitz, M. (1956): “Resource and output trends in the United States since 1870”. American Economic Review, 46(2):5-23. Arndt, H.W. (1964): “The residual factor.” in U.N. Economic Commission for Europe, ed., Economic survey of Europe in 1961, Part II: Some factors in economic growth in Europe in the 1950s, pp. 1-9..
(23) 02 Erauskin. 30/5/08. 08:34. Página 57. The sources of economic growth in the Basque Country, Navarre and Spain during 1986-2004 57. Geneva: United Nations. Reimpressed in H.W. Arndt, 50 years of Development Studies (Camberra, Australian National University, 1993), pp. 53-59. Barro, R. J. and Sala-i-Martín, X. (2004): Economic growth. Second edition. McGraw-Hill, New York. Bosworth, B. P. and Collins, S. M. (2003): “The empirics of growth: an update”. Brookings Papers on Economic Activity, 2:113-179. Dabán-Sánchez, T., Díaz-Ballesteros, A., Escribá-Pérez, F.J. and Murgui-García. M.J. (1998): La base de datos BD.MORES. Working paper D-98001. Downloadable at http://www.sgpg.pap.meh.es/SGPG/ Cln_Principal/Presupuestos/Documentacion/Documentosdetrabajo.htm (Secretaría de Estado de Hacienda y Presupuestos). Escribá-Pérez, F.J. and Murgui-García, M. J. (1998): La productividad total de los factores entre sectores y regiones de la economía española (1980-1993). Working paper D-98005. Downloadable at http:// www.sgpg.pap.meh.es/SGPG/Cln_Principal/Presupuestos/Documentacion/Documentosdetrabajo.htm (Secretaría de Estado de Hacienda y Presupuestos). Escribá-Pérez, F.J. and Murgui-García, M. J. (2007): Análisis sectorial de la productividad total de los factores en la economía española (1980-2003). Working paper D-2007-01. Downloadable at http:// www.sgpg.pap.meh.es/SGPG/Cln_Principal/Presupuestos/Documentacion/Documentosdetrabajo.htm (Secretaría de Estado de Hacienda y Presupuestos). Erauskin-Iurrita, I. (2005): “Las fuentes del crecimiento económico en la Comunidad Autónoma del País Vasco, la Comunidad Foral de Navarra y España durante el período 1986-2000”. Unpublished manuscript. EUKLEMS Database, March 2007, see Marcel Timmer, Mary O’Mahony & Bart van Ark, The EU KLEMS Growth and Productivity Accounts: an overview, University of Groningen & University of Birmingham; downloadable at www.euklems.net. Gallastegui-Zulaica, I. (Dir.) (2000): El crecimiento económico vasco. Aproximación a sus factores explicativos. Caja Laboral Popular, Mondragón, Spain. Goerlich-Gisbert, F.J. and Mas-Ivars, M. (2001): La evolución económica de las provincias españolas (1955-1998). Volumen I: Capitalización y crecimiento. Fundación BBVA, Bilbao, Spain. Griliches, Z. (2000): R&D, education, and productivity. A retrospective. Harvard University Press, Cambridge, Massachusetts. Gual, J., Jódar-Rosell, S. and Ruiz-Posino, Á. (2006): El problema de la productividad en España. ¿Cuál es el papel de la regulación?. Documentos de Economía de “La Caixa”. Available at http://www.pdf.lacaixa.comunicacions.com/de/esp/de01_esp.pdf Helpman, E. (2004): The mistery of economic growth. The Belknap press of Harvard University Press, Cambridge, Massachusetts. Hulten, C.R. (2001): “Total factor productivity: a short biography”, in Hulten, C.R., E.R. Dean and M.J. Harper (Eds.) (2001). New developments in productivity analysis. National Bureau of Economic Research, Conference on research in income and wealth. The University of Chicago Press, Chicago. Instituto Nacional de Estadística. Contabilidad regional de España. Downloadable at www.ine.es Jorgenson, D.W. and Griliches, Z. (1967): “The explanation of productivity change”, Review of economic studies, 34:249-283. Jorgenson, Dale W., Mun S. Ho and Stiroh, K.J. (2005): Productivity. Volume 3: Information technology and the American growth resurgence. MIT Press, Cambridge, Massachussets. Mas-Ivars, M. (2006): “Infrastructures and ICT: measurement issues and impact on economic growth”. EU KLEMS working paper series (no. 12). Downloadable at www.euklems.net . Más-Ivars, M. and Quesada-Ibáñez, J. (Dirs.) (2005): Las nuevas tecnologías y el crecimiento económico en España. Fundación BBVA, Bilbao, Spain. Mas-Ivars, M. and Schreyer, P. (Eds.) (2006): Growth, capital and new technologies. Fundación BBVA, Bilbao, Spain. Más-Ivars, M., Pérez-García, F. and Uriel-Jiménez, E. (2005a): El stock de capital en España y su distribución territorial (1964-2002). Fundación BBVA, Bilbao, Spain. Mas-Ivars, M., Pérez-García, F. and Uriel-Jiménez, E. (2005b): El stock y los servicios de capital en España (1964-2002). Nueva metodología. Fundación BBVA, Bilbao, Spain. Mas-Ivars, M., Pérez-García, F. and Uriel-Jiménez, E. (2006a): El stock y los servicios de capital en España y su distribución territorial (1964-2003). Nueva metodología. Fundación BBVA, Bilbao, Spain..
(24) 02 Erauskin. 30/5/08. 58. 08:34. Página 58. Erauskin-Iurrita, I.. Mas-Ivars, M., Pérez-García, F. and Uriel-Jiménez, E. (2006b): “Capital stocks in Spain, 1964-2002”. New estimates”, in Mas-Ivars, Matilde; and Paul Schreyer (Eds.) (2006). Growth, capital and new technologies: 67-91. Mas-Ivars, M., Pérez-García, F. and Uriel-Jiménez, E. (2007): El stock y los servicios de capital en España y su distribución territorial (1964-2005). Nueva metodología. Fundación BBVA, Bilbao, Spain. OECD (2001a): Measuring capital. Measurement of capital stocks, consumption of fixed capital and capital services. OECD Manual, Paris. OECD (2001b): Measuring productivity. Measurement of aggregate and industry-level productivity growth. OECD Manual, Paris. O’Mahony, M. and van Ark, B. (Eds.) (2003): EU productivity and competitiveness: an industry perspective. Can Europe resume the catching-up process? European Commission, Office for Official Publications of the European Communities, Luxembourg. Sapir, A., Aghion, P., Bertola, G., Hellwig, M., Pisani-Ferry, J., Rosati, D., Viñals, J. and Wallace, H. (2004): An agenda for a growing Europe: the Sapir report. Oxford University Press, Oxford, United Kingdom. Solow, R. M. (1957): “Technical change and the aggregate production function”, Review of economics and statistics, 39(august): 312-320. Timmer, M., Ypma, G. and van Ark, B. (2003): “IT in the European Union: Driving productivity divergence?”. Research Memorandum GD-67, Groningen Growth and Development Centre, Netherlands. Memorandum downloadable at http://www.ggdc.net/pub/online/gd67(online).pdf. Appendix database downloadable at http://www.ggdc.net. Timmer, M., O’Mahony, M. and van Ark, B. The EU KLEMS Growth and Productivity Accounts: An overview, University of Groningen & University of Birmingham, March 2007. Downloadable at www.euklems.net. Timmer, M., van Moergastel, T., Stuivenwold, E., Ypma, G., O’Mahony, G. and Kangasniemi, M. (Prepared by them on behalf of the EU KLEMS consortium) (2007): EU KLEMS growth and productivity accounts. Version 1.0. Part I Methodology. Groningen Growth and Development Centre and National Institute of Economic and Social Research. Downloadable at www.euklems.net. Vaizey, J. et al. (Study group in the economics of education) (1964): The residual factor and economic growth. OECD, Paris. Van Ark, B., O’Mahony, M. and Ypma, G. (Edited by them with contributions of individual consortium members) (March 2007): The EU KLEMS Productivity Report. Issue 1. University of Groningen & University of Birmingham, March 2007. Downloadable at www.euklems.net..
(25)
Figure


+7


Documento similar
Modern irrigation is transforming traditional water irrigation norms and therefore it is critical to understand how the access mechanisms to assets (natural, financial, social),
Keywords: Metal mining conflicts, political ecology, politics of scale, environmental justice movement, social multi-criteria evaluation, consultations, Latin
In the previous sections we have shown how astronomical alignments and solar hierophanies – with a common interest in the solstices − were substantiated in the
Even though the 1920s offered new employment opportunities in industries previously closed to women, often the women who took these jobs found themselves exploited.. No matter
Government policy varies between nations and this guidance sets out the need for balanced decision-making about ways of working, and the ongoing safety considerations
No obstante, como esta enfermedad afecta a cada persona de manera diferente, no todas las opciones de cuidado y tratamiento pueden ser apropiadas para cada individuo.. La forma
In this present work, inspired of the over and under projection with a fixed ratio methods, proposed by Agmon, we consider a class of extended relaxation methods depending on
The Dwellers in the Garden of Allah 109... The Dwellers in the Garden of Allah
