Impact of acidification and protein fortification on rheological
and thermal properties of wheat, corn, potato and tapioca
starch-based gluten-free bread doughs
Marina Villanueva
1, Sandra Pérez-Quirce
1, Concha Collar
2, Felicidad Ronda
11 Department of Agriculture and Forestry Engineering, Food Technology, College of Agricultural and Forestry
Engineering, University of Valladolid, Av. Madrid, 44, 34004 Palencia, Spain.
2 Cereals and Cereal-based Products, Food Science Department, Instituto de Agroquímica y Tecnología de
Alimentos, IATA-CSIC, Avda. Catedrático Agustín Escardino 7, 46980 Paterna, Spain.
Abstract
The study of new gluten-free (GF) foods is necessary since consumers intolerant to gluten are more and more frequently diagnosed. The study evaluated the impact of acidification -with acetic+lactic blend at 0.5 g/100 g level- and protein fortification -with caseinate (CA) or soy-protein isolate (SPI)- on the rheological features of wheat, corn, potato and tapioca starch-based bread doughs. Oscillatory and creep-recovery tests were carried out to characterise their viscoelastic behaviour, and thermomechanical tests were performed to assess their visco-metric performance. Dough stickiness was also measured. The acid blend had a modulator effect on dough rheological properties that depended on both the type of protein and the source of the starch. Proteins structured and strengthened the doughs especially those made with SPI-potato starch and CA-wheat starch mixtures. Acidification decreased G’ and G’’ moduli until 70% with respect to unacidified doughs. The effect was much more marked in protein-fortified doughs. A significant increase in all pasting viscosities was observed with protein addition, particularly in the case of CA. In general, protein addition decreased dough stickiness whereas the opposite effect was noted with the presence of acid. Acidification of protein-enriched starch matrices modulate dough rheological properties which are of relevance in GF products development.
Keywords: Acetic acid; Gluten-Free Doughs; Lactic acid; Proteins; Rheology
1. Introduction
The development of products for consumers with gluten-related disorders constitutes a prioritized and challenging topic in starch-based goods area. In addition to diagnosed patients, also people looking for non allergenic ingredients contribute to a growing GF market category; therefore the risen variety of offered items seems to be an imperious need.
properties of doughs also inform about interactions among ingredients and the creation of structure at macromolecular and macroscopic levels, respectively (Ronda, Villanueva, & Collar, 2014).
Gluten protein matrix is a key factor in breadmaking. Besides contributing to the water absorption capacity of the dough, gluten provides extensibility, elasticity and cohesiveness to bread dough allowing the fermentation gas to be occluded and maintained in the liquid phase during the dough development, leading to well-developed high-grade breads (Wieser, 2007). The elimination of gluten in baked products results in deleterious effects in terms of quality attributes of products, nutritional characteristics, and consumer acceptance (Naqash, Gani, Gani, & Masoodi, 2017). The most commonly used starches in GF bread-making are maize starch and potato starch but also starches from tapioca, wheat and rice among other (Masure, Fierens, & Delcour, 2016). However, these starches have minimal structure-building potential and, thus, are frequently used along with proteins and hydrocolloids (Capriles & Arêas, 2014). Proteins and polysaccharides are present together in many kinds of food systems, and both types of food macromolecules contribute to the structure, texture and stability of food through their thickening or gelling behaviour and surface properties (Doublier, Garnier, Renard, & Sanchez, 2000). The incorporation of proteins in GF matrices is focused on the nutritional enhancement and on the improvement of bread final characteristics (physical and textural).
Inter- and intra-molecular interactions established between exogenous proteins and starch molecules, main responsible for dough structuring, certainly depend on dough pH (Houben, Höchstötter, & Becker, 2012; Ronda et al., 2014). Acidification through lactic and acetic acid addition confers suitable properties to final breads either when produced by the exogenous microflora or added to breadmaking matrices Acidification improved the odour and taste of fresh bread and increased the protease and amylase activities that led to retarded staling during storage (Moore, Dal Bello, & Arendt, 2008). Acidification by acetic acid and lactic acid addition have shown to provide a significant impact in protein-enriched rice starch-based doughs properties (Ronda et al., 2014) and in the quality and shelf-life of rice starch-based breads fortified with CA, SPI and pea protein isolate (Villanueva, Mauro, Collar, & Ronda, 2015). Taken into account the importance of other starches, as potato, tapioca, corn and wheat, on the development of GF products, the study of the effect of acidification on protein-enriched doughs made with theses starches seems timely.
In GF products, starch becomes the primary structural element due to the lack of gluten, mainly during the baking stage, when the batter temperature reaches starch gelatinization values. However, starches from different sources differ markedly on water binding capacity which affects dramatically dough consistency and dough development during fermentation, and the quality of the final products (Ronda et al., 2017). With this in mind, the aim of the present study was to evaluate the impact of the addition of 0.5 g/100 g (starch+protein) of acetic + lactic acid mixture to different GF bread doughs made with maize, potato, tapioca or wheat starches fortified with CA or SPI (at 5 g/100 g (starch+protein) level) on the viscoelasticity, stickiness and pasting properties of bread doughs.
2. Material and methods
2.1. Materials
Hydroxy-propyl-methyl-cellulose (HPMC, Methocel-K4M-Food-Grade) was provided as a gift by Dow Chemical (Midland, USA). Proteins used in GF formulations were: soybean protein isolate (SPI) Supro 500-E IP given by Proveedora hispano-holandesa S.A. (Barcelona, Spain) and calcium caseinate (CA) by Armor proteines (Saint-Brice-en-Coglès, France). Acetic acid and lactic acid of analytical grade from Panreac (Barcelona, Spain) were used. Distilled water was used to prepare all the suspensions to study the pasting profiles and tap water was used to make GF doughs.
2.2. Methods
Dough preparation
A straight dough process was performed in duplicate per formulation, using the following formula on a 100 g starch (or starch+protein) basis: 6 g oil, 5 g sucrose, 1.5 g salt, 2.0 g HPMC and 75 g water. CA and SPI were added at 0 or 5 g/100 g (starch + protein basis) levels and doughs were supplemented with (0.1 + 0.4) g/100 g (starch + protein basis) of acetic+lactic acid when acid-treatment was applied. The experimental design resulted in 24 different combinations (Table 1). GF dough-making was achieved by blending first solid ingredients and oil in a kitchen-aid professional mixer KPM5 (Michigan, USA) at speed 2. Then water was added and hand mixed. Finally the dough was mixed with dough hook at a speed 4 for 8 min. Acid blend, when added, was diluted in a small part of water and adjusted to the dough before the mixer was powered on.
Table 1. Randomized experimental design
Formula Starch Protein Acetic/Lactic Acid*
1 Potato SPI 0.1/0.4
2 Wheat 0 0.1/0.4
3 Potato SPI 0
4 Corn SPI 0
5 Corn SPI 0.1/0.4
6 Corn CA 0
7 Tapioca SPI 0
8 Wheat 0 0
9 Tapioca SPI 0.1/0.4
10 Corn 0 0.1/0.4
11 Corn CA 0.1/0.4
12 Potato 0 0
13 Tapioca CA 0
14 Tapioca 0 0.1/0.4
15 Potato CA 0.1/0.4
16 Wheat SPI 0.1/0.4
17 Wheat CA 0
18 Tapioca CA 0.1/0.4
19 Tapioca 0 0
20 Potato CA 0
21 Corn 0 0
22 Wheat CA 0.1/0.4
23 Wheat SPI 0
24 Potato 0 0.1/0.4
2.3. Dough measurements
pH and total titratable acidity of doughs
Total titratable acidity (TTA) was measured on ten grams of dough blended with 100 mL of a solution of acetone in water (5 mL/100 mL) under constant stirring. The titration was carried out against 0.1 mol/L NaOH until a final pH of 8.5. The results were expressed as milliequivalents of lactic acid/g of dough. This measurement was taken in triplicate on unyeasted doughs.
Fundamental rheological tests
Oscillatory and creep–recovery tests were carried out with RheoStress-1 rheometer (Thermo Haake, Karlsruhe, Germany) with parallel plate geometry (60 mm diameter) of serrated surface and with 3-mm gap. The excess of dough was removed, and vaseline oil was applied to cover the exposed sample surfaces. All measurements were done at 25 °C. Before each assay the dough was allowed 10 min for relaxation. Frequency sweeps were carried out from 10 to 1 Hz in the linear viscoelastic region (LVR). A constant stress value of 1 Pa was chosen for the frequency sweeps of all doughs. Stress sweeps were carried out from 0.1 to 100 Pa at 1 Hz. From the curves, the maximum stress beyond which the dough structure was broken, τmax, was established. Frequency sweep data were fitted to the power law model as in previous works (Ronda et al., 2014). Within the applied frequency range, the mechanical spectra fitted the power law model with R2 values above 0.99.
Creep tests were performed by imposing a step of shear stress in the LVR and outside the linear viscoelastic region (OLVR). For the creep study in the LVR, a constant shear stress of 1 Pa was applied for 150 s, while in the recovery phase the stress was suddenly removed and the sample was allowed for 300 s to recover the elastic (instantaneous and retarded) part of the deformation. For the OLVR study, a constant shear stress of 50 Pa was applied for 60 s and the sample was allowed to recover for 180 s after removing the load. Each test was performed in triplicate. The data from creep tests were modelled to the 4-parameter Burgers model (Ronda et al., 2014).
Dough stickiness
Stickiness was measured by following the procedure proposed by Grausgruber, Hatzenbichler, & Ruckenbauer (2003). A texturometer TA-XT2 from Stable Microsystem (Godalming, UK) provided with a SMS/Chen-Hoseney device where the sample was placed, and a methacrylate 25 mm cylinder (P/25P) as compression cell, were used. The positive maximum force (adhesive force), was used to measure stickiness. Six replicates were made for each dough.
Pasting properties
2.4. Statistical analysis
Statgraphics Centurion v.6 (Bitstream, Cambridge, MN, USA) was used for non-linear regressions and multi-factor analysis of variance. LSD (Least Significant Difference) test was used to evaluate significant differences (p < 0.05) between samples.
3. Results and discussion
3.1. pH and total titratable acidity of doughs
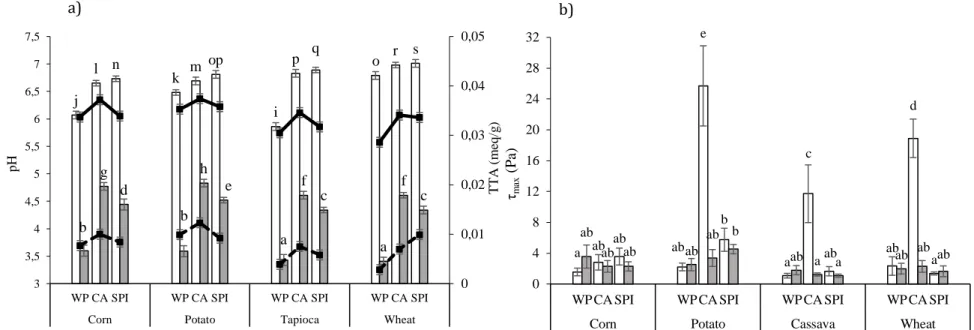
The pH of unacidified and protein-free matrices varied depending on the starch source, and followed the order: Tapioca (pH=5.9) < Corn (pH=6.1) < Potato (pH=6.5) < Wheat (pH=6.8) (Fig. 1a). Protein presence systematically increased the dough pH value while the acetic-lactic blend provided a decrease ~ 2.5 units. The type of protein and the starch source also affected the pH of the dough through the significant (p<0.05) (protein x starch x pH) 3rd order interactive effect (Fig.1a). Dough pH increased with protein presence between 3 % (for wheat and potato starch doughs) and 18% (for tapioca starch dough) depending on the starch source. Acidification of control matrices reduced significantly (p<0.05) the pH from 6–6.7 to 3.4–3.6. However, acidification of protein-enriched doughs only decreased pH to 4.3–4.8. The buffering effect of proteins, responsible for the lower effect of acidification on dough pH, was previously reported by Villanueva et al. (2015) for rice starch-based doughs. Fig.1a shows the buffering effect was significantly higher for CA than SPI regardless the starch source used for dough formulation; consequently, the pH of acidified CA-enriched doughs was higher than those of SPI-enriched doughs.
Figure 1. pH and TTA values (a) and maximum stress values, τmax (b) recorded for samples with different starch source, type of protein
and acid addition. WP: doughs without protein, CA: doughs with 5% calcium caseinate, SPI: doughs with 5% soy protein isolate. Void bars (principal axes) and discontinue lines (secondary axes) correspond to doughs without acid addition, filled bars and continuous lines correspond to acidified doughs. Error bars represent the mean standard deviation. Different letters within each graph mean statistically significant differences between means (p<0.05).
j l n
k m op
i
p q o r s
b g
d
b h
e
a f
c
a f
c
0 0,01 0,02 0,03 0,04 0,05
3 3,5 4 4,5 5 5,5 6 6,5 7 7,5
WP CA SPI WP CA SPI WP CA SPI WP CA SPI
Corn Potato Tapioca Wheat
T
T
A
(
m
eq/
g
)
pH
a ab
ab
ab e
b
a c
ab ab
d
a ab
ab ab ab
ab b
ab a a ab ab ab
0 4 8 12 16 20 24 28 32
WP CA SPI WP CA SPI WP CA SPI WP CA SPI
Corn Potato Cassava Wheat
τmax
(P
a
)
3.2. Dynamic oscillatory rheology
The stress sweep tests provided the τmax value or maximum stress doughs were able to stand before breaking their structure (Fig.1b). The τmax values of all doughs were around 2–4 Pa (without significant differences among them) with the exception of unacidified CA-enriched doughs made with potato, wheat or tapioca starches (maize starch doughs were not affected by CA addition). The τmax of these doughs were much higher: 26, 19 and 12 Pa respectively. This could be due to the organization of casein micelles that form large supramolecular entities further considered as spherical particles. They are covered by κ-casein, which stabilizes them in the suspension through steric and electrostatic repulsions. Moreover, the hairy surface prevents neutral polymers from adsorbing on the micelles (Bourriot, Garnier, & Doublier, 1999) and Ca+2 ionic interactions, which partially can replace the behaviour of disulphide bridges, could deliver similar rheological characteristics to gluten systems (Stathopoulos & O’Kennedy, 2008). The acid blend addition counteracted the CA stabilization effect and led to similar τmax values than protein-free matrices.
Table 2 shows the single effects and Fig.2a the 3rd order interactive effects of factors studied on viscoelastic parameters obtained from frequency sweeps. Viscoelastic behaviour of dough samples corresponded to solid-like systems with storage modulus values (G’1) higher than loss modulus (G’’1),
slight frequency dependence (low a and b exponents), and values for (tan δ1) under 1, in good
accordance with earlier results found for acidified rice starch doughs enriched with proteins that included SPI and CA proteins (Ronda et al., 2014). The slight dependence of the moduli on angular frequency (a and b values ranged 0.13–0.37) and the values of phase shift tangent (tan δ) varying in the range 0.33–0.68 are characteristics of the systems called pseudo-gels. This is in agreement with earlier observations in GF doughs (Witczak, Korus, Ziobro, & Juszczak, 2010). Starch source affected significantly (p<0.001) the viscoelastic moduli. The highest G1’ and G1’’ moduli were obtained for
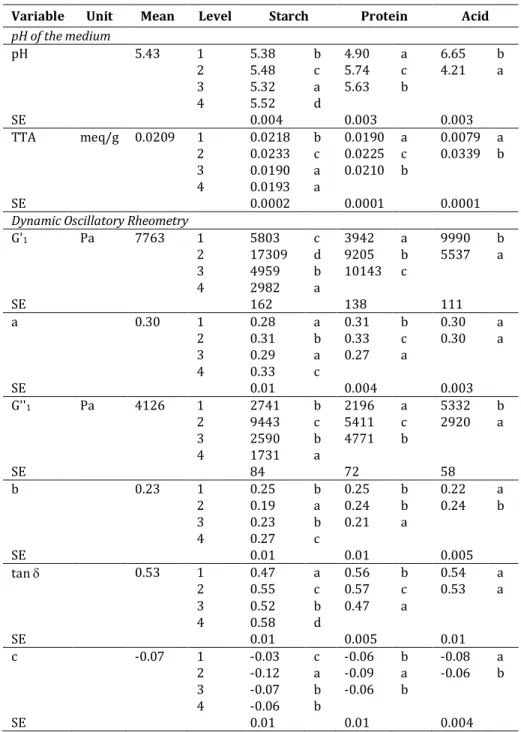
Table 2. Single effects on pH. acidity and the rheological properties from oscillatory tests of gluten-free bread
doughs made with starches from different sources, without or with protein (5 g calcium caseinate or soy protein isolate per 100 g of starch+protein) with or without acid addition (acetic+lactic acid 0.1+0.4 g/100 g starch+protein)
Variable Unit Mean Level Starch Protein Acid pH of the medium
pH 5.43 1 5.38 b 4.90 a 6.65 b
2 5.48 c 5.74 c 4.21 a
3 5.32 a 5.63 b
4 5.52 d
SE 0.004 0.003 0.003
TTA meq/g 0.0209 1 0.0218 b 0.0190 a 0.0079 a
2 0.0233 c 0.0225 c 0.0339 b
3 0.0190 a 0.0210 b
4 0.0193 a
SE 0.0002 0.0001 0.0001
Dynamic Oscillatory Rheometry
G'1 Pa 7763 1 5803 c 3942 a 9990 b
2 17309 d 9205 b 5537 a
3 4959 b 10143 c
4 2982 a
SE 162 138 111
a 0.30 1 0.28 a 0.31 b 0.30 a
2 0.31 b 0.33 c 0.30 a
3 0.29 a 0.27 a
4 0.33 c
SE 0.01 0.004 0.003
G''1 Pa 4126 1 2741 b 2196 a 5332 b
2 9443 c 5411 c 2920 a
3 2590 b 4771 b
4 1731 a
SE 84 72 58
b 0.23 1 0.25 b 0.25 b 0.22 a
2 0.19 a 0.24 b 0.24 b
3 0.23 b 0.21 a
4 0.27 c
SE 0.01 0.01 0.005
tan 0.53 1 0.47 a 0.56 b 0.54 a
2 0.55 c 0.57 c 0.53 a
3 0.52 b 0.47 a
4 0.58 d
SE 0.01 0.005 0.01
c -0.07 1 -0.03 c -0.06 b -0.08 a
2 -0.12 a -0.09 a -0.06 b
3 -0.07 b -0.06 b
4 -0.06 b
SE 0.01 0.01 0.004
Starch level: 1: corn, 2: potato, 3: tapioca, 4: wheat; Protein level: 1: without protein, 2: Calcium caseinate, 3: Soya protein isolate; Acid level: 1: without acid addition, 2: with acid addition. Within each parameter, different letters in the corresponding column mean statistically differences between means at p<0.05. TTA: total titratable acidity. G’1. G’’1. and
(tan δ)1 represent the elastic and viscous moduli and the loss tangent at a frequency of 1 Hz. The a, b and c exponents
quantify the dependence degree of dynamic moduli and the loss tangent with the oscillation frequency. SE: Pooled standard error
the 2nd order and 3rd order effects significantly (p<0.01) affected G1’, G1’’ and tan δ1. This means that
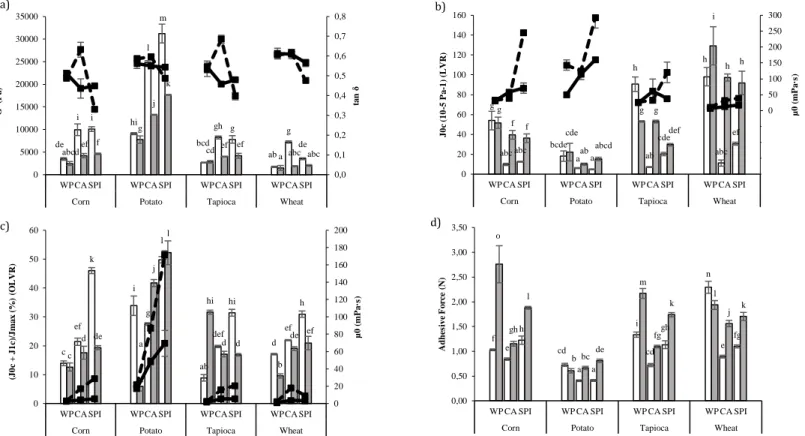
the effect of the protein type depended on both the starch source and the pH of the dough. As can be seen in Fig.2a SPI provided the most strengthening effect in potato starch doughs, with increases up to 250% in G1’ with respect to the protein-free dough. Important increases in G’ and G’’ were also
found by Patraşcu, Banu, Vasilean, & Aprodu (2016) when added SPI to potato starch systems. However, in the case of wheat starch was the CA-protein who had the highest effect on dough consistency leading to increases in G1’ and G1’’ of 320% while SPI only led to an increase of 105%.
The effect of both proteins was similar in the case of corn and tapioca starch doughs (Fig.2a). The effect of dough acidification on viscoelastic moduli was always greater in the case of protein-enriched doughs. The acidification of protein-free doughs only provided a significant (p<0.05) effect in the case of potato, with slight decreases in G1’ and G1’’of 14 and 18% respectively. However, in presence
of protein, the decrease in the elastic modulus, G1’, was 41 and 74% for SPI- and CA-enriched wheat doughs with respect to the non-acidified counterparts.
Similar tendency was observed in corn and tapioca doughs (Fig.2a). In both cases, tan δ decreased in unacidified doughs as result of protein addition, denoting an increase in the predominance of dough elasticity. In acidified doughs, both proteins CA and SPI, led to different effects. Acidification of CA-enriched doughs led to a marked increase in the loss tangent, which indicates an increment in the viscous to elastic moduli ratio, while in the case of SPI-added doughs a decrease was observed. The similarities between corn and tapioca starches could be due to their similar particle size and shape, completely different from potato (very big size) and wheat (bi-modal size distribution with small and big granules) starches. These structural differences and therefore, their functional properties, could change the behaviour of the continuous phase of the dough which results in changes of viscoelasticity. According to Singh, Singh, Kaur, Sodhi, & Gill (2003), the presence of a high phosphate monoester content and the absence of lipids and phospholipids in the potato starch may also be responsible for the high G’ and G’’ of their doughs. The presence of phospholipids and the more rigid granules of corn starch could explain the lower consistency of doughs.
3.3. Creep-recovery tests
de i i hi l m bcd gh g ab g de abcdef f g j k
cd ef ef
a abc abc
0,0 0,1 0,2 0,3 0,4 0,5 0,6 0,7 0,8 0 5000 10000 15000 20000 25000 30000 35000
WP CA SPI WP CA SPI WP CA SPI WP CA SPI
Corn Potato Tapioca Wheat
ta n δ G ' (P a )
Figure 2. Rheological properties of bread doughs depending on the starch source, type of protein and acid addition. Elastic modulus and loss tangent from oscillatory tests (a), Instantaneous elastic compliance and steady viscosity from creep tests in the linear viscoelastic region (LVR) (b) Percentage of total elastic compliance with respect to maximum compliance from creep tests measured outside the lineal viscoelastic region (OLVR) (c) and adhesive force obtained from stickiness tests (d) of bread doughs. WP: doughs without protein, CA: doughs with 5% calcium caseinate, SPI: doughs with 5% soy protein isolate. Void bars (principal axes) and discontinue lines (secondary axes) correspond to doughs without acid addition, Filled bars and continuous lines correspond to acidified doughs. Error bars represent the mean standard deviation. Different letters within each graph mean statistically significant differences between means (p<0.05).
g
abc abc bcde
a a h ab cde h abc ef g f f cde ab abcd g g def i h h -200 -150 -100 -50 0 50 100 150 200 250 300 0 20 40 60 80 100 120 140 160
WP CA SPI WP CA SPI WP CA SPI WP CA SPI
Corn Potato Tapioca Wheat
µ 0 ( m P a ·s ) J 0 c (1 0 -5 P a -1 ) (L VR ) f e h cd a a i cd gh n e fg o gh l b bc de m fg k l j k 0,00 0,50 1,00 1,50 2,00 2,50 3,00 3,50
WP CA SPI WP CA SPI WP CA SPI WP CA SPI
Corn Potato Tapioca Wheat
A dh es iv e F o rc e (N ) c ef k i g l ab def hi d ef h c d de a j l hi d d b de ef 0 20 40 60 80 100 120 140 160 180 200 0 10 20 30 40 50 60
WP CA SPI WP CA SPI WP CA SPI WP CA SPI
Corn Potato Tapioca Wheat
µ 0 ( m P a ·s ) (J 0 c + J 1 c) /J m a x ( % ) (O L VR )
a) b)
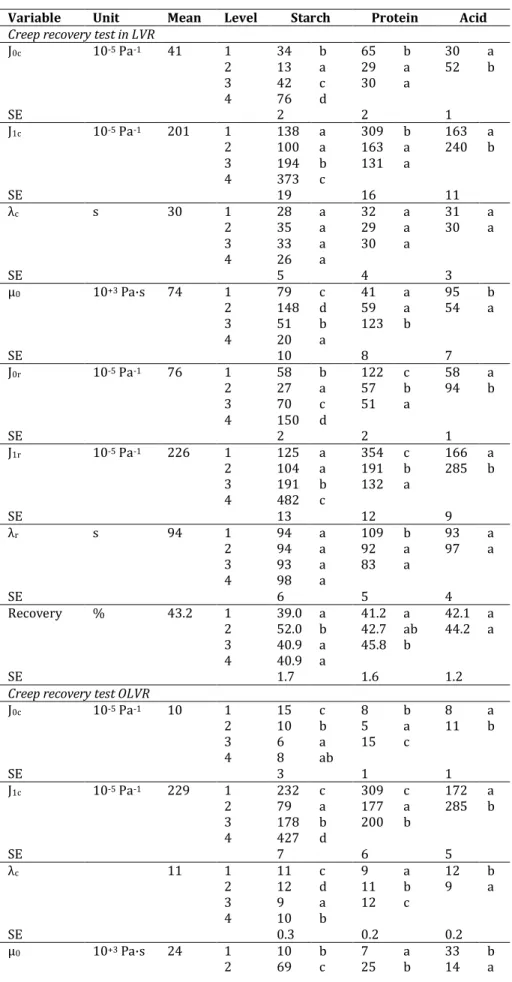
Table 3. Single effects on the rheological properties from creep recovery tests inside (LVR) and outside (OLVR)
the linear viscoelastic region of gluten-free bread doughs made with starches from different sources, without or with protein (5 g calcium caseinate or soy protein isolate per 100 g of starch+protein) with or without acid addition (acetic+lactic acid 0.1+0.4 g/100 g of starch+protein)
Variable Unit Mean Level Starch Protein Acid Creep recovery test in LVR
J0c 10-5 Pa-1 41 1 34 b 65 b 30 a
2 13 a 29 a 52 b
3 42 c 30 a
4 76 d
SE 2 2 1
J1c 10-5 Pa-1 201 1 138 a 309 b 163 a
2 100 a 163 a 240 b
3 194 b 131 a
4 373 c
SE 19 16 11
λc s 30 1 28 a 32 a 31 a
2 35 a 29 a 30 a
3 33 a 30 a
4 26 a
SE 5 4 3
µ0 10+3 Pa·s 74 1 79 c 41 a 95 b
2 148 d 59 a 54 a
3 51 b 123 b
4 20 a
SE 10 8 7
J0r 10-5 Pa-1 76 1 58 b 122 c 58 a
2 27 a 57 b 94 b
3 70 c 51 a
4 150 d
SE 2 2 1
J1r 10-5 Pa-1 226 1 125 a 354 c 166 a
2 104 a 191 b 285 b
3 191 b 132 a
4 482 c
SE 13 12 9
λr s 94 1 94 a 109 b 93 a
2 94 a 92 a 97 a
3 93 a 83 a
4 98 a
SE 6 5 4
Recovery % 43.2 1 39.0 a 41.2 a 42.1 a
2 52.0 b 42.7 ab 44.2 a
3 40.9 a 45.8 b
4 40.9 a
SE 1.7 1.6 1.2
Creep recovery test OLVR
J0c 10-5 Pa-1 10 1 15 c 8 b 8 a
2 10 b 5 a 11 b
3 6 a 15 c
4 8 ab
SE 3 1 1
J1c 10-5 Pa-1 229 1 232 c 309 c 172 a
2 79 a 177 a 285 b
3 178 b 200 b
4 427 d
SE 7 6 5
λc 11 1 11 c 9 a 12 b
2 12 d 11 b 9 a
3 9 a 12 c
4 10 b
SE 0.3 0.2 0.2
µ0 10+3 Pa·s 24 1 10 b 7 a 33 b
3 9 b 39 c
4 6 a
SE 1 1 1
J0r 10-5 Pa-1 39 1 33 a 38 b 36 a
2 30 a 35 a 42 b
3 40 b 45 c
4 54 c
SE 2 1 1
J1r 10-5 Pa-1 131 1 114 b 155 b 118 a
2 83 a 121 a 143 b
3 130 c 115 a
4 196 d
SE 4 4 3
λr 34 1 30 a 29 a 38 b
2 39 c 40 c 30 a
3 33 b 32 b
4 33 b
SE 0.6 0.5 0.4
Recovery % 24.6 1 16.9 a 15.9 a 31.0 b
2 50.0 c 30.7 b 20.3 a
3 18.9 b 30.1 b
4 16.6 a
SE 0.5 0.4 0.3
Starch level: 1: corn, 2: potato, 3: tapioca, 4: wheat; Protein level: 1: without protein, 2: Calcium caseinate, 3: Soya protein isolate; Acid level: 1: without acid addition, 2: with acid addition, Within each parameter, different letters in the corresponding column mean statistically differences between means at p<0.05. J0 and J1 are the instantaneous and retarded
elastic compliances, λ1 is the retardation time and µ0 is the steady state viscosity. Recovery (%): 100*Jsteady/Jmaxc. where Jmax
is the maximum creep compliance obtained at the end of the creep step and Jsteady is the steady-state compliance in recovery
step. SE: Pooled standard error
The single effects of starch source, protein type and acid addition on Burgers model parameters are summarized in Table 3. Fig.2b shows 3rd order (starch source x protein type x acidification) effects on the instantaneous elastic compliance (J0c) and the steady viscosity (µ0) obtained from the creep
phase in the LVR. The studied bread doughs showed the typical viscoelastic creep–recovery curves combining viscous and elastic components both in the LVR and OLVR. In the LVR, a strong correlation (p<0.001) was found for all creep compliance parameters and the equivalents for the recovery phase (r>0.95). Besides, it was observed that factors providing an increase in viscosity at the steady state, µ0, decreased elastic and retarded elastic components (J0 and J1 respectively) in both creep and
recovery phases. Creep-recovery tests made in the LVR revealed that doughs with the lowest elastic and viscoelastic compliances and the highest steady viscosity had also the highest G1’ and G1’’ values.
Potato starch led to doughs with the highest µ0 (148 kPa·s on average) and the smallest J0 and J1
compliances (13·10-5 Pa-1 and 100·10-5 Pa-1) denoting their highest resistance to deformation.
Conversely, wheat starch doughs showed the highest deformations versus the application of a constant stress, with J0 and J1 averaged values of 76·10-5 Pa-1 and 373·10-5 Pa-1 (Table 3), and the
lowest µ0 (20 kPa·s). The addition of proteins, regardless of the starch source, always decreased all
compliance values and increased the steady viscosity (Table 3, Fig.2b). In general, dough acidification had the opposite effect. This means the studied proteins reinforced dough structure while the acid addition, in general, led to the opposite effect. The effect of acidification depended significantly (p<0.05) on the starch source and the presence and type of the added protein (Fig.2b). Acidification was more effective on protein-enriched doughs than in only starch-based matrices. It increased the instantaneous elastic compliance, J0, of all protein-enriched doughs with respect to the non-acidified
which will affect its intramolecular interactions and alter its interactions with starch and consequently the dough consistency and its viscoelasticity (Villanueva, Ronda, Moschakis, Lazaridou, & Biliaderis, 2018). The obtained results support the ability of acidification to modulate and compensate the effect of protein addition on dough viscoelasticity.
Fig. 2c depicts (J0c+J1c)/Jmax, which represents the elastic (instantaneous+retarded) to total
(elastic+viscous) compliance ratio, and the steady viscosity (µ0) of formulated bread doughs, both
obtained in the creep phase from OLVR tests. The highest (J0c+J1c)/Jmax values were obtained for
potato starch doughs that were always above the remaining doughs except the non-acidified SPI-corn dough. This means a higher elastic deformation with respect to the total (elastic+viscous) deformation which is of relevance given it is the elastic deformation the only that can be recovered after the release of the applied stress. The measurements OLVR demonstrate steady viscosity increased markedly with proteins, particularly with SPI and corn and potato starch doughs. However, acidification reduced the steady viscosity counteracting the protein effect. The recovery capacity of bread doughs after the applied stress decreased with the intensity of applied stress (Table 3). The recovery (%) values obtained in the LVR tests were always higher than in the OLVR tests except in the case of potato starch dough that was unchanged. The OLVR tests, which seem to better simulate dough processing conditions (Ronda et al., 2017), also showed a greater capacity for discrimination between the analysed doughs.
3.4. Dough stickiness
Table 4 summarizes the single effects of starch, protein and acid blend on the adhesive force of formulated doughs. The 3rd order effects are presented in Fig.2d. The adhesive force correlated
negatively with the modules G1' and G1'' (p<0.001; r=-0.67 and r=-0.70) indicating that the greater
the consistency of the dough the less sticky it is. The stickiness evolution versus elastic or viscous moduli (data not shown) was not linear but potential. This means, stickiness decreased faster (from 2.8 to 1N) with increases of G1’ within the range 1000–7000Pa and decreased slower (from 1 to 0.5N)
for G1’ values within the range 7000-30000Pa. The lowest stickiness values were obtained for doughs
Table 4. Single effects on the stickiness and visco-metric properties of gluten-free bread doughs made with
starches from different sources, without or with protein (5 g calcium caseinate or soy protein isolate per 100 g of starch+protein) with or without acid addition (acetic+lactic acid 0.1+0.4 g/100 g of starch+protein)
Variable Unit Mean Level Starch Protein Acid Stickiness
Adhesive
Force N 1.26 1 2 1.48 0.60 c a 1.61 0.92 a c 1.51 1.01 a b
3 1.37 b 1.25 b
4 1.58 d
SE 0.02 0.01 0.01
Pasting properties
PV mPa·s 926 1 1520 d 441 a 1062 b
2 546 a 1292 c 791 a
3 748 b 1046 b
4 891 c
SE 16 14 11
TV mPa·s 324 1 461 c 101 a 391 b
2 441 c 507 c 256 a
3 260 b 363 b
4 130 a
SE 8 7 6
BD mPa·s 603 1 1057 d 340 a 606 a
2 105 a 784 b 534 a
3 488 b 683 b
4 761 c
SE 11 9 7
SB mPa·s 180 1 323 b 73 a 231 b
2 113 a 298 c 144 a
3 145 a 186 b
4 138 a
SE 6 5 4
FV mPa·s 503 1 787 d 174 a 640 b
2 554 c 787 c 400 a
3 405 b 549 b
4 267 a
SE 11 9 8
PT ºC 71.25 1 73.91 b 71.97 b 69.21 a
2 67.45 a 69.82 a 73.29 b
3 76.29 b 72.96 b
4 67.28 a
SE 0.28 0.24 0.20
P-time min 4.49 1 4.38 a 3.99 a 4.65 a
2 5.36 b 4.75 b 4.32 a
3 3.89 a 4.72 b
4 4.34 a
SE 0.03 0.03 0.02
Starch level: 1: corn, 2: potato, 3: tapioca, 4: wheat; Protein level: 1: without protein, 2: Calcium caseinate. 3: Soya protein isolate; Acid level: 1: without acid addition, 2: with acid addition. Within each parameter, different letters in the corresponding column mean statistically differences between means at p<0.05. PV: peak viscosity, TV: trough viscosity, BD: breakdown, SB: setback, FV: final viscosity, PT: pasting temperature, P-time: peak time. SE: Pooled standard error
3.5. Pasting properties
were particularly high during the cooking stage, especially for potato starch suspensions (6000 mPa.s) versus wheat starch suspensions (2600 mPa.s). The presence of high phosphate monoester content and the absence of lipids and phospholipids in potato starch, associated to the great values for the dynamic moduli (Singh et al., 2003) as well as the high degree of reticulation of starch structure may explain the developed great viscosity during pasting. Besides the diluting effect on starch, the presence of non-starch components in the bread dough, and particularly HPMC, protein and lipids for smaller starch granules in starch blends can restrict swelling and gelatinization during cooking, in good agreement with the lower viscometric pattern observed in blended matrices (bread doughs) compared to native starches (Fig.3). Table 4 shows major effects on cooking and cooling parameters were provided by corn (starch), casein (proteins) and no acidification (acid). PT values of blends followed the order: Potato (67ºC) = Tapioca (68ºC) < Corn (74ºC) = Wheat (76ºC) (Table 4). A higher temperature of gelatinization reflects a greater internal stability of starch granule, normally associated with a greater presence of semi-crystalline areas and a higher content of amylose (Hirashima, Takahashi, & Nishinari, 2012). Corn starch doughs exhibited the highest PV (1520mPa·s), value about two-times those of wheat (891mPa.s) and tapioca (748 mPa·s) starch blends and three-times those from potato (546 mPa·s) starch mixtures. In addition, the highest BD, FV and SB were obtained for corn starch doughs. SB value from RVA determination of starch was attributed to amylose leaching during heating (Naguleswaran, Vasanthan, Hoover, & Liu, 2010), therefore the highest SB of corn starch could be due to the greater amount of amylose leached from swelled granules. Potato, tapioca and wheat starch doughs led to similar SB values indicating similar amylose retrogradation extent on cooling. The incorporation of protein led to significant (p<0.05) increases in PV, TV, BD, SB and FV, greater for CA than SPI. Quantitative differences may be attributed to variable ability to retain water and interact with starch molecules at granule surface, and to their gel forming capacity as reported for whey proteins (Ribotta & Rosell, 2010).
0 10 20 30 40 50 60 70 80 90 100 0 500 1000 1500 2000 2500 3000 3500
0 200 400 600 800
T em p er atu re ( ºC ) V is co sit y (m Pa ·s ) Time (s) 0 10 20 30 40 50 60 70 80 90 100 0 500 1000 1500 2000 2500 3000 3500
0 200 400 600 800
T em p er atu re ( ºC ) Vi sc o si ty ( m P a· s) Time (s) 0 10 20 30 40 50 60 70 80 90 100 0 500 1000 1500 2000 2500 3000 3500
0 200 400 600 800
T em p er atu re ( ºC ) Vis co sit y (m P a· s) Time (s) 0 10 20 30 40 50 60 70 80 90 100 0 500 1000 1500 2000 2500 3000 3500
0 200 400 600 800
T em p er atu re ( ºC ) Vis co sit y (m P a· s) Time (s)
Figure 3. Effect of acidification and protein fortification on viscometric profiles of bread doughs made from corn (a), wheat (b), potato (c) and tapioca (d) starches. Doughs without protein are represented by , with 5% calcium caseinate by , and with 5% soy protein isolate by . Doughs with acid addition are represented by , with 5% calcium caseinate acidified by , and with 5% soy protein isolate acidified by
. The lines represent the viscometric profiles of aqueous starch dispersions with a dry matter content identical to that of the dough dispersion. The temperature profile is represented by in the second axis.
0 20 40 60 80 100 0 2000 4000 6000
0 200 400 600 800
T em p er a tu re , ºC V is co sit y , cp Time (s)
a) b)
4. Conclusions
Acidification and protein supplementation modified the rheological and pasting properties of GF bread doughs. Those effects varied according to both the starch source and type of protein used as raw materials and the presence/absence of acid. In general, potato starch doughs revealed the most significant results. The incorporation of protein strengthened the dough, being structuring especially significant in the case of CA addition to potato, tapioca and wheat starch doughs, showing higher τmax values. However, the effect of protein on viscoelastic moduli depended on the type of protein and starch source. The acidification resulted in a weakening of the dough matrices structure. Creep-recovery test made in and outside the LVR revealed that the addition of protein decreased notably the values of maximum compliance compared to control doughs without protein, showing higher values with the addition of CA than SPI. In general, acid incorporation increased the values of compliance for all starches (enriched or not with proteins) in and outside the LVR, which indicates a greater capacity of deformation of the doughs to a given stress. Protein presence increased the pasting profiles, but with differences between the two proteins studied. The results of the present study can contribute to generating new knowledge and therefore the development and increase of the GF baked products quality to broaden the food product choices for GF products consumers. Additional studies are still required for extensive evaluation of the effect of acidification on these matrices and its applicability on the breadmaking process.
Acknowledgement
The authors thank the financial support of the Ministerio de Economía y Competitividad and the European Regional Development Fund (FEDER) (AGL2015-63849-C2-1-R and AGL2015-63849-C2-2-R) and Consejeria de Education (Junta de Castilla y Leon) / FEDER (Project VA072P17). Marina Villanueva thanks the Junta de Castilla y León for her doctorate grant. The authors thank to Carmen M. Cotfas for her help with rheological measurements.
References
Armero, E., & Collar, C. (1997). Texture properties of formulated wheat doughs. Relationships with dough and bread technological quality. Z Lebensm Unters Forsch A, 204, 136-145.
Bourriot, S., Garnier, C., & Doublier, J.-L. (1999). Phase separation, rheology and microstructure of micellar casein–guar gum mixtures. Food Hydrocolloids, 13(1), 43-49.
Capriles, V. D., & Arêas, J. A. G. (2014). Novel approaches in gluten-free breadmaking: Interface between food science, nutrition, and health. Comprehensive Reviews in Food Science and Food Safety, 13(5), 871-890.
Collar, C. (2003). Significance of viscosity profile of pasted and gelled formulated wheat doughs on bread staling. European Food Research and Technology, 216, 505-513.
Doublier, J. L., Garnier, C., Renard, D., & Sanchez, C. (2000). Protein-polysaccharide interactions. Current Opinion in Colloid and Interface Science, 5(3-4), 202-214.
Grausgruber, H., Hatzenbichler, E., & Ruckenbauer, P., 2003. Analysis of repeated stickiness measures of wheat dough using a texture analyzer. Journal of Texture Studies 34 (1), 69-82.
Hirashima, M., Takahashi, R., & Nishinari, K. (2012). The gelatinization and retrogradation of cornstarch gels in the presence of citric acid. Food Hydrocolloids, 27(2), 390-393.
Hoseney, R.C. & Smewing, J. (1999). Instrumental measurement of stickiness of doughs and other foods. Journal of Texture Studies, 30, 123-136.
Houben, A., Höchstötter, A., & Becker, T. (2012). Possibilities to increase the quality in gluten-free bread production: An overview. European Food Research and Technology, 235(2), 195-208.
Majzoobi, M., Kaveh, Z., & Farahnaky, A. (2016). Effect of acetic acid on physical properties of pregelatinized wheat and corn starch gels. Food Chemistry, 196, 720-725.
Marco, C., & Rosell, C. M. (2008). Breadmaking performance of protein enriched, gluten-free breads. European Food Research and Technology, 227(4), 1205-1213.
Masure, H. G., Fierens, E., & Delcour, J. A. (2016). Current and forward looking experimental approaches in gluten-free bread making research. Journal of Cereal Science, 67, 92-111.
Matos, M. E., & Rosell, C. M. (2014). Understanding gluten-free dough for reaching breads with physical quality and nutritional balance. Journal of the Science of Food and Agriculture, 95(4), 653-661.
Moore, M. M., Dal Bello, F., & Arendt, E. K. (2008). Sourdough fermented by Lactobacillus plantarum FST 1.7 improves the quality and shelf life of gluten-free bread. European Food Research and Technology, 226(6), 1309-1316.
Naguleswaran, S., Vasanthan, T., Hoover, R., & Liu, Q. (2010). Structure and physicochemical properties of palmyrah (Borassus flabellifer L.) seed-shoot starch grown in Sri Lanka. Food Chemistry, 118(3), 634-640.
Naqash, F., Gani, A., Gani, A., & Masoodi, F. A. (2017). Gluten-free baking: Combating the challenges - A review. Trends in Food Science and Technology, 66, 98-107.
Patraşcu, L., Banu, I., Vasilean, I., & Aprodu, I. (2016). Rheological and Thermo-mechanical Characterization of Starch – Protein Mixtures. Agriculture and Agricultural Science Procedia, 10, 280-288.
Ribotta, P. D., & Rosell, C. M. (2010). Effects of enzymatic modification of soybean protein on the pasting and rheological profile of starch-protein systems. Starch, 62(7), 373-383.
Ronda, F., Pérez-Quirce, S., & Villanueva, M. (2017). Rheological Properties of Gluten-Free Bread Doughs. Relationship with Bread Quality. In Ahmed, J., Ptaszek, P., Basu, S (Eds.), Advances in food rheology and applications. (pp. 297-334). ELSEVIER, Cambridge, UK.
Singh, N., Singh, J., Kaur, L., Sodhi, N. S., & Gill, B. S. (2003). Morphological, thermal and rheological properties of starches from different botanical sources. Food Chemistry, 81(2), 219-231.
Stathopoulos, C. E., & O’Kennedy, B. T. (2008). A rheological evaluation of concentrated casein systems as replacement for gluten: Calcium effects. International Journal of Dairy Technology, 61(4), 397-402.
Villanueva, M., Mauro, R. R., Collar, C., & Ronda, F. (2015). Acidification of protein-enriched rice starch doughs: effects on breadmaking. European Food Research and Technology, 240(4), 783-794.
Villanueva, M., Ronda, R., Moschakis, T., Lazaridou, A., & Biliaderis, C.G. (2018) Impact of acidification and protein fortification on thermal properties of rice, potato and tapioca starches and rheological behaviour of their gels. Food Hydrocolloids 79: 20-29.
Waterschoot, J., Gomand, S. V., Fierens, E., & Delcour, J. A. (2015). Starch blends and their physicochemical properties. Starch/Staerke, 67, 1-13.
Wieser, H. (2007). Chemistry of gluten proteins. Food Microbiology, 24(2), 115–119.