INFLUENCE OF LEAD AND LAG DIFFERENCES ON LOCALIZATION
PACS REFERENCE 43.66.QP
Kristian Jambrošiæ; Bojan Ivanèeviæ
Department of Electroacoustics, Faculty of EE and Computing, University of Zagreb Unska 3
HR-10000 Zagreb Croatia
Tel: +38516129640 Fax: +38516129680
E-mail: kristian.jambrosic@fer.hr
ABSTRACT
The precedence effect explains the ability of our hearing system to locate a sound source in a reverberant room. However, there are still many unknowns about how the occurrence of the effect depends on the differences of the lead and lag. In this paper, lead and lag signals were not reproduced only through one sound source, but simultaneously through two. Thus, the precedence effect was simulated using two phantom sound sources rather then two real sources. Cross-correlation function between left and right ear signals of a dummy head was calculated in order to find the relation to subjective tests.
INTRODUCTION
The precedence effect, also called in some special cases the 'Haas effect' and the 'law of the first waveform' is a well-known phenomena in psychoacoustics where men's hearing mechanism shown the ability to localize a sound source in a reverberant environment where the direct sound is followed by multiple reflections, [1-3]. More general, it refers to all phenomena issuing in various time delays between the direct sound (lead) and the reflection (lag) as well as in amplitude or spectral differences between these signals.
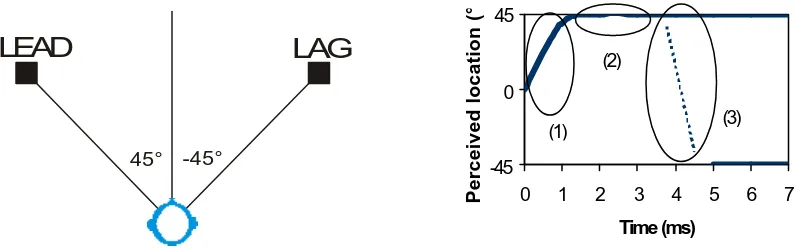
LEAD
LAG
-45° 45°
-45 0 45
0 1 2 3 4 5 6 7
Time (ms)
Perceived location (°)
(1) (2)
[image:2.596.94.492.75.199.2](3)
Fig. 1. Left – stimulus configuration, Right – perceived location with three characteristic regions.
The best place to make the measurement is an anechoic room to avoid possible unwanted reflections that could alter the controlled experimental environment.
MEASUREMENTS
Scope of the measurement
This paper deals with subjective and objective measurements of sound source fusion (summing localization) and dominance of the leading signal. The classic experiment uses one lead and one lag source which are spatial staggered (typical +45° and –45° from the zero azimuth line in the horizontal plane, fig.1). The fused image perceived by the listener can be considered as the phantom image.
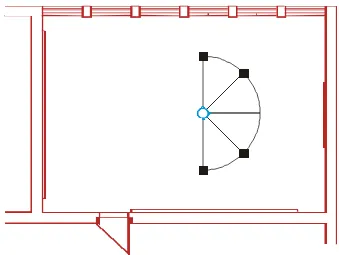
Our experiment did not include real, but phantom lead and lag signal sources. Each phantom source was created from a pair of real sources (speakers) reproducing the signals at the same time and at equal distance from the listener. The leading speakers were positioned at –45° and –90° and the lagging speakers at 45° and 90°, fig. 2.
The intention was to create a hyper virtual (phantom) image that would behave in the same manner as when created by two real sound sources. In other words, the precedence effect was simulated using phantom sources rather then real one. 7 subjects participated in the subjective tests. Afterwards, a dummy head was used to measure cross-correlation the same listening place.
Measurement setup
The measurements were made in a room with dimensions 10.20 m × 7.05 m × 3.20 m. It was acoustically designed as a music listening room, for subjective test of loudspeakers, psychoacoustic research and for smaller recordings, fig. 2. There are absorption materials on the walls and floor in order to reduce the reverberation time to approximately 0.5 s at medium frequencies.
For the measurements of precedence effect, an anechoic room is the best choice as the reflections from the surrounding walls, floor and ceiling could influence the measurement results. In our case, the time span of the measurement (5 ms) was shorter then the time at which the first reflections after the direct sound would arrive to the listening spot. The loudspeakers were also shielded with acoustic absorptive material to reduce the sound energy to spread toward the walls.
difference of the lead and lag signal was set to following: 0 µs, 100 µs, 200 µs, 300 µs, 400 µs, 500 µs, 600 µs, 700 µs, 800 µs, 900 µs, 1 ms, 2 ms, 3 ms, 4 ms, 5 ms respectively, all together 15 signals in three measurement series.
Fig. 2. Plan view of the listening room with loudspeaker arrangement and listening spot.
Localization measurements
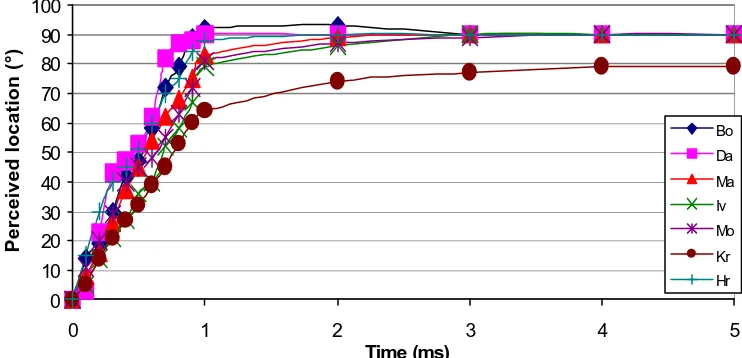
Localization of the virtual image was determined using 7 subjects with normal hearing, all skilled listeners from 25 to 55 years. They were sitting in the central listening spot (fig. 2) and were told not to move their head during the experiment. There was a mechanical pointing device in front of them, which was used to point and note the perceived direction. The results of the experiment are shown in fig 3. (50µs pulse width), fig 4. (100µs pulse width), fig. 5 (200µs pulse width) and fig. 6 (average results for all subjects).
The results show a very good agreement with the data found in literature for real lead and lag source measurements. However, it is interesting to examine the average slope of the measured results – as the width of the stimuli pulses becomes smaller, the perceived direction of the sound moves toward the leading source slightly quicker.
0 10 20 30 40 50 60 70 80 90 100
0 1 2 3 4 5
Time (ms)
Perceived location (°)
Bo
Da
Ma
Iv
Mo
Kr
Hr
[image:3.596.110.478.573.748.2]0 10 20 30 40 50 60 70 80 90 100
0 1 2 3 4 5
Time (ms)
Perceived location (°)
Bo
Da
Ma
Iv
Mo
Kr
Hr
Fig. 4. Perceived location of the sound stimuli for 100 µs lead and lag signals.
0 10 20 30 40 50 60 70 80 90 100
0 1 2 3 4 5
Time (ms)
Perceived location (°)
Bo
Da
Ma
Iv
Mo
Kr
[image:4.596.107.478.79.258.2]Hr
Fig. 5. Perceived location of the sound stimuli for 200 µs lead and lag signals.
0 10 20 30 40 50 60 70 80 90 100
0 1 2 3 4 5
Time (ms)
Perceived location (°)
50 us average
100 us average
[image:4.596.113.477.309.484.2]200 us average
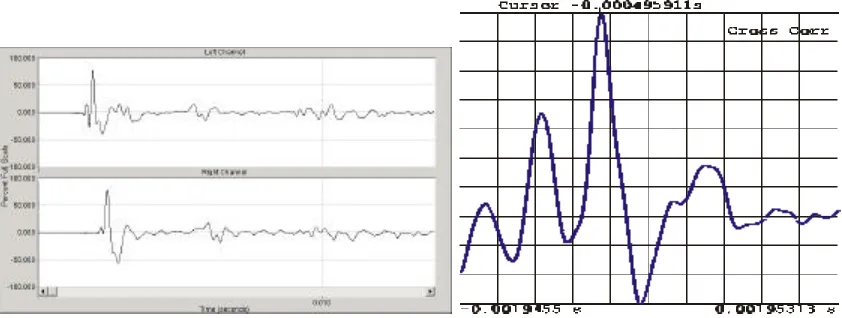
Cross-correlation analysis was done using the B&K dummy head type 4128. First, the stimuli signal was recorded binaural, as shown in fig. 7. There are no strong reflections inside the 5 ms time span.
Fig. 7. Left – left and right ear signal of the precedence measurement stimuli, 500 µs time difference; Right – cross correlation of the two signals
Cross-correlation function was measured between the left and right ear signals. Maximum peak of this function showed the time delay between the lead and lag signals, fig. 7. This was true for all stimuli signals with no exception – every maximum peak of the cross-correlation function equaled to the time difference between the lead and lag stimuli.
CONCLUSION
This paper tried to produce the summing localization and precedence effect using virtual, phantom sources rather then using real sources. It is obvious that these psychoacoustic phenomena occur equally when using real or phantom sources. The results obtained by subjective tests showed good agreement with the results of other authors. There was almost no difference in using stimuli of different pulse width except a slight difference in the perceived direction (moving quicker toward the lead when using shorter pulses). Cross-correlation measurements of the hyper virtual sound source test system using a dummy head showed exactly the time difference of the lead and lag stimuli.
REFERENCES
[1] Litovsky, R.Y., Colburn, H.S., Yost, W.a., Guzman, S.J., The precedence effect, J. Aouct. Soc. Am., vol. 106, no. 4, 1999, 1633-1654
[2] Blauert, J., Spatial Hearing: The Psychophysics of Human Sound Localization, MIT Press, Cambridge, 1997.