COCHLEAR COMPRESSION AS A FUNCTION OF CHARACTERISTIC
FREQUENCY IN LISTENERS WITH NORMAL HEARING
PACS REFERENCE: 43.66-X
Lopez-Poveda, Enrique A.1; Plack, Christopher J.2; Meddis, Ray2 1
Universidad de Castilla-La Mancha. 2 University of Essex. 1
Centro Regional de Investigación Biomédica, Facultad de Medicina, Campus Universitario s/n, 02071 Albacete, Spain. Tel: +34-967 599 325. Fax: +34-967 599 327. E-mail:
[email protected]. 2 Department of Psychology, University of Essex, Wivenhoe Park, Colchester CO4 3SQ, United Kingdom.
ABSTRACT
This study investigates the degree of cochlear compression as a function of characteristic frequency (CF). Fixed-probe-level iso-response temporal forward-masking curves (TMCs) were measured for probe frequencies (fps) between 500, and 8000 Hz, and masker frequencies (fms) ranging from 0.5, to 1.6×fp. For all fps, the shape of TMCs for fm = fp is consistent with cochlear compression for tones at CF. TMCs for fm = 0.5fp can be described as straight lines whose slopes decrease monotonically with increasing probe frequency, suggesting that compression occurs over a wider frequency range (relative to CF) for lower CFs than for higher CFs. Derived input/output curves suggest constant compression (3-4:1) across the range of CFs tested.
INTRODUCTION
Recent reports have inferred human cochlear compression from behavioural data (e.g., Baker et al, 1998; Glasberg and Moore, 2000; Plack and Oxenham, 2000). It is a common conclusion from these studies that compression increases with CF, in agreement with the physiological data (e.g., Rhode and Cooper, 1996; Rhode and Recio, 2000; Cooper and Yates, 1994). However, these studies are based on masking paradigms where the level of both the maskers and the probe are allowed to vary. Hence, both the probe and the maskers may be subject to compression. As a result, the experiments can only measure the relative amount of compression between the masker and the probe (Oxenham and Plack, 1997; Plack and Oxenham, 2000).
This difficulty is usually overcome by assuming that the cochlear response to tones an octave below CF is always linear regardless of CF. This assumption seems reasonable for CFs above 3000 Hz (e.g., Cooper and Yates, 1994; Rhode and Recio, 2000), but it may not true at low CF for chinchilla (Rhode and Cooper, 1996, Fig. 7A), and for human. The aim of the present paper is to investigate the validity of this assumption, and to study variations in the degree of compression over a range of CFs from 500 to 8000 Hz.
for every probe frequency (fp). The resulting functions are referred to as iso-response temporal masking curves (TMCs).
Higher masker levels are required to produce the same fixed output as ∆t increases (Moore and Glasberg, 1983; Nelson and Freyman, 1987). However, the rate at which Lm increases varies depending on the masker frequency. It has been argued (Nelson et al., 2001) that this is because some of the maskers are subject to cochlear compression while others are linear in their response. Therefore, the slope of the TMCs reflects the amount of compression for that masker. By assuming that the dependence of masking on ∆t is the same regardless of fm, and that very low frequency maskers (relative to CF) yield a linear cochlear response, they derived human cochlear IO curves at CF = 1000 Hz by plotting the masker levels for the low-frequency masker as a function of the masker levels for any other maskers.
The advantage of this method over those in previous studies is that fixing the probe level just above threshold almost guarantees that the CF of the cochlear region under study is close to fp and hardly varies with masker (input) level. For this reason and for convenience, CF will be used synonymously with fp hereafter, unless otherwise stated.
In the present study, TMCs are measured for a wide range of probe, and masker frequencies. It will be argued that, for low-frequency probes, the TMCs indicate compressed cochlear responses for maskers remote from CF. This undermines the assumptions of Nelson et al.’s method for deriving cochlear IO curves from TMCs. A variant of their method is suggested based on the more limited assumption that linear responses to low-frequency tones occur for high CFs only. The resulting IO curves are then used to investigate cochlear compression as a function of CF.
METHODS
TMCs were measured for probe frequencies of 500, 1000, 2000, 4000, and 8000 Hz, and masker frequencies of 0.5, 0.7, 0.9, 1.0, 1.1, and 1.6×fp. For any given pair (fm, fp), masking thresholds were measured for masker-to-probe intervals ranging from 10 to 100 ms in steps of 10 ms. Masker tones were gated with 4-ms raised-cosine rise and decay ramps and had a total duration of 108 ms. Probe tones had a total duration of 8 ms and were gated with 4-ms raised-cosine ramps (i.e., no steady-state portion). The level of the probe (Lp) was kept constant at 14 dB SL (i.e., 14 dB above the listener’s absolute threshold for the 8-ms probes).
Masking thresholds were measured using a two-interval, two-alternative forced choice paradigm. The subject was asked to identify the interval containing the probe. The initial masker level was fixed at 35 dB SPL. A two-down, one-up adaptive rule was used to estimate the 71% correct point on the psychometric function (Levitt, 1971). Each threshold measurement was repeated a minimum of 2 times, although most of them were repeated 3 or 4 times. The results were then averaged.
Data were collected on the left ear of three listeners with normal hearing. They were given at least ten hours of practice on the forward-masking task before data collection began.
RESULTS
A. Temporal Masking Curves
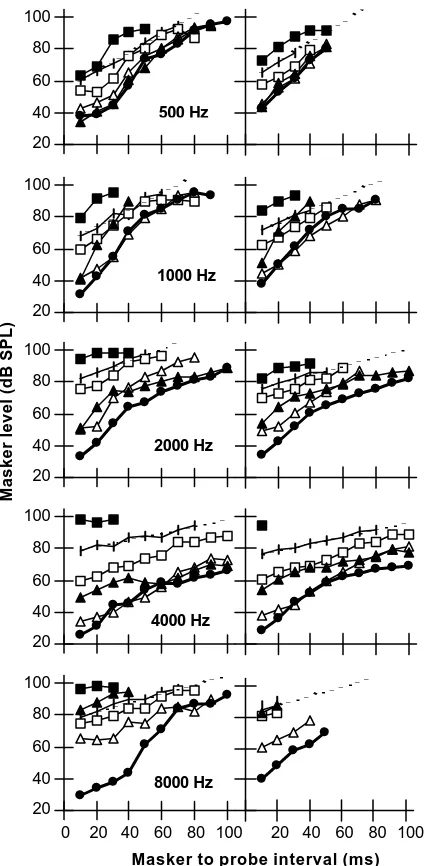
Results are shown in Fig. 1. At the lowest ∆t, the masker levels become higher as the deviation of the masker frequency from the probe frequency increases. This result reflects the tuning of the cochlear filters at low stimulus levels (Nelson et al., 2001).
to the probe frequency (filled circles). For fm = 0.5fp, the rate of increase can be described as regular and single-sloped. As fm approaches fp, however, it can be described in most cases as a two- or three-sloped function, with a steeper slope at low to moderate ∆t, and a shallower slope at high ∆t.
These observations are consistent with cochlear compression (Nelson et al., 2001). A masker whose frequency is close to the probe frequency, and hence to CF, are likely to be subject to varying amounts of compression as its level is adjusted to find the masking threshold for every ∆t. Therefore, its corresponding TMC reflects cochlear compression in addition to recovery from masking. This explains the steeper slope for part of the range of ∆t.
The two- or three-sloped pattern of the TMCs for maskers at the probe frequency is observed across fps. This suggests that the response of the human cochlea to tones at CF is compressed over the CF range from 500 to 8000 Hz.
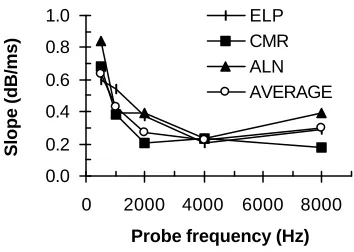
Most importantly, the data in Fig. 1 also suggests that for low CFs cochlear compression extends over a wide range of frequencies relative to CF. This is to say, for instance, that at CF = 500 Hz, the response to tones an octave below CF is still compressed. This suggestion is supported by the fact that for fm = 0.5fp the rate of recovery from masking with ∆t decreases with increasing probe frequency. That is, the slope of the TMC (in dB/ms) for the condition fm = 0.5fp decreases with fp. Figure 2 illustrates this finding by plotting the slope of straight lines best fit to the TMCs for the condition fm = 0.5fp as a function of fp. Given that the shape of the TMC is influenced by the recovery from masking and by the cochlear response, this result may be interpreted in two ways. It may mean that recovery from masking is faster for lower probe frequencies. This explanation, however, is unlikely. It would imply that the temporal resolution of the auditory system improves for low frequencies, and Shailer and Moore (1987) have shown that this is not the case. They studied the detection of gaps in sinusoids and concluded that it varies little for frequencies between 200 and 2000 Hz, and if anything becomes poorer at low frequencies. Therefore, the second, and most likely interpretation of the data in Fig. 2 is that the human cochlear response for CFs as low as 500 Hz is still compressive as the stimulus frequency is moved away below CF.
4000 Hz 500 Hz
1000 Hz
2000 Hz
8000 Hz 20
40 60 80 100
20 40 60 80 100
20 40 60 80 100
20 40 60 80 100
20 40 60 80 100
20 40 60 80 100
0 20 40 60 80 100
Masker to probe interval (ms)
[image:3.596.94.307.70.503.2]Masker level (dB SPL)
Figure 1. Iso-response temporal masking curves at the five probe frequencies tested (rows). Left column: representative listener ELP; Right column: average response for three listeners. Open symbols represent conditions where fm < fp. Filled symbols represent conditions where fm≥ fp. The dotted lines represent the best-fit (by least squares) straight lines for the condition fm = 0.5fp, the slopes of which are plotted in Fig. 2. Different symbols correspond to different masker frequencies (¯=0.5fp; o=0.7fp;
B. Derived Cochlear Input/Output Curves: Cochlear Compression As A Function Of CF
Cochlear IO curves were derived from the TMCs in Fig. 1 with a variant of a technique that was first described by Yates et al. (1990), and Cooper and Yates (1994) as a way to derive cochlear IO curves from auditory nerve discharge rates, and that was later adapted by Nelson et al. (2001) to derive IO curves from TMCs at 1000 Hz.
The original technique by Nelson et al. was based on the assumptions that the response of any point on the BM is linear for tones well below its CF, and that the time constant of recovery from masking was independent of probe, and masker frequencies. Under these assumptions, BM IO functions can be derived by plotting the level of the 0.5fp masker (regarded as BM output) as a function of the masker level (input) for each of the maskers.
However, the data in Fig. 1 contradicts the assumption that the response of the human BM is always linear to tones well below CF (see above). Therefore, a variant procedure is proposed based on the assumption that linear responses to tones well below CF occur only in the more basal part of cochlea (CFs ≥ 4000 Hz). It is still necessary to assume, however, that the time of recovery from masking does not vary with probe, and masker frequencies.
Here, the TMC for the 2000-Hz masker, 4000-Hz probe, has been chosen as the linear yardstick for all CFs, for two reasons. First, its slope is the least variable across listeners (see Fig. 2); and second, a large number of data points are available for every listener. For convenience, instead of using the experimental data directly, a linear-regressed, thus smoother, version of the data has been used (dotted lines in Fig. 1).
Cochlear IO curves derived with this new method are shown in Fig. 3. The output levels have been normalized to an estimate of the maximum gain of each auditory filter, calculated as the difference at ∆t = 10 ms between the masker levels for the conditions fm = fp, and fm = 0.5fp.
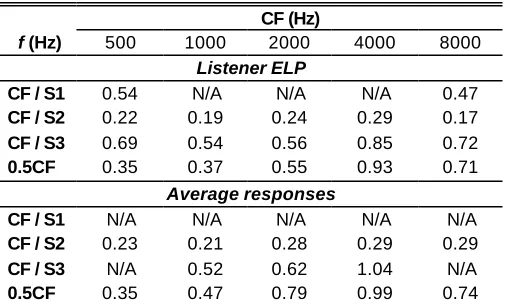
To facilitate the analysis, the nonlinearity at CF is considered as a two- or three-stage function showing markedly different slopes: S1, S2, and S3, at low, moderate, and high input levels, respectively (see Fig. 3). Table I shows the slope of the IO functions in every segment as a function of CF for listener ELP, and for the average data across the three listeners. It also shows the slope of the 0.5CF IO curves.
The average data in Table I shows that the slope of segment S2, where compression is more obvious, is approximately constant at 0.2-0.3 dB/dB across CF. This suggests approximately constant compression (inverse of the slope) of 3-5:1 across the CF range tested. Although a larger variability must be acknowledged when looking at the values for individual listeners (going from 0.15 dB/dB at 8000 Hz for ALN, to 0.38 dB/dB at 8000 Hz for CMR, not shown in the table), the statistical mode for the slope S2 across listeners and CFs is also within 0.2-0.3 dB/dB.
Table I also shows compressed responses (slopes < 1dB/dB) to stimuli well below CF (e.g. 0.5CF). Overall, there is a trend for the slope to increase with CF, suggesting that the degree of compression to below-CF tones decreases with CF. The slopes of the 0.5CF IO curves at 4000
0.0 0.2 0.4 0.6 0.8 1.0
0 2000 4000 6000 8000
Probe frequency (Hz)
Slope (dB/ms)
[image:4.596.98.275.85.211.2]ELP CMR ALN AVERAGE
Hz are very close to unity because these curves were considered the linear yardstick for deriving all other IO curves.
DISCUSSION
This study suggests that the response of the human cochlea to tones at CF is compressed over the studied CF range, and that, on average, the amount of compression at moderate levels is approximately constant (~3-5:1) across CFs. Additionally, it suggests that compression spans a wider frequency range relative to CF in the low CFs, and that it may even be more severe at low CFs.
These results are based on the assumption that the response to below-CF tones is linear at CFs of 4000 Hz and above, but allows for the possibility that the response may be compressed for lower CFs. Support in favour of this assumption comes from the data in Fig. 2. An alternative explanation could be that the temporal resolution of the auditory system improves for low CFs. This is, however, unlikely, given that gap detection in sinusoids hardly varies from 200 to 2000 Hz (Shailer and Moore, 1987). Support in favour of the present assumption also comes from BM recordings in chinchilla. BM responses to below-CF tones appear to be compressed for CFs around 400-800 Hz (Rhode and Cooper, 1996), but linear for CFs from 5500 to 14000 Hz (Rhode and Recio, 2000).
It could still be argued that the compression at low CFs inferred from Fig. 1 does not originate in the cochlea. It could reflect, instead, other nonlinear processes in the auditory receptor, such as the saturation of auditory-nerve fibre discharge rates, which needs not be frequency-specific relative to CF. 25 35 45 55 65 500 Hz S2 S3 S1 20 30 40 50 60 70 1000 Hz S2 S3 20 30 40 50 60 2000 Hz S2 S3 20 30 40 50 60 4000 S3 S2 20 30 40 50 60 70 8000 Hz S2 S3 S1 25 35 45 55 65 S2 only 20 30 40 50 60 70 S2 S3 20 30 40 50 60 S2 S3 20 30 40 50 60 S2 S3 20 30 40 50 60 70 S2 only
25 45 65 85 105 25 45 65 85 105
Input (dB)
[image:5.596.95.321.74.621.2]Output (dB)
Figure 3. Cochlear input/output curves derived from th e TMCs in Fig. 1. Left column = listener ELP; Right column = average. Each row corresponds to a different CF. Different symbols correspond to different stimulus frequencies (¯=0.5CF; o=0.7CF; r=0.9CF; l=CF;
Table I. Slopes (dB/dB) of cochlear IO curves in Fig. 3 as a function of CF. Slopes are given for IO curves corresponding to stimulus frequencies (f ) of CF and 0.5CF. For the IO curves at CF, two or three slopes are given (CF/S1, CF/S2, CF/S3) corresponding to each of the characteristic segments depicted in Fig. 3. The IO curves were derived assuming a linear cochlear response to a 2000-Hz tone at the BM site tuned at 4000 Hz. N/A: segment not observed, or insufficient data points for a good slope estimate.
In contrast to the present results, Plack and Oxenham (2000) suggested that compression on the human BM increases from 1.3:1 at 500 Hz, to 2.8:1 at 4000 Hz, or 2.4:1 at 8000 Hz. Cooper and Yates (1994) also report a distinct variation in the degree of compression of the guinea pig cochlea as a function of CF. Their compression estimates vary from 2:1 for CFs < 4000 Hz, to as much a 7:1 for CFs > 4000 Hz. Both these studies assumed, however, linear responses to low frequency tones (relative to CF) for any CF. If this were not the case, as the present report suggests, their estimates of compression for tones at CF should be regarded as relative to the compression for the lower frequency tones. Estimates of relative compression from the present data can be derived from the values in Table I as the ratio of the slopes of derived IO curves for 0.5CF and CF (S2). The resulting values range from 1.5:1 at 500 Hz, to 3.4:1 at 4000 Hz or 2.55:1 at 8000 Hz. These estimates closely match those reported by Plack and Oxenham in human, and show the same trend as reported by Cooper and Yates in guinea pig.
ACKNOWLEDGEMENTS
This work was supported by the Consejería de Sanidad of the Junta de Comunidades de Castilla-La Mancha (ref. 01044), and by EPSRC Project Grant GR/R65794/01.
REFERENCES
Baker, R.J., Rosen, S., and Darling, A. (1998)."An efficient characterisation of human auditory filtering across level and frequency that is also physiologically reasonable," in Psychophysical and Physiological Advances in Hearing, edited by A.R. Palmer, Rees, A., Summerfield, Q., and Meddis, R (Whurr Publisher, London).
Cooper, N.P. and Yates, G.K. (1994). "Nonlinear input-output functions derived from the responses of guinea-pig cochlear nerve fibres: Variations with characteristic frequency," Hear. Res.78, 221-234.
Glasberg, B.R. and Moore, B.C.J. (2000). "Frequency selectivity as a function of level and frequency measured with uniformly exciting notched noise," J. Acoust. Soc. Am. 108, 2318-2328.
Levitt, H. (1971). "Transformed up-down methods in psychoacoustics," J. Acoust. Soc. Am. 49, Suppl-
Moore, B.C. and Glasberg, B.R. (1983). "Growth of forward masking for sinusoidal and noise maskers as a function of signal delay; implications for suppression in noise," J. Acoust. Soc. Am. 73, 1249-1259.
Nelson, D.A. and Freyman, R.L. (1987). "Temporal resolution in sensorineural hearing-impaired listeners," J. Acoust. Soc. Am. 81, 709-720.
Nelson, D.A., Schroder, A.C., and Wojtczak, M. (2001). "A new procedure for measuring peripheral compression in normal-hearing and hearing-impaired listeners," J. Acoust. Soc. Am. 110, 2045-2064.
Oxenham, A.J. and Plack, C.J. (1997). "A behavioral measure of basilar-membrane nonlinearity in listeners with normal and impaired hearing," J. Acoust. Soc. Am. 101, 3666-3675.
Plack, C.J. and Oxenham, A.J. (2000). "Basilar-membrane nonlinearity estimated by pulsation threshold," J. Acoust. Soc. Am. 107 , 501-507.
Rhode, W.S. and Cooper, N.P. (1996). "Nonlinear mechanics in the apical turn of the chinchilla cochlea in vivo," Audit. Neurosci. 3, 101-121.
Rhode, W.S. and Recio, A. (2000). "Study of mechanical motions in the basal region of the chinchilla cochlea," J. Acoust. Soc. Am. 107, 3317-3332.
Shailer, M.J. and Moore, B.C. (1987). "Gap detection and the auditory filter: phase effects using sinusoidal stimuli," J. Acoust. Soc. Am. 81, 1110-1117.
Yates, G.K., Winter, I.M., and Robertson, D. (1990). "Basilar membrane nonlinearity determines auditory nerve rate-intensity functions and cochlear dynamic range," Hear. Res. 45, 203-220.
CF (Hz)
f (Hz) 500 1000 2000 4000 8000
Listener ELP
CF / S1 0.54 N/A N/A N/A 0.47
CF / S2 0.22 0.19 0.24 0.29 0.17
CF / S3 0.69 0.54 0.56 0.85 0.72
0.5CF 0.35 0.37 0.55 0.93 0.71
Average responses
CF / S1 N/A N/A N/A N/A N/A
CF / S2 0.23 0.21 0.28 0.29 0.29
CF / S3 N/A 0.52 0.62 1.04 N/A