WATCHING RIPPLES ON CRYSTALS USING ULTRASHORT LIGHT PULSES
PACS Nos. 63.20.Dj, 77.65.Dq, 68.35.Iv, 62.65.+k
Wright, Oliver B.: Sugawara, Yoshihiro: Matsuda, Osamu: Gusev, Vitali E.1
Dept. of Applied Physics, Faculty of Engineering, Hokkaido University Sapporo 060-8628
Japan
Tel. +81-11-706-7191 Fax. +81-11-706-7191
Email: olly@eng.hokudai.ac.jp
1Université du Maine, Av. O. Messiaen
72085 Le Mans France
ABSTRACT We demonstrate a new optical method for the dynamical imaging of surface acoustic waves at frequencies up to 1 GHz with picosecond temporal and micron spatial resolutions. Using samples with isotropic or anisotropic substrates coated with metallic thin films, we image the surface wave propagation, and give examples of how the dispersion relation can be directly derived from such data.
The optical generation and detection of surface acoustic waves (SAW) can be used to determine the thickness and elastic properties of thin films of micron or sub-micron thickness non-destructively. Recently SAW have been studied extensively because of the ubiquity of SAW filters in communication systems. One of the main interests in SAW physics is the surface phonon focusing effect, seen in anisotropic materials. The SAW energy can be strongly concentrated in certain directions because the slowness surface for the material becomes concave in these directions. Surface phonon focusing has been studied theoretically for many years [1-3]. In SAW experiments using laser ultrasonics techniques, two kinds of SAW excitation have predominantly been used: one involves focusing the laser radiation to a point or line on the sample surface [4-6]; the other involves transient gratings produced by crossing two laser pulses at the sample surface [7-9]. The intrinsic SAW propagation properties of anisotropic materials, such as the cuspidal structure of the wavefronts, become apparent when the laser radiation is focused to a point source.
Here we present a new optical method for real-time imaging of SAW with wavelengths of a few microns and frequencies in the 100 MHz to 1 GHz range using ultrashort-pulse optical excitation and interferometric detection[18]. With this method SAW at frequencies up to 1 GHz are generated from a point source in isotropic and anisotropic materials, allowing animations to be produced with picosecond temporal and micron spatial resolution.
PROBE PULSE
POLARIZATION
45 DEGREES
OBJECTIVE LENS
ON X-Y STAGE
PUMP
PULSE
SAMPL
E
OBJECTIVE
LENS
l
/4
l
/4
PBS TILTED
BY
45
DEGREES
NPB
[image:2.595.111.507.166.446.2]PBS
PBS
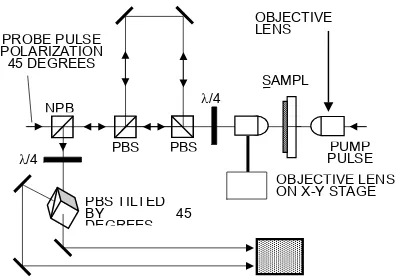
Fig. 1. Interferometric set-up for SAW imaging. PBS, NPBS and l/4 stand for polarizing beam splitter, non-polarizing beam splitter and quarter-wave plate, respectively.
Experiments are carried out with metallic thin films on transparent substrates. The SAW are excited by visible pump pulses of duration ~ 1 ps, repetition rate 80 MHz (one pulse every 12.5 ns), wavelength 415 nm, and incident fluence ~1 mJcm-2, derived from a mode-locked Ti:sapphire laser. The pump light is focused at normal incidence through a long-working-distance microscope objective lens from the substrate side of the sample to a spot of diameter ~2 mm (full width at half maximum). (Increasing the spot size results in longer wavelength SAW generation.) For the present samples, the generation is governed by the thermoelastic effect. For the case of a thin film on a substrate the SAW phase velocity will vary significantly with acoustic wavelength when the film dimensions are of the same order as the film thickness [19]. For this reason the optimum choice of pump spot size, when it is required to probe the film thickness through SAW measurements, will depend on the film in question. The SAW detection is done interferometrically by two probe pulses of wavelength 830 nm, temporally separated by approximately 500 ps, focused at normal incidence through another objective lens onto the front surface of the film. We use a highly stable common-path interferometer [20], slightly modified from the form proposed by Hurley et. al. (Fig. 1). A tilted polarizing beam splitter is used instead of a polarizer, and this makes it possible to obtain the optical phase change signal df
directly. By
0 .2
- 0 .2 0 .0
1 .0
- 0 .1
0 .5
1 0 0
0
2 0
4 0
6 0
8 0
(d)
(a)
(b)
(c)
(d)
POSITION (
m
m )
P
H
A
S
E
C
H
A
N
G
E
( A. U. )
Fig. 2. a), b), and c): Three consecutive 100 mm´100 mm images at 400 ps intervals of surface phonon wave fronts in a 70 nm gold film on a glass substrate. b) corresponds to an average time of ~1.2 ns after the pump pulse arrival. d): Offset image showing more detail of the ring pattern, corresponding to a time ~5.1 ns after the pump pulse arrival. e): Horizontal section through the centre of b). The dotted line shows the smoothing function used to extract the data for one pulse.
In order to illustrate the method we shall first describe the application to an isotropic sample. Figure 2(a)-(c) shows three frames from a animation corresponding to a 100 mm´100 mm region of a sample of polycrystalline gold of thickness 70 nm prepared on a crown-glass substrate of thickness 1 mm by thermal evaporation. The concentric series of rings arises because of the 12.5 ns period for the arrival of pump optical pulses at the centre of the pattern. The circular shape is expected because both film and substrate are isotropic (or at least show axial symmetry). The three images are equally spaced in time by 400 ps. These images are superficially similar to that of the surface of a liquid disturbed by a falling drop. Like ripples on a liquid surface, surface phonons in thin films are subject to dispersion, and this tends to increase the width of the pulse as it propagates outwards[19]. This is evident by comparing the larger width of an outer ring with an inner ring in any frame in Fig. 2(d). A complete animation corresponds to a temporal duration of 12.5 ns; after that the pattern repeats itself cyclically. We have, for example, taken such animations with a total of 25 frames.
[image:3.595.94.421.72.473.2]wavevector) of the time-dependent coherent surface disturbance f(r,t), a real function, where
f(r,t) represents the experimental difference in phase df
:
f
(
r
,
t
)
=
F
(
k
,
t
) exp
[
i
k
×
r
]
d
2k
(1) -¥¥
ò
=
Re
F
0(
k
) exp
[
i
(
k
×
r
-
w
(
k
)
t
)
]
d
2k
-¥ ¥
ò
,
F
(
k
,
t
)
=
1
2
F
0(
k
)exp[
-
i
w
(
k
)
t
]
+
F
0*
(
-
k
)exp[
i
w
*(
-
k
)
t
]
{
}
, (2)where the wave propagation is assumed to be governed by a single mode and by a linear wave equation that may in general include loss terms. If three consecutive F(k,t) at constant interval t1
are known (with the central time defined here as t=0), the use of Eq. (2) allows us to obtain w(k):
1.2
0.0 0.6
3.0
0.0 1.0 2.0
1.0
0.0 0.5
0
0.0 0 0
cos[
w
(
k
)
t
1]
=
F
(
k
,
-
t
1)
+
F
(
k
,
t
1)
2
F
(
k
,0)
, (3)provided that (i) w(k)=w*(k), implying negligible acoustic attenuation, and (ii) w(k)=w(-k), implying a laterally homogeneous sample. These two conditions are satisfied for our probed areas. Equation (3) gives w(k) for a single mode from three images of f(r,t).
3.
1. 2.
WAVENUMBER (
m
m
-1)
AMPLITUDE
F
R
EQUENCY
(a)
(b)
Fig. 3. a): Experimental (points) and theoretical (solid line) dispersion relation for the 70 nm gold film on a glass substrate. b): Experimental normalized wave vector spectrum |F0(k)|.
[image:4.595.158.387.337.613.2]We have performed calculations for the first Rayleigh-like mode of the gold-glass combination[19], using the 70 nm film thickness and literature values of the elastic constants (in particular, the substrate Young’s modulus E=71.5 GPa, the Poisson’s ratio n=0.219, and the density r=2.55 gcm-3). The agreement between the calculated and experimental dispersion relation in Fig. 3 is excellent. This suggests that significant excitation of only this particular mode occurs for the frequency band concerned. Using the above equations we have also evaluated the experimental wave vector spectrum |F0(k)| from the data. This is plotted in Fig. 3(b). For the typical sound velocity of ~3000 ms-1 appropriate here, frequencies from about 100 MHz to 1 GHz are excited, with a peak at 300-400 MHz. This compares favourably with rough estimates based on the lateral spot size of the pump beam (moderated by the detection with the probe beam).
0 .3
0 .0 0 .1 0 .5
- 0 .5 0 .0
Fig. 4. (a) Image of SAW wavefronts in a 150 mm´250 mm region on the (100) surface of single-crystal TeO2 coated with a 400 nm gold film. (b) Intensity image, proportional to the
square of (a).
We now turn to an anisotropic, single crystal sample. Figure 4(a) shows a SAW image of a 150
mm´250 mm region of a polycrystalline gold film of thickness 400 nm on the (100) surface of a single-crystal TeO2 substrate of thickness 1 mm at a fixed delay time. The vertical and horizontal
directions correspond to [001] and [010] respectively. The SAW wavefronts are approximately elliptical in shape, as expected from the tetragonal symmetry of the substrate. Strong focusing is observed at ~81o from [010] to [001]. This can be seen more clearly in Fig. 4(b), where the intensity has been plotted [proportional to the square of the amplitude in Fig. 4(a)]. Theoretical considerations ignoring piezoelectricity and the finite film thickness show an expected focusing direction at ~84o, in reasonable agreement with experiment [21]. This shows that surface phonon focusing can be imaged effectively with our method.
In order to test the measurement technique on a structure that is inhomogeneous in the lateral direction, we have also imaged the edge of a gold film of thickness 1 mm on a silica substrate of thickness 1 mm. The results are shown in Fig. 5. In this image the reflection of the surface waves from the sample edge is clearly visible. The exact acoustic reflection coefficient is expected to depend on the topography of the film edge. Compared to the data of Fig. 2 the dispersion is much more evident because of the greater thickness of the gold film here. Although the present data represent a very simple example, by imaging such inhomogeneous geometries in real time, we expect that our method will find many applications in the field of surface-acoustic-wave device evaluation.
[image:5.595.97.343.246.397.2]2 .0
- 2 .0 0 .0
1 0 0
0
5 0
1 0 0
[image:6.595.170.388.67.236.2]0
5 0
Fig. 5. Image of surface phonons reflected from a straight surface. The sample (upper) region) is a 1 mm gold film on a silica substrate (lower region). The horizontal and vertical scales are in microns.
waves at frequencies in the 100 MHz-1 GHz range with picosecond temporal and micron spatial resolutions using an ultrafast optical pump and probe technique. Isotropic samples show circular wavefronts. Anisotropic substrates more complicated wavefronts determined by surface phonon focusing effects. We have also shown how wavefronts in laterally inhomogeneous geometries can be mapped. In future we expect to see a wide variety of uses of this technique in both fundamental physics and in the evaluation of SAW devices.
[1] H. Shirasaki and T. Makimoto, J. Appl. Phys. 49, 658 (1978); 49, 661(1978); 50, 2795 (1979).
[2] S. Tamura and K. Honjo, Jpn. J. Appl. Phys. 20, Suppl. 3, 17 (1980).
[3] R. E. Camley and A. A. Maradudin, Phys. Rev. B 27, 1959 (1983); A. Every, Phys. Rev. B 33, 2719 (1986).
[4] A. Neubrand and P. Hess, J. Appl. Phys. 71, 227 (1992).
[5] A. A. Maznev, A. A. Kolomenskii and P. Hess, Phys. Rev. lett. 75, 3332 (1995). [6] Y. Shen and P. Hess, J. Appl. Phys, 82, 4758 (1997).
[7] A. Harata, H. Nishimura and T. Sawada, Appl. Phys. Lett. 57, 132 (1990).
[8] H.Nishino, Y. Tsukahara, Y. Nagata, T. Koda and K. Yamanaka, Jpn. J. Appl. Phys. 32, 2536 (1993).
[9] Maznev, A. Akthakul and K. A. Nelson, J. Appl. Phys. 86, 2818 (1999).
[10] J. P. Wolfe, Imaging Phonons (Cambridge University Press, Cambridge, U.K., 1998). [11] A. A. Kolomenskii, A. A. Maznev, JETP Lett. 53, 423 (1991); Phys. Rev. B 48, 14502
(1993).
[12] R. E. Vines, Shin-ichiro Tamura, J. P. Wolfe, Phys. Rev. Lett, 74 2729 (1995).
[13] E. Zolotoyabko, D. Shilo, W. Sauer, E. Pernot and J. Baruchel, Appl. Phys. Lett. 73, 2278 (1998).
[14] G. Eberharter and H. P. Feuerbaum, Appl. Phys. Lett. 37, 698 (1980).
[15] G. Behme, T. Hesjedal, E. Chilla and H. -J. Frohlich, Appl. Phys. Lett. 73, 882 (1998). [16] K. Nakano, K. Hane, S. Okuma and T. Eguchi, Opt. Rev. 4, 265 (1997).
[17] M. Clark, F. Linnane, S. D. Sharples and M. G. Somekh, Appl. Phys. Lett. 72, 1963 (1998); M. Clark, S. Sharples and M. Somekh, Meas. Sci. Technol. 11, 1792 (2000).
[18] Y. Sugawara, O. B. Wright, O. Matsuda, M. Takigahira, Y. Tanaka, S. Tamura and V. E. Gusev, Phys. Rev. Lett. 88, 185504 (2002).
[19] G. W. Farnell and E. L. Adler, in Physical Acoustics, edited by W. P. Mason and R. N. Thurston (Academic, New York, 1972), vol. 9, p. 35.
[20] D. H. Hurley and O. B. Wright, Opt. Lett. 24, 1305 (1999).