variation of four pine species along environmental
gradients
Natalia Vizcaıno-Palomar1,2, Ines Ib anez~ 3, Santiago C. Gonzalez-Martınez1,4,5, Miguel A. Zavala2& Ricardo Alıa1,4
1Department of Forest Ecology and Genetics, Forest Research Centre (INIA), Ctra. A Coruna, km 7.5, 28040 Madrid, Spain~
2Forest Ecology and Restoration Group, Department of Life Sciences, Universidad de Alcala, Science Building, Campus Universitario, 28871 Alcala de Henares, Madrid, Spain
3School of Natural Resources and Environment, University of Michigan, Ann Arbor, Michigan 48109
4Sustainable Forest Management Research Institute, University of Valladolid-INIA, Avd. Madrid s/n, 34004 Palencia, Spain
5BIOGECO, INRA, University of Bordeaux, 33610 Cestas, France
Keywords
Bayesian modeling, climatic and geographical clines, environmental gradients, functional trait, Iberian Peninsula, intraspecies variability, provenance tests.
Correspondence
Ricardo Alıa, Department of Forest Ecology and Genetics, Forest Research Centre (INIA), Ctra. A Coru~na, km 7.5, 28040 Madrid, Spain.
Tel: +34913473959; Fax: +34913476867; E-mail: alia@inia.es
Funding Information
This work was supported by the Spanish Ministry of Science and Innovation through grants VULPINECLIM-CGL2013-44553-R, REMEDINAL3 (CAM, S2013/MAE-2719, 2014-2018) and ADAPCON (CGL2011-30182-C02-01). N.V.P. was supported by fellowship FPI-MCI (BES-2009-025151).
Received: 16 August 2015; Revised: 22 February 2016; Accepted: 20 March 2016
doi: 10.1002/ece3.2153
Abstract
Plant species aboveground allometry can be viewed as a functional trait that reflects the evolutionary trade-off between above- and belowground resources. In forest trees, allometry is related to productivity and resilience in different environments, and it is tightly connected with a compromise between effi-ciency-safety and competitive ability. A better understanding on how this trait varies within and across species is critical to determine the potential of a spe-cies/population to perform along environmental gradients. We followed a hier-archical framework to assess tree height-diameter allometry variation within and across four common EuropeanPinusspecies. Tree height-diameter allome-try variation was a function of solely genetic components –approximated by either population effects or clinal geographic responses of the population’s site of origin–and differential genetic plastic responses–approximated by the inter-action between populations and two climatic variables of the growing sites (temperature and precipitation)–. Our results suggest that, at the species level, climate of the growing sites set the tree height-diameter allometry of xeric and mesic species (Pinus halepensis, P. pinaster and P. nigra) apart from the boreal species (P. sylvestris), suggesting a weak signal of their phylogenies in the tree height-diameter allometry variation. Moreover, accounting for interpopulation variability within species for the four pine species aided to: (1) detect genetic differences among populations in allometry variation, which in P. nigra and
P. pinaster were linked to gene pools –genetic diversity measurements–; (2) reveal the presence of differential genetic variation in plastic responses along two climatic gradients in tree allometry variation. In P. sylvestrisand P. nigra, genetic variation was the result of adaptive patterns to climate, while in
P. pinaster and P. halepensis, this signal was either weaker or absent, respec-tively; and (3) detect local adaptation in the exponent of the tree height -diameter allometry relationship in two of the four species (P. sylvestris and
Introduction
Aboveground allometry is considered a functional trait that links the changes in total height to those in stem diameter and reflects the evolutionary outcome in plant species dynamics for above and belowground resources (Halle et al. 1978; King 1996). Both height and stem diameter are tightly associated with species foraging and resource allocation strategy (Tilman 1988; Poorter et al. 2012): while tree height reflects a strategy for securing carbon profit via light capture (Moles et al. 2009), stem diameter is closely related to mechanical support and water-absorbing capacity (McMahon 1973; Niklas 1993; Bullock 2000). A finite set of allometric outcomes is then expectable, due to trade-offs in plant allocation strategies along resource gradients (sensu Tilman 1988) or biome-chanical and hydraulic constraints (e.g., Ryan and Yoder 1997; Chave et al. 2005; M€akel€a and Valentine 2006).
Tree height-diameter allometry has profound effects on species fitness and consequently on ecosystem structure. It correlates with bioclimatic variables (e.g., Aiba and Kohyama 1996; Lopez-Serrano et al. 2005; King et al. 2006), and can change along biotic and abiotic gradients such as those for temperature, aridity, and competition (e.g., Banin et al. 2012; Lines et al. 2012). However, intraspecific variation in allometry has usually been neglected and most studies have focused either on the species level or on the broad geographical scales (Chave et al. 2005; Lopez-Serrano et al. 2005; Dietze et al. 2008; Lines et al. 2012; Poorter et al. 2012; but see Vieilledent et al. 2010; Pretzsch and Dieler 2012; that considered individual variability). The extent and patterns of varia-tion in interpopulavaria-tion genetic in tree height-diameter allometry still remain unclear. Those patterns could be as a result of adaptive or neutral genetic processes, such as past events, for example, migration, bottlenecks, and drift, at different scales (species, population or individual), of plastic responses to the environment, or by any combina-tions of them. Consequently, aboveground allometry emerges as a comprehensive and integrative trait in which the pattern of allocation variation within species could be driven by climate and interpopulation genetic variation. A deep understanding of these interconnected levels of vari-ability (species and populations) in tree height-diameter allometry is necessary to forecast the full potential of tree species to adapt and/or evolve under climate change con-ditions (e.g., Benito-Garzon et al. 2011; Valladares et al. 2014).
Common garden experiments are established for testing genetic differences among populations grown under similar environmental conditions and generate valuable informa-tion for the study of intraspecific genetic variainforma-tion (e.g., Matyas 1996; Alberto et al. 2013). Multilocality common
gardens, additionally, allow studying phenotypic plastic responses along environmental gradients and to identify genetic variation on them (i.e., population-environment interaction) and the adaptive value of those responses as well (i.e., correlations between the growing environments and local environments of population’s origin).
In this study, we used total height and stem diameter– over bark– measured in multilocality common garden tests to assess allometry relationships for the four most planted European pine species: Pinus sylvestrisL., P. nigra
Arnold, P. pinaster Aiton, and P. halepensis Miller. The first two species (P. sylvestrisand P. nigra)belong to the
Pinus subsection that corresponds to Eurasian pines; and the last two species to the Pinaster subsection which relates to Mediterranean pines. Accordingly, these species
display differentiated demographic backgrounds and
genetic compositions resulting in a predictable pattern along temperature and water availability gradients across Europe (Richardson 1998; Tapias et al. 2004; Soto et al. 2010). We implemented a flexible log-linear model taking into consideration each species’ population origin and associated geographic characteristics (to account for intraspecific genetic variation), and the climatic character-istics of the growing site (to account for the among-site variation). Correspondingly, we tested three hypotheses: (1) the patterns of height-diameter allometry variation in pines are driven by both the species and the interpopula-tion variainterpopula-tion; (2) at the species level, tree allometry will vary depending on the climatic characteristics of the spe-cies, and especially with marked differences among
Eura-sian an Mediterranean species; (3) interpopulation
variation in allometry could be the result of adaptation to local environments –namely climate and/or geographical variables of populations’ site of origin– or historical events that took place in the past of the species. Testing these hypotheses will allow us to understand the underly-ing abiotic drivers that shape allometry variation at two interconnected levels, species and populations, and to identify the class of adaptive responses if existent. Under-standing phenotypic integration of tree species responses along abiotic conditions could then assist in forecasting the performance of forest species and populations in the context of global warming.
Methods
Plant material and common garden provenance tests
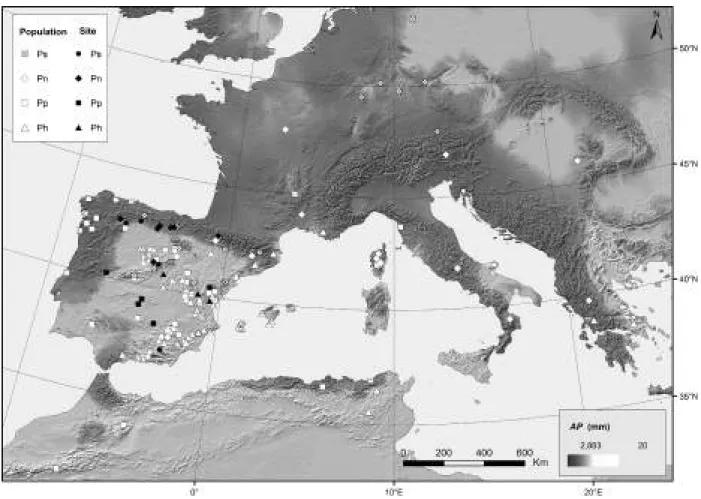
Aboveground allometry was measured in multilocality common garden provenance tests located in Spain for four pines species: Pinus sylvestris, P. nigra, P. pinaster,
of the species, mostly from the Iberian Peninsula (Spain and Portugal), were sampled by collecting seed lots from at least 25 mother trees with a 50-m separation distance. Plants originating from the seed lots were collected in dif-ferent populations (22 forP. sylvestris, 23 for P. nigra, 52 for P. pinaster, and 56 for P. halepensis) and established in comparative common garden provenance tests for each species (Fig. 1 and see Table S1 in Supporting Informa-tion).
Measurements were collected at 11 1 years of age, depending on the common garden tests, for two variables:
height(total height in cm, measured with a pole) and dbh
(diameter at breast height [130 cm] in mm, measured with a caliper). A common age was chosen to minimize species differences along their ontogenies (Lopez-Serrano et al. 2005), and avoid confusion of allometric changes due to size, known as ‘passive or apparent plasticity’ (Wright and Mcconnaughay 2002). We also selected a young age to minimize interpopulation competition effects in the experimental design. A previous study using
the same experiment setup as in the present research did not find either inter- or intrapopulation competition effects in any of the two variables measured (height and
dbh) in 32-year-old P. pinaster individuals (Alıa et al. 2001).
In total, we used data from 4853P. sylvestristrees from 22 populations planted in 6 sites; 3644P. nigratrees from 23 populations in 8 sites; 9976 P. pinastertrees from 54 populations in 4 sites; and 1928 P. halepensis trees from 56 populations in 3 sites.
Climatic and geographical data
Each site was characterized by a set of 47 climatic vari-ables: minimum, average and maximum mean monthly temperature, minimum and maximum average tempera-ture of the coldest and warmest months, and total and seasonal precipitation. As we lacked real climate data from weather stations, we estimated these variables based upon Gonzalo-Jimenez’s (2010) climatic model for the
Iberian Peninsula, with a 1-km2 spatial resolution, from climate data gathered between 1951 and 1999 (see Appendix S1 for further information).
According to both literature and exploratory analyses, we selected the subset of climatic variables at the growing sites most relevant to plant allometry for the four species. The selected variables were MMT (minimum average temperature of coldest month, °C) and AP (annual pre-cipitation, mm). Both MMT and AP affect physiological and growth processes of plant species in the Mediter-ranean region (Thompson 2005) and have been consis-tently used in previous studies (e.g., Wang et al. 2006; O’Neill and Nigh 2011; Leites et al. 2012). Moreover, these variables presented substantial correlation with
height and dbh variables (see Table S3). Geographical variables of the populations’ site of origin, such as lati-tude, longitude and altilati-tude, are surrogates for environ-mental conditions, for example, the amount of heat energy received relative to the sun angle, temperature, humidity, and solar radiation; and they can usually reflect adaptation patterns to local conditions (see Alberto et al. 2013). Climatic variables of the growing sites and geo-graphic variables of the populations’ site of origin were then standardized before analyses to ease comparison among variables in the model.
Although the number of growing sites is low (ranging between 3 and 8), they cover most of the natural climatic range associated with each species distributional range, including contrasting climates (Ruiz-Benito et al. 2013) (see Fig. S1).
Statistical models
We estimated tree height as a function of diameter using three classic allometric functions (Linear, Power, and Gompertz), and two link functions (normal and lognor-mal) and implemented generalized linear models (GLMs). The best allometric model fitting the data was selected using the Deviance Information Criteria, DIC (Spiegelhal-ter et al. 2002). A power function with a lognormal link function was the best model for two of the four species, and the second best model for the other two species (see Table S2). We selected a common allometric model, power function with a lognormal link, for the four species to facilitate parameter comparisons.
Based on this allometric model, we constructed a hier-archical model (Clark 2005, 2007). These models are more appropriate to connect and represent the biological hierarchy of the data, for example, populations within species. To build the best final model, we considered sev-eral variations of the basic model (i.e., in equation 1), where aandc scaling parameters were constant, and they were estimated with different combinations of the
variables associated with the growing sites and the origin of populations. The best final model structure was selected based on both biological relevance and the DIC criterion.
The final model estimated tree height allometry as a combination of climate at the growing site (s) and geo-graphic characteristics at the origin site of the population (p).
Considering an individuali, from populationpgrowing in growing site s, its height-diameter allometry was mod-eled as:
Likelihood: heighti ~log Normal (Hi, r2) and the
fol-lowing process model:
Hi¼ lnðapðiÞ;sðiÞÞ þcpðiÞdbhi (1)
where the scaling coefficient lnðapðiÞ;sðiÞÞwas estimated as:
lnðapðiÞ;sðiÞÞ ¼a1pþa2pMMTsþa3pAPs (2)
and the scaling exponent,cpðiÞ, was estimated as:
cpðiÞ ¼b1þb2 LATpþb3ALTp (3)
Tree height-diameter allometry, therefore, is the out-come result of population genetic effects on the basal height, parameterized in a1p; plus a genetic (population)
clinal geographical pattern of the scaling exponent on lati-tude and altilati-tude (b29 LATp, b39 ALTp), and of
genetic differential plastic responses along temperature and or precipitation gradients of the growing site (a2p9MMTs, a3p9 APs). Because all explanatory
vari-ables were standardized, parameter a1p was the allometric
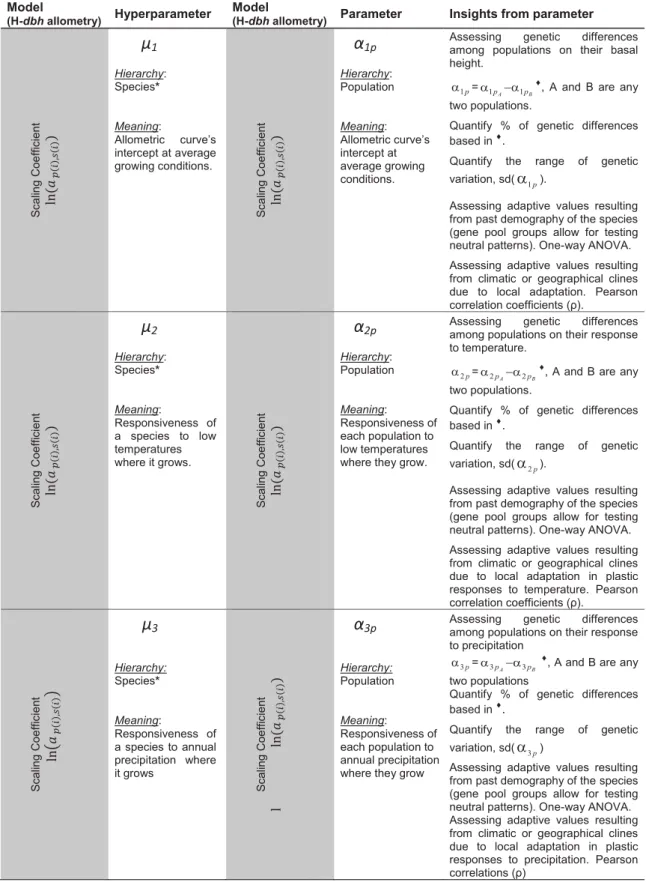
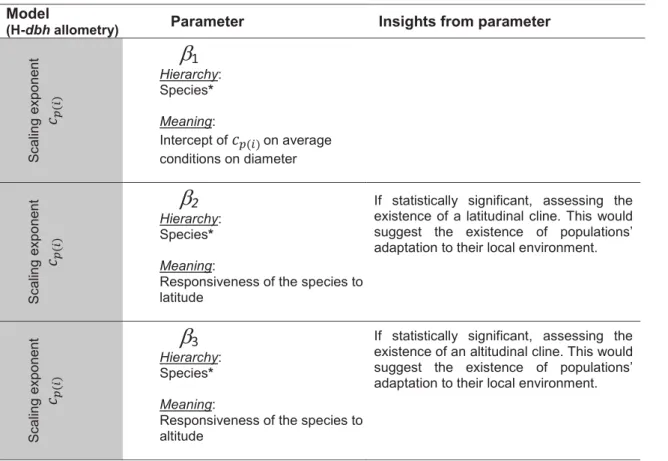
curve’s intercept at average climate conditions of across all growing sites; and likewise holds for b1. A summary of model parameters, significance, and insights that can be assessed on each one is shown in Figure 2.
Model parameters estimation and post hoc comparisons
Parameters were estimated following a Bayesian approach highly suited for hierarchical analyses (Gelman and Hill 2007). Each of the population level parameters, ap, was
estimated from a species-level prior normal distribution, with hyperparameters l* and r2
a;apNðl;r2aÞ,
esti-mated from noninformative prior distributions l*~N
(0, 1000) and ra* ~Uniform (0, 100). These species-level parameters l* and r2
Parametersb*were also estimated from noninformative prior distributions, b* ~N (0, 1000). Variance associated with the individual random effects was estimated as 1/ r2 ~
Gamma (0.01, 0.01). As standard deviation of resid-ual errors around a fitted power function might increase with diameter, we tested whether the residuals were a lin-ear function of diameter, as recommended in Lines et al. (2012). However, our residuals did not show this trend, so we considered unnecessary to account for diameter size in the estimation of the variance.
We formally tested marginal significant intraspecific genetic differences in ap for each species by computing
all pairwise combinations of population differences accounting for the 95% credible interval, CI, of the esti-mated parameter distribution (e.g., intraspecific genetic differences inap¼apAapB, beingAandBtwo popu-lations of a specific pine species), while the rest of vari-ables were kept to their mean values in the range, that is why we refer to these differences as “marginal”. Two pop-ulations were significantly different if zero was not included in the credible interval around their difference.
Additionally, we quantified the level of marginal
intraspecific genetic differences as the percentage of the total number of significant pairwise comparisons relative to the total number of pairwise comparisons within
species. Finally, to end the characterization of intraspecific genetic variability within species, we provided the range of variability among populations within species as the standard deviation of ap, that is, the set of parameters
estimated for each population.
Models were run in OpenBUGs (version 3.2.2 rev 1063) (Thomas et al. 2006). Three chains were run for ~50,000 iterations, and parameters convergence was reached after
~25,000 iterations. After the burn-in period, chains were thinned (every 100) to reduce autocorrelation, and then, posterior parameter values (mean and 95% credible inter-vals) were calculated. Plots of predicted vs. observed values were also used to evaluate model fit (unbiased models hav-ing a slope of one andR2values indicating goodness of fit). A slope parameter was considered to be statistically signifi-cant when the 95% credible interval (CI) did not include zero. Population level parameters were considered signifi-cantly different when their 95% CI did not overlap (or the 95% CI around their difference did not include zero).
Species’ adaptive patterns in height– diameter allometry variation
We tested whether variation in theapparameters was the
environments, using two different approaches. First, to assess the influence of neutral responses onapparameters
of allometry, we tested the influence of previously defined gene pools groups for each species onapparameters. Gene
pools are genetic groups of populations based on neutral molecular markers. Populations within the same genetic group is likely to share the same evolutionary history in terms of origin of the same glacial refuges and colonization routes. In P. sylvestris, P. pinaster and P. halepensis, gene pool groups were defined using molecular markers in Robledo-Arnuncio et al. (2005) and in Bucci et al. (2007).
In P. nigra, we lacked information based on molecular markers; hence, populations were grouped by subspecies. One-way ANOVA was used to detect the existence of associ-ation betweenapparameters and groups, and post hoc
com-parisons with a Tukey’s HSD test were employed. When homogeneity and normality assumptions were not reached, nonparametric Kruskal–Wallis test and post hoc compar-isons with a Nemenyi test, corrected for ties if necessary, were used. Second, to identify the influence of local environ-ments – namely climate and/or geographical position of populations’ site of origin–on tree allometry variation, we tested the existence of climatic or geographical clines due to local adaptations in phenotypic plasticity. More specifically, we computed Pearson’s correlation coefficients (q) between a
pparameters and climate and geographical characteristics
of the populations’ site of origin.
Results
Patterns of height–diameter allometry variation across and within species
The four final models produced unbiased estimates of
heightwith high R2 of observed vspredicted values (0.90 in P. sylvestris, 0.91 in P. nigra, 0.85 in P. pinaster, and 0.89 inP. halepensis).
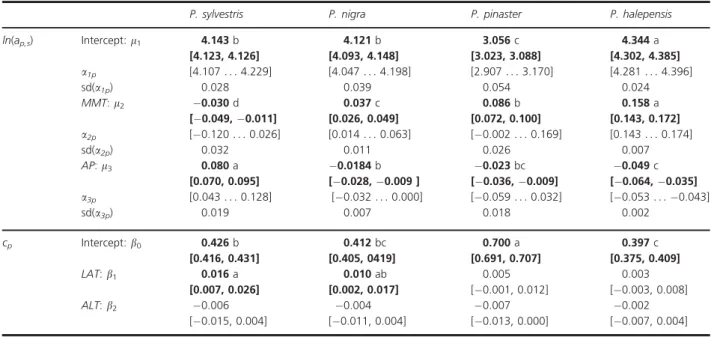
Pinus pinaster had the lowest intercept value, measured by the hyperparameterl1,and it did not overlap with the other three species.P. nigra andP. sylvestrishad interme-diate but overlapping values, while P. halepensis had the highest value and did not overlap with any of the other pine species (Table 1). The intraspecific genetic variabil-ity, the standard deviation of a1p, also varied among
spe-cies. P. pinaster displayed the greatest value, followed by
P. nigra, P. sylvestris, and P. halepensis (Table 1). This intraspecific genetic variability can also be visualized in Figure S2. Moreover, there was a statistical significant intraspecific genetic variation in a1p in all species,
marginal significant intraspecific genetic differences mea-sured by the number of significant pairwise comparisons within species relative to the total number: P. pinaster
was the species with the highest percentage of significant
differences (50.24%); followed by P. nigra (40.32%),
P. sylvestris(31.17%), andP. halepensis(17.21%).
Temperature (MMT) of the growing site influenced tree height allometry, being this hyperparameter,l2, statistically significant and positive in three of the four species, and signifi-cant but negative inP. sylvestris(Table 1). Moreover, we found evidence of intraspecific genetic differences in phenotypic plas-ticity to temperature (MMT) in three of the four species (ex-ceptP. halepensis).Accordingly, the four species showed some degree of intraspecific genetic variability, P. sylvestris having the greatest standard deviation, followed byP. pinaster,P. ni-gra,andP. halepensis. More specifically, the level of significant intraspecific genetic variation varied according to each species. Thus,P. sylvestrisdisplayed the greatest level of genetic differ-ences in plasticity in response to MMT (38.10%) among the populations tested, followed by the other two species:P. nigra
(9.88%) and P. pinaster (9.57%). This intraspecific genetic variability can also be visualized in Figure S3. All these results should be considered based on the total of populations tested.
Annual precipitation (AP) also influenced tree height allometry. Values for hyperparameterl3 were statistically significant and negative in three of the four species, but pos-itive in P. sylvestris. The estimated values for P. sylvestris
andP. halepensisdid not overlap, but the pairs composed byP. nigraandP. pinaster, andP. pinasterandP. halepensis
did (Table 1).Similarly, we found intraspecific genetic dif-ferences in phenotypic plasticity to rainfall (AP) in three of four species, the exception again beingP. halepensis. Fur-thermore, the four pine species presented some degree of intraspecific genetic variability.P. sylvestrisandP. pinaster
presented similar degrees, followed by P. nigra and
P. halepensis(Table 1). The level of significant intraspecific genetic variation was greatest inP. sylvestris(29.87%), fol-lowed by P. pinaster (3.60%) and P. nigra (2.77%). This intraspecific variability can also be visualized in Figure S4.
In three of the four species, the effects of AP on the tree height-diameter relationship and also the intraspecific genetic variability were smaller than those reported in response to MMT; specifically, betweenca.2 and 3.5-folds greater forP. ni-gra, P. halepensis,and P. pinaster – in an increasing order–.
Interestingly, the opposite effect was found inP. sylvestris–the effect of AP was ca. 2.5-folds greater than MMT.
Species’ adaptive patterns in height– diameter allometry variation
Overall, we found that tree height allometry variation was the result of adaptive responses to either local environments
–climate and geographical sites of origin–or to past historical events in the demography of species. First, we found a signif-icant geographical cline, that is, an association between the scaling exponent parameter (cp) and the latitude of origin for
not for the other two, more xeric, species (P. pinaster and
P. halepensis) (Table 1). Second, gene pool groups were sig-nificantly associated with a1p values just in P. pinaster and
P. nigra (P<0.001 and P<0.05, respectively), but not in the two others (Table 2).
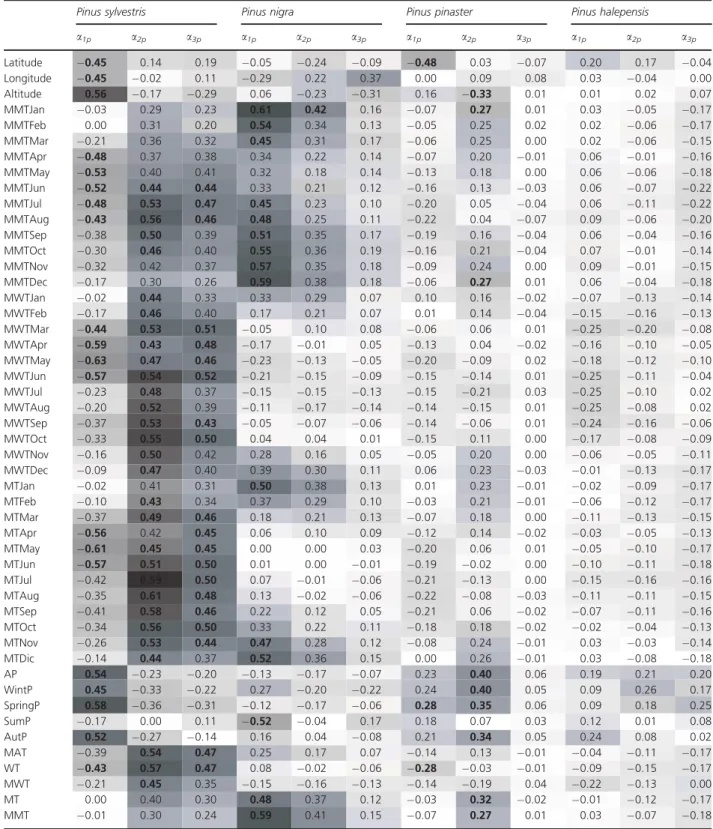
Third, we found chiefly greater association between the local environment and parametera1p compared toa2p and
a3p. Here the local environment is understood as the set of
variables that define the climate of the sites of origin of populations, through proper climate variables or based upon the geographical origin of them. Interestingly,
P. halepensis was the only species that lacked any type of relationship, suggesting the inexistence of climate adaptive responses in tree allometry variation. Specifically,a1pvalues
were significantly correlated (P<0.05) to different climatic variables of population’s site of origin (Table 3).P. sylvestris
with altitude (q =0.56) and annual precipitation
(q=0.54); P. nigra, in general, with minimum average monthly temperature (ranging fromq=0.45 to 0.60); and, weaker than the previous two,P. pinasterwith spring pre-cipitation (q= 0.28) and mean temperature of the warmest month (q=–0.28). Parameters a2p and a3p were
signifi-cantly correlated with climatic variables of populations’ sites of origin (P<0.05);P. sylvestris, P. nigra,and P. pinaster
displayed significant correlations between a2pand climate,
although the associations were weaker in the last species.
Finally, we only found significant and positive correlations betweena3pand related temperature variables inP. sylvestris
(Table 3).
Discussion
We addressed interpopulation tree height-diameter allometry variation across precipitation and temperature gradients of the four most planted pine species in Spain; that is, tree height-diameter allometry variation was accounted at two interconnected levels, species and population. Additionally, we found that local adaptation and past historical events of the species were associated
to interpopulation allometry variation, except for
P. halepensis, the most xeric species among the four. We employed a hierarchical approach to better under-stand the contributions of the species’ genetic variation, their demographic genetic background and their pheno-typic plasticity, in their responses to environmental variability.
Patterns of height–diameter allometry variation across and within species
This is the first time, to our knowledge, that the patterns of aboveground allometry across climatic gradients have Table 1. Parameter estimates from the selected best model. The table gathers information of two interconnected levels of hierarchy, species, and populations.
P. sylvestris P. nigra P. pinaster P. halepensis
ln(ap,s) Intercept:l1 4.143b [4.123, 4.126]
4.121b [4.093, 4.148]
3.056c [3.023, 3.088]
4.344a [4.302, 4.385] a1p [4.107. . .4.229] [4.047. . .4.198] [2.907. . .3.170] [4.281. . .4.396]
sd(a1p) 0.028 0.039 0.054 0.024
MMT:l2 0.030d
[0.049,0.011]
0.037c [0.026, 0.049]
0.086b [0.072, 0.100]
0.158a [0.143, 0.172] a2p [0.120. . .0.026] [0.014. . .0.063] [0.002. . .0.169] [0.143. . .0.174]
sd(a2p) 0.032 0.011 0.026 0.007
AP:l3 0.080a
[0.070, 0.095]
0.0184b [0.028,0.009 ]
0.023bc [0.036,0.009]
0.049c [0.064,0.035] a3p [0.043. . .0.128] [0.032. . .0.000] [0.059. . .0.032] [0.053. . .0.043]
sd(a3p) 0.019 0.007 0.018 0.002
cp Intercept:b0 0.426b
[0.416, 0.431]
0.412bc [0.405, 0419]
0.700a [0.691, 0.707]
0.397c [0.375, 0.409]
LAT:b1 0.016a
[0.007, 0.026]
0.010ab [0.002, 0.017]
0.005 [0.001, 0.012]
0.003 [0.003, 0.008]
ALT:b2 0.006
[0.015, 0.004]
0.004 [0.011, 0.004]
0.007 [0.013, 0.000]
0.002 [0.007, 0.004]
The parametersl*andb*make reference to the species, i.e., the species-level, anda*pto populations within species, i.e., population-level. The
overall species response, that is,l*andb*posterior mean estimates and 95% credible intervals in square brackets [, ] are given. The range of
parameter values among populations within species, that is, posterior mean estimates ofa*p, are shown in square brackets, the lowest value is
been described including intraspecific variation from a genetic perspective. The species-level parameters related to allometry (hyperparametersl* and b*, Fig. 2) did not overlap among species in most comparisons, reflecting the existence of evolutionary species-specific allocation strategies to cope with the current environment, although revealing an unclear association with their phylogeny, because P. nigra behaved more like P. halepensis and
P. pinasterthan likeP. sylvestris.
In general, P. sylvestrisshowed the opposite pattern in regard to aboveground allometry variation across precipi-tation and temperature gradients with respect to the other three species. Aboveground variation was also more responsive to changes in the minimum average tempera-ture of the coldest month, MMT, than to changes in annual precipitation, AP (excluding again P. sylvestris). This is contrary to expectation as Iberian forests are strongly constrained by water availability (G
omez-Aparicio et al. 2011; Ruiz-Benito et al. 2013). We hypoth-esize that mesic and xeric pine species could be more lim-ited by low temperatures than by water shortage, as they may have developed adaptive mechanisms to cope with drought stress, such as tight stomatal control, or specific wood anatomy traits such as thick cell walls, thick pit membrane, narrow lumens, or different root hydraulic resistance (Yastrebov 1996; Tyree and Zimmermann 2002; Garcıa Esteban et al. 2009; Zuccarini et al. 2015). Yet our data did not allow us to explore all potential interactions, for example, too cool-too wet; too warm-too wet that are likely to shape evolutionary responses in these species and populations.
Consistently with previous studies, in three of the four pine species, taller heights at a given size are found under
warmer conditions (Lines et al. 2012), except for
P. sylvestris. Warmer conditions during the cold season might allow a higher photosynthetic capacity, resulting in a higher rate of carbon assimilation (Way and Oren 2010), and hence taller heights. Yet P. sylvestris showed the opposite trend, suggesting a lack of responsiveness to warmer winters. A similar result was reported by Reich and Oleksyn (2008) in a regional study in Northern Eur-ope (latitude from 46° to 68° N). They observed that
P. sylvestris responses to climate differed between north-ern and southnorth-ern populations: while in southnorth-ern popula-tions height decreased as temperature increased, the opposite was observed in northern populations. It was suggested that, at least for this temperate-boreal species, warmer temperatures –at its warmer range–might rather enhance heat stress and heat-induced moisture stress than alleviate cold stress.
Tree height allometry variation across the precipitation gradient resulted species-specific and diverse. P. sylvestris
is expected to decrease its height at given size under drier conditions, a common pattern found in many parts of the world, for example, Mendez-Alonzo et al. (2008). This variation has often been attributed to the changing hydraulic structure of vessels in drought-prone areas. The opposite, however, was observed for P. halepensis. Periods of soil moisture saturation and flooding may act as stressors in arid-climate forests by reducing tree height (Rodrıguez-Gonzalez et al. 2010). Also higher pre-cipitation levels in some regions could imply poorer soil quality, because of increased runoff and nutrient leach-ing. However, as we do not have these measurements, we cannot confirm its potential influence. Intermediate patterns in tree allometry variation were shown for
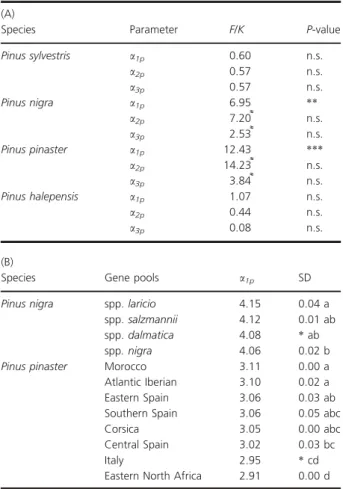
P. pinasterand P. nigra¸which displayed negligible varia-tion along the precipitavaria-tion gradient tested. Lines et al. (2012) found a clear pattern of allometric variation across species along the studied precipitation gradient, although not within species. That finding together with Table 2. (A) Summary of one-way ANOVAs to test gene pool effects
ona*p. When a nonparametric test was used, it is shown by the
sym-bol͌. (B) Post hoc comparisons among gene pools adjusted by Tukey’s HSD forPinus nigraandPinus pinaster. Different letters indicate dif-ferences among gene pools.
(A)
Species Parameter F/K P-value
Pinus sylvestris a1p 0.60 n.s.
a2p 0.57 n.s.
a3p 0.57 n.s.
Pinus nigra a1p 6.95 **
a2p 7.20͌ n.s.
a3p 2.53͌ n.s.
Pinus pinaster a1p 12.43 ***
a2p 14.23͌ n.s.
a3p 3.84͌ n.s.
Pinus halepensis a1p 1.07 n.s.
a2p 0.44 n.s.
a3p 0.08 n.s.
(B)
Species Gene pools a1p SD
Pinus nigra spp.laricio 4.15 0.04 a
spp.salzmannii 4.12 0.01 ab
spp.dalmatica 4.08 *ab
spp. nigra 4.06 0.02 b
Pinus pinaster Morocco 3.11 0.00 a
Atlantic Iberian 3.10 0.02 a
Eastern Spain 3.06 0.03 ab
Southern Spain 3.06 0.05 abc
Corsica 3.05 0.00 abc
Central Spain 3.02 0.03 bc
Italy 2.95 *cd
Eastern North Africa 2.91 0.00 d
Table 3. Heat map for Pearson’s correlation coefficients,q, betweena*pand climate variables from the populations’ sites of origin. Dark gray indicates high
positive correlation coefficients, light gray indicates high negative, and white color indicates low. Bold numbers mean significant correlations atP<0.05.
ours suggests that tree height allometry variation could have a very conservative performance across precipitation gradients. This latter would be in agreement with the results presented in Table 1. Here, the estimated credible intervals, CI, for the hyperparameters in P. pinaster and
P. nigra were very close to containing zero. This is somehow reflecting the almost lack of influence of pre-cipitation on tree height-diameter allometry variation.
Species’ adaptive patterns in height– diameter allometry variation
According to our findings, interpopulation tree height allometry variation was the result of local adaptation (Table 3). In addition, for Pinus nigra and P. pinaster, the demographic history of the species associated with distinct neutral gene pools was also important (as they reflect past events along the species’ history, such as genetic bottlenecks, founder effects, drift, etc.; Bucci et al. 2007; Soto et al. 2010; Jaramillo-Correa et al. 2015) (Table 2). Thus, in these two species, gene pool groups correlate with its allometry –its phenotype, and therefore, gene pool groups could be further used for the study of different evolutionary processes on pheno-type variation, although the delineated groups were appreciably different compared to those based on DNA data (Afzal-Rafii and Dodd 2007; Bucci et al. 2007)–. Absence of this signal in P. sylvestris could be partly explained by a greater influence from local environ-ments relative to species historical demographic back-ground, as it is reflected by significant correlations between a*p and local population of the species climate.
In contrast, P. pinaster and P. nigra presented weak sig-nals of adaptation to climate, specifically in plastic responses to temperature. Finally, P. halepensis repre-sented a different case; its null degree of genetic varia-tion, in any of the parameters of the model, agrees with the fact that the species’ European Western popu-lations of the species are genetically uniform (Soto et al. 2010), due to a relatively recent long-range
colo-nization from its ancestral range in the eastern
Mediterranean Basin (Grivet et al. 2009).
The clear latitudinal variation in the scaling exponent parameter inP. sylvestrisand P. nigra reveals a consistent regional correlation in tree allometry and photoperiod. Previous studies along latitudinal gradients have also found a genetic cline of adaptation (e.g., northern popu-lations set buds and hardened earlier, and presented lower growth rates than the southern ones; see Alberto et al. 2013 and references therein). In any case, the lack of lati-tudinal clines in P. halepensis and P. pinaster could be explained to either insufficient span in our data or to a real lack of latitudinal variability. Interestingly, this is the
first time that adaptive patterns have been shown for a composite trait such as tree height allometry. Our results confirm that this trait and its confined variation may be under natural selection control and consequentially play an important role in both the adaptation and acclimation potential of tree species to future conditions.
In conclusion, these four pine species are a heteroge-neous group with a recognized ability to adapt to extre-mely variable environments. Our findings support the eco-evolutionary knowledge we already have about them, but nonetheless reveal that tree height-diameter allometry variation patterns have developed under different natural selection pressures, despite the study species sharing a sizeable part of their distribution area in the studied region. This might have resulted in species, such as P. halepensis, where phenotypic plasticity is more important than genetic variation; while for others, for example, P. pinaster, genetic variation and local adaptation might be more relevant. Together, local environments –at the origin– and current growing conditions outline the likely possible outcomes of integrated phenotypes.
The full potential of forest resilience and resistance along new temperature and aridity gradients, that is, cli-mate change driven, would depend on local adaptation and levels of phenotypic plasticity of the populations. Our results point that considering both the species speci-fic and population ecological and historical background is a key for assessing likely population responses to environ-mental variation.
Acknowledgments
This work was supported by the Spanish Ministry of Science and Innovation through grants VULPINECLIM-CGL2013-44553-R, REMEDINAL3 (CAM,
S2013/MAE-2719, 2014–2018) and ADAPCON
(CGL2011-30182-C02-01). N.V.P. was supported by fellowship FPI-MCI (BES-2009-025151). Thanks to the GENFORED team for their help with the data used in this research. The text has been revised by a professional scientific editor, P.C. Grant.
Data Accessibility
All the data used are available in the Database on Genetic trials GENFORED (www.genfored.es) upon request, and also, it is in process of submitting into the CitaREA repository (http://citarea.cita-aragon.es/citarea/?locale=en). Identificators for the data will be available before publica-tion.
Conflict of Interest
References
Afzal-Rafii, Z., and R. S. Dodd. 2007. Chloroplast DNA supports a hypothesis of glacial refugia over postglacial recolonization in disjunct populations of black pine (Pinus nigra) in western Europe. Mol. Ecol. 16:723–736.
Aiba, S. I., and T. Kohyama. 1996. Tree species stratification in relation to allometry and demography in a warm-temperate rain forest. J. Ecol. 84:207–218.
Alberto, F. J., S. N. Aitken, R. Alıa, S. C. Gonzalez-Martınez, H. Hanninen, A. Kremer, et al. 2013. Potential for evolutionary responses to climate change–evidence from tree populations. Glob. Change Biol. 19:1645–1661. Alıa, R., J. Moro, and J. B. Denis. 2001. Ensayos de
procedencias dePinus pinasterAit. en el centro de Espa~na: resultados a la edad de 32 anos. Investigaci~ on Agraria. Sistemas y Recursos Forestales 10:333–354.
Banin, L., T. R. Feldpausch, O. L. Phillips, T. R. Baker, J. Lloyd, K. Affum-Baffoe, et al. 2012. What controls tropical forest architecture? Testing environmental, structural and floristic drivers. Glob. Ecol. Biogeogr. 21:1179–1190.
Benito-Garzon, M., R. Alıa, T. M. Robson, and M. A. Zavala. 2011. Intra-specific variability and plasticity influence potential tree species distributions under climate change. Glob. Ecol. Biogeogr. 20:766–778.
Bucci, G., S. C. Gonzalez-Martınez, G. Le Provost, C. Plomion, M. M. Ribeiro, F. Sebastiani, et al. 2007. Range-wide phylogeography and gene zones inPinus pinasterAit. revealed by chloroplast microsatellite markers. Mol. Ecol. 16:2137–2153.
Bullock, S. H. 2000. Developmental patterns of tree dimensions in a neotropical deciduous forest. Biotropica 32:42–52. Chave, J., C. Andalo, S. Brown, M. A. Cairns, J. Q. Chambers,
D. Eamus, et al. 2005. Tree allometry and improved estimation of carbon stocks and balance in tropical forests. Oecologia 145:87–99.
Clark, J. S. 2005. Why environmental scientists are becoming Bayesians. Ecol. Lett. 8:2–14.
Clark, J. 2007. Models for Ecological data. Princeton University Press, Princeton, NJ.
Dietze, M. C., M. S. Wolosin, and J. S. Clark. 2008. Capturing diversity and interspecific variability in allometries: a hierarchical approach. For. Ecol. Manage. 256:1939–1948. Garcıa Esteban, L., J. A. Martın, P. Palacios, F. Garcıa
Fernandez, and R. Lopez. 2009. Adaptive anatomy ofPinus halepensistrees from different Mediterranean environments in Spain. Trees 24:19–30.
Gelman, A., and J. Hill. 2007. Data analysis using regression and multilevel/hierarchical models. Cambridge University Press, Cambridge, UK.
Gomez-Aparicio, L., R. Garc ıa-Valdes, P. Ruiz-Benito, and M. A. Zavala. 2011. Disentangling the relative importance of climate, size and competition on tree growth in Iberian
forests: implications for forest management under global change. Glob. Change Biol. 17:2400–2414.
Gonzalo-Jimenez, J. 2010. Diagnosis Fitoclimatica de La Espa~na Peninsular Hacia Un Modelo de Clasificacion Funcional de La Vegetacion Y de Los Ecosistemas Peninsulares Espanoles. Organismo Aut~ onomo Parques Nacionales, Ministerio de Medio Ambiente y Medio Rural y Marino. Madrid, Espa~na.
Grivet, D., F. Sebastiani, S. C. Gonzalez-Martınez, and G. G. Vendramin. 2009. Patterns of polymorphism resulting from long-range colonization in the Mediterranean conifer Aleppo pine. New Phytol. 184:1016–1028.
Halle, F., R. A. A. Oldeman, and P. B. Tomlinson. 1978. Tropical trees and forests: an architectural analysis. Springer-Verlag, Berlin, Heidelberg.
Jaramillo-Correa, J. P., I. Rodrıguez-Quilon, D. Grivet, C. Lepoittevin, F. Sebastiani, M. Heuertz, et al. 2015. Molecular proxies for climate maladaptation in a long-lived tree (Pinus pinasterAiton, Pinaceae). Genetics 199:793–807.
King, D. A. 1996. Allometry and life history of tropical trees. J. Trop. Ecol. 12:25.
King, D. A., S. J. Davies, S. Tan, and N. S. M. Noor. 2006. The role of wood density and stem support costs in the growth and mortality of tropical trees. J. Ecol. 94:670– 680.
Leites, L. P., A. P. Robinson, G. E. Rehfeldt, J. D. Marshall, and N. L. Crookston. 2012. Height-growth response to climatic changes differs among populations of Douglas-fir: a novel analysis of historic data. Ecol. Appl. 22:154–165. Lines, E. R., M. A. Zavala, D. W. Purves, and D. A. Coomes.
2012. Predictable changes in aboveground allometry of trees along gradients of temperature, aridity and competition. Glob. Ecol. Biogeogr. 21:1017–1028.
Lopez-Serrano, F., A. Garc ıa-Morote, M. Andres-Abellan, A. Tendero, and A. Delcerro. 2005. Site and weather effects in allometries: a simple approach to climate change effect on pines. For. Ecol. Manage. 215:251–270.
M€akel€a, A., and H. T. Valentine. 2006. Crown ratio influences allometric scaling in trees. Ecology 87:2967–2972.
Matyas, C. 1996. Climatic adaptation of trees: rediscovering provenance tests. Euphytica 92:45–54.
McMahon, T. 1973. Size and shape in biology. Science 179:1201–1204.
Mendez-Alonzo, R., J. Lopez-Portillo, and V. H. Rivera-Monroy. 2008. Latitudinal variation in leaf and tree traits of the mangroveAvicennia germinans(Avicenniaceae) in the Central Region of the Gulf of Mexico. Biotropica 40:449– 456.
Moles, A. T., D. I. Warton, L. Warman, N. G. Swenson, S. W. Laffan, A. E. Zanne, et al. 2009. Global patterns in plant height. J. Ecol. 97:923–932.
O’Neill, G. A., and G. Nigh. 2011. Linking population genetics and tree height growth models to predict impacts of climate change on forest production. Glob. Change Biol. 17:3208– 3217.
Poorter, L., E. Lianes, M. Moreno-de las Heras, and M. A. Zavala. 2012. Architecture of Iberian canopy tree species in relation to wood density, shade tolerance and climate. Plant Ecol., 213:707–722.
Pretzsch, H., and J. Dieler. 2012. Evidence of variant intra-and interspecific scaling of tree crown structure intra-and relevance for allometric theory. Oecologia 169:637–649. Reich, P. B., and J. Oleksyn. 2008. Climate warming will
reduce growth and survival of Scots pine except in the far north. Ecol. Lett. 11:588–597.
Richardson, D. M. 1998. Ecology and biogeography of pinus. Cambridge University Press, Cambridge, UK.
Robledo-Arnuncio, J. J., C. Collada, R. Alıa, and L. Gil. 2005. Genetic structure of montane isolates of Pinus sylvestris L. in a Mediterranean refugial area. J. Biogeogr. 32:595–605.
Rodrıguez-Gonzalez, P. M., J. C. Stella, F. Campelo, M. T. Ferreira, and A. Albuquerque. 2010. Subsidy or stress? and Tree structure and growth in wetland forests along a hydrological gradient in Southern Europe. For. Ecol. Manage. 259:2015–2025.
Ruiz-Benito, P., E. R. Lines, L. Gomez-Aparicio, M. A. Zavala, and D. A. Coomes. 2013. Patterns and drivers of tree mortality in Iberian forests: climatic effects are modified by competition. PLoS ONE 8:e56843.
Ryan, M. G., and B. J. Yoder. 1997. Hydraulic limits to tree height and tree growth. Bioscience 47:235–242.
Soto, A., J. J. Robledo-Arnuncio, S. C. Gonzalez-Martınez, P. E. Smouse, and R. Alıa. 2010. Climatic niche and neutral genetic diversity of the six Iberian pine species: a retrospective and prospective view. Mol. Ecol. 19:1396– 1409.
Spiegelhalter, D. J., N. G. Best, B. P. Carlin, and A. van der Linde. 2002. Bayesian measures of model complexity and fit. J. R. Stat. Soc. Series B 64:583–640.
Tapias, R., J. A. Pardos, L. Gil, and J. Climent. 2004. Life histories of Mediterranean pines. Plant Ecol. 171:53–68. Thomas, A., R. O’Hara, U. Ligges, and S. Sturts. 2006. Making
BUGS Open. R. News 6:12–17.
Thompson, J. 2005. Plant Evolution in the Mediterranean. Oxford University Press, Oxford, UK.
Tilman, D. 1988. Plant strategies and the dynamics and structure of plant communities. Princeton University Press, Princeton, New Jersey.
Tyree, M., and M. Zimmermann. 2002. Xylem structure and the ascent of sap. Springer-Verlag, Berlin.
Valladares, F., S. Matesanz, F. Guilhaumon, M. B. Araujo, L. Balaguer, M. Benito-Garzon, et al. 2014. The effects of
phenotypic plasticity and local adaptation on forecasts of species range shifts under climate change. Ecol. Lett. 17:1351–1364.
Vieilledent, G., B. Courbaud, G. Kunstler, J.-F. Dh^ote, and J. S. Clark. 2010. Individual variability in tree allometry determines light resource allocation in forest ecosystems: a hierarchical Bayesian approach. Oecologia 163:759–773. Wang, X., J. Fang, Z. Tang, and B. Zhu. 2006. Climatic
control of primary forest structure and DBH–height allometry in Northeast China. For. Ecol. Manage. 234:264– 274.
Way, D. A., and R. Oren. 2010. Differential responses to changes in growth temperature between trees from different functional groups and biomes: a review and synthesis of data. Tree Physiol. 30:669–688.
Wright, S. D., and K. D. M. Mcconnaughay. 2002. Interpreting phenotypic plasticity: the importance of ontogeny. Plant Spec. Biol. 17:119–131.
Yastrebov, B. 1996. Different types of heterogeneity and plant competition in monospecific stands. Oikos 75:89–97. Zuccarini, P., E. Farieri, R. Vasquez, B. Grau, and R. S.
Monserrat. 2015. Effects of soil water temperature on root hydraulic resistance of six species of Iberian pines. Plant Biosyst. 149:1–8.
Supporting Information
Additional Supporting Information may be found online in the supporting information tab for this article:
Appendix S1.Appropriateness of the use of estimated cli-mate data instead of long-term average data originated in weather stations.
Table S1. Characteristics of the common garden experi-ments, i.e., growing sites.
Table S2.Summary of the different allometric and linking functions tested for each species.
Table S3.Heat map for Pearson’s correlation coefficients, q, betweenheightanddbh, together with the climatic and geographic variables from the common garden sites for the four species.
Figure S1. Principal Component Analysis (PCA) of pine populations (P) and growing sites (S).
Figure S2.The figure shows a1p values for the four pine
species studied, and their 95% credible intervals.
Figure S3.The figure shows a2p values for the four pine
species studied, and their 95% credible intervals.
Figure S4.The figure shows a3p values for the four pine