Tracing MPI binaries for knowledge discovery
Eduardo Grosclaude, Claudio Zanellato, Rafael Zurita, Rodolfo del Castillo
Facultad de Informática, Universidad Nacional del Comahue {oso,czanella,rzurita,rolo}@uncoma.edu.ar
Abstract Our research project intends to build knowledge about HPC problems to be able to help local researchers. In the general case, researchers who consult us do not own the sources to the parallel programs they run. In order to advise users in choosing parallel machines to run their applications, we are developing a simple methodology to extract knowledge related to performance and scalability, from runs of pure MPI applications on multicore clusters. For the applications under study, our methodology allows us to obtain a reduced description of the program which gives an idea of the original source code.
1
Introduction
Our research group at Universidad Nacional del Comahue aims to build knowledge about HPC resources, and help local researchers from other scientific and engineering fields to better understand them and use them. Users are typically running third-party, pure MPI applications; only very rarely they develop their own applications. Most often, then, source code is unavailable. Users ask how these applications will perform on other, prospective hardware.
Performance and scalability analysis is best accomplished by developers by study-ing the source code. When the source code is not known, the analyst falls back to pur-suing black-box, analytical models of behaviour built up from execution data. While the pure black-box approach does indeed yield useful information, we were intrigued whether some further knowledge about how an application has been built, could be obtained just from binary-only programs.
The question was raised of how to characterize an opaque application in order to propose an adequate platform. As our main work hypothesis is that the algorithm is unknown or the source code is unaccesible, we investigated how to analyze an appli-cation’s behaviour by instrumenting the application at run time. This had to be done without the need for recompiling the application. In a later work [8] we showed a sim-ple run-time instrumentation methodology for pure MPI programs with low impact on execution time, allowing to collect useful observations in absence of source code, with-out recompiling and with minimal disruption to the user’s environment.
In our present work, we intend to build upon our instrumentation methodology to discover as much as possible about the algorithmical nature of the application and its influence on performance. We want to configure a simple methodology to automatically obtain a high-level, descriptive model, which lends itself to interpretation, allowing to reason and learn about the causes of performance, or lack thereof.
In summary, our goals are to automatically obtain a model of the task executed by the application,
– Without any source code or prior knowledge about the application;
– Offering enough information about the application behaviour to predict perfor-mance in other setups;
– As cheaply as possible, i.e. in as few runs as possible and without interfering the user’s work;
– Universally enough to be useful, i.e. applicable to a broad class of programs, com-pilers, middleware or operating systems.
With these models, we expect to be able to:
– Identify communication patterns. Shed light upon the particular approach to ’parti-tion’ and ’communica’parti-tion’ design phases of a program.
– Draw classes of equivalence among sets of programs. For instance, it is conceivable that many programs built on some given theory for a domain will be implementing some variation of the same algorithm. If a methodology can identify similar patterns among the programs, the question about the best platform for an application may be answered for the whole class of programs.
– Identify load balance problems and suggest efficient process placement across tar-get processors. Study symmetry in application components. Extreme asymmetry can be a source of load unbalance. The stream of communication events can reveal either pure SPMD structure or asymmetric roles in programs which can be used to induce placement hints.
– Finally, select appropriate hardware for running users’ applications. Help tailor in-vestments according to expected gains in speedup.
2
Previous work
Modeling for performance prediction is a complex subject which has received much at-tention from researchers. Techniques for performance modeling and prediction exhibit difficult tradeoffs. Some issues are cost-effectiveness of modeling (low-cost analyti-cal modeling vs. high-overhead empirianalyti-cal modeling), speed of execution, measurement techniques involved, and above all, prediction accuracy and robustness.
A very mature tool for performance analysis is DIMEMAS[13], a run-time instru-mentation and simulation environment for application performance analysis and tuning. DIMEMASholds the notion of an abstract machine architecture and abstract network. In DIMEMAS, a database of machine models and networks models specializing this abstract architectures is maintained. DIMEMASis able to simulate execution of a mes-sage passing application on a network of SMPs with those defined features. Collective MPI primitives in DIMEMASare modeled using the basic communication model and a model factor (null, constant, linear or logarithmic) to reflect different implementations or choices for what-if analysis. The idea of replaying traces by simulation under some communication model has been fruitful for many researchers. Other papers like [5] have been very inspirational for our work. However, DIMEMASis a simulation-oriented en-vironment, while our approach is driven by the desire to obtain symbolic, high-level models. A complete survey on performance modeling techniques is found in [9], which is a byproduct of Ph.D. research by D. Grove, along with PEVPM, a comprehensive framework with symbolic model capability, resting over MPIBench, a benchmarking tool also by Grove.
The idea of compactly representing parallel traces of execution has been followed by several researchers like Göel [6]. Post-mortem execution analysis has been done to find structure in traces as in Knüpfer [10] and Preissl [12]. The interesting idea of con-necting traces from several related processes into discernible communication patterns is a future case in point for our methodology. The ability to detect callsites in executing programs has been utilised by developers of mpiP tools [3].
3
An instrumentation framework
Message-passing middleware is normally implemented as shared object, dynamic link-ing libraries. Modern operatlink-ing systems provide a mechanism to define the order in which dynamic libraries are scanned during the linking process. As pending calls in the program binaries are resolved at first match, this order determines which shared object will provide an implementation for a given call.
Using the framework The shim’s wrapper functions call other, user defined, callback functions before and after delegating to the library MPI function proper. The names of these callback functions include PRE and POS prefixes to signal their situation relative to the actual MPI call. The interface to the callback functions is well de-fined, and the instrumentation, wrapping and linking issues are separated and con-fined to the shim. The user is only responsible to write the callback functions and emitting traces or profiles as desired. By writing her own callback functions, the framework user can select what data will be collected in the trace.
[image:5.595.211.406.378.483.2]Tracing data The information accessible for tracing purposes includes data related to MPI communications activity, plus any sort of data or statistics obtainable by a program. Data points emitted by user functions may carry not only MPI event at-tributes, but also any interesting information computable from system functions, such as a timestamp, the amount of resources (such as free memory), etc. The user can do whatever work is desired while into these callback functions; although, log-ically, this work should be kept to a minimum in the interest of performance and clean data collecting. Other interesting data for performance investigation are the number of MPI data elements sent in an operation, and the size of each data ele-ment, as they can be related to latency and bandwidth of a link under a communi-cations model. Data elements typically available for a trace event are described in Table 1.
Name Value
id Sequence number of event in the trace call MPI primitive name
cs Callsite number
key PRE or POS
dest Destination for point-to-point primitives count Number of MPI data elements transferred
size Size in bytes of each data element transferred time Elapsed time since last event
Table 1.Data elements typically present in a trace event
PRE and POS callbacks PRE callback functions are called before entry to the actual MPI functions; they are the place to collect CPU or other statistics about the just-finished CPU burst. POS callback functions are called after exit from the actual MPI functions and will be used to capture behaviour exhibited during an MPI library function call.
data) the duration of MPI communication operations. A PRE function can tell the duration of a CPU burst (as any other relevant data).
Callsites To discover structure, such as a repetitive sequence of events in an application trace, and identify it as a program loop, the framework depends on special data. The shared object program can locate the point in the application (orcallsite) it is being called from, by inspection of the process stack. This is achieved by means of an auxiliary library [1] which provides a view of the live application stack along with a mechanism to travel "in time" over it, retrieving deeper stack frames backwards in the execution timeline. Thus, the shim can determine at run time the MPI call return address present on the stack and let it be known to the callback functions. The callsite address is later hashed to be kept in the trace database.
Analysis At post-mortem, traces are stored into a database and later exploited to build a compressed view of the sequence of CPU bursts and communication events. This compressed view will resemble as much as possible the source code structures in the program; for instance, loops in the original source code are easily identified by iteration coefficients. The compression performed over a trace can be thought of as recognizing a regular expression that describes a string from a language, while the traces can be viewed as strings, or sequences of symbols. Each language symbol is constructed as an affix or representation of a communication event, where some attributes of only local significance (e.g., the time for completion of each event) are abstracted.
Algorithm The compression algorithm operates in two editing phases. The first one performs a search of runs (two or more adjacent, identical symbols) and replaces every search hitA, foundnadjacent times, by a new symbolA[n]. The second phase finds the maximally occurring digram (the most frequent pair of adjacent symbols) and then replaces every hit digram(A,B)in the trace by a new, artificial symbol labeledA+B. These two phases are iterated until no possible editions are left. Our approach is inspired in existing formal approaches, implying automata or grammar inference, such as the SEQUITURalgorithm [11,14].
Output Although the complete information contents of the trace are preserved with-out loss in the final compressed representation, it can be visualized in a number of ways with varying detail. For a certain text view implemented by us, the attributes abstracted for an observed CPU burst or communication event are either preserved or summarized. This depends on a callsite being repeatedly or singly visited during the execution. For typical usage, execution time for a CPU burst or a communica-tion primitive, during an iteracommunica-tion of a loop, is shown as an average over the number of iterations. Total time for the loop is summarized as well.
4
Examples
We will comment on the output in Figure 2 to explain the format used. The line numbers at the left are there just to guide the explanation.
1.CPU0: 720 2.Bcast0: 487 3.CPU1: 900 4.Barrier1: 864
5.(CPU2: 1308792.75+Allreduce2: 128.75)[4]: 5235686
Figure 2.Compressed output for EP program, detailed.
1.CPU0: 358 2.Bcast0: 429
3.((((CPU1: 41631.00+Allreduce1: 52763.54) +CPU2: 10.63) + (Alltoall2: 266.09+CPU3: 5.54)) +Alltoallv3: 156060.63)[11]: 2758112
4.CPU4: 4173 5.Reduce4: 37 6.CPU5: 15793 7.Send5: 37 8.CPU6: 2160 9.Reduce6: 162
Figure 3.Compressed output for IS program, detailed.
– The notation used takes subscripts to indicate the callsite. For instance, in Figure 2, the first two lines are attached to callsite 0, lines 3 and 4 to callsite 1, and line 5 to callsite 2. There are no other callsites exercised in this run.
– Numbers appended after semicolons mean elapsed time inμs.
– The output in Figure 2 at line 1 comes from a PRE callback for the first MPI event in the trace, hence it is signaled with a ’CPU’ label. This line means that 720μs have elapsed since the exit from MPI_Init call (the very first MPI event in the process) until the event in callsite 0. There is no other information about the CPU burst.
– At the same callsite a broadcast (MPI_Bcast) operation has been called. The line 2 shows the time elapsed, 487μs, for completion of the call.
– Lines 3 and 4 have a similar interpretation. Line 3 shows that the time elapsed since return from broadcast in callsite 0 was 900 microseconds. The barrier synchroniza-tion had a cost of 864μs.
– Line 5 is interpreted as follows. The trace analysis program found that two coupled events (a CPU burst plus an MPI_Allreduce operation) were repeated a number of times. This probably indicates a loop, with four iterations, around callsite 2.
1.(CPU0+Bcast0)[10]: 10055
2.((CPU1+Send1) + ((CPU2+ (Irecv2+CPU3)) +Wait3))[4]: 83343 3.(((CPU4+Allreduce4) +CPU5) +Barrier5): 11556
4.(((CPU1+Send1)[124] + (CPU6+Recv6)[124]) + ((CPU1+Send1) + ((CPU2+ (Irecv2+ CPU3)) +Wait3))[2]): 63727
5.((CPU4+Allreduce4) + ((CPU1+Send1) + ((CPU2+ (Irecv2+CPU3)) +Wait3))[2]): 51968 6.(((CPU4+Allreduce4) +CPU5) +Barrier5): 11270
7.(((CPU1+Send1)[124] + (CPU6+Recv6)[124]) + ((CPU1+Send1) + ((CPU2+ (Irecv2+ CPU3)) +Wait3))[2])[249]: 18062611
8.((CPU1+Send1)[124] + (CPU6+Recv6)[124]): 58126
9.((CPU4+Allreduce4) + ((CPU1+Send1) + ((CPU2+ (Irecv2+CPU3)) +Wait3))[2]): 15032 10.(CPU4+Allreduce4)[3]: 15793
11.((CPU2+ (Irecv2+CPU3)) +Wait3)[2]: 272 12.(CPU4+Allreduce4): 21
13.(((CPU2+ (Irecv2+CPU3)) +Wait3) + (CPU4+Allreduce4))[2]: 535
Figure 4.Compressed output for LU program, low detail.
– Several data present in the trace are not used or not shown for clarity, e.g. destina-tion processes or data sizes are pruned from the data exposed to the compression algorithm and from the output as well.
As can be seen, the output format roughly reflects the program structure, well enough to give at a glance an algorithmic idea of the sequence of computation bursts and com-munication events for a typical input.
Interpreting results
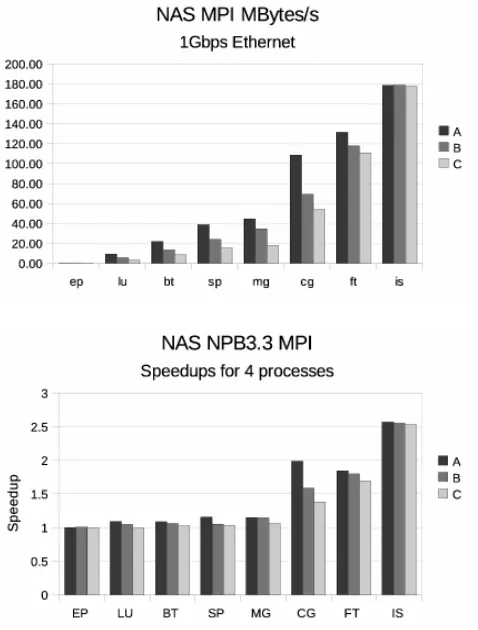
EP, an embarrassingly-parallel program, is the simplest in the suite. Its only loop is probably in the order ofP, the number of processes. Granularity, or ratio from compu-tation to communications time, is high. On the other end of the suite lies IS, an integer sort program. Most of IS execution time is spent iterating 11 times over a complex loop line consisting of three MPI calls (at callsites 1, 2 and 3). IS is a notoriously higher consumer of network bandwidth, and its granularity is much lower than EP’s, i.e. com-munication times are much higher when related to CPU bursts. This helps explain our Figure 1 where EP and IS appear at opposite ends of the speedup spectrum for higher core density. Because of granularity, EP will not profit from faster links; however, faster CPUs will possibly help. The situation is the opposite with IS. With this tool, we are closer to extracting this kind of knowledge for arbitrary applications.
Several other pieces of knowledge can be extracted from these high level descrip-tions, possibly provoking further exploratory questions:
– Reasoning on output from different workloads can show scalability trends.
– Loop bounds in programs are frequently related to the dimension of input or of number or processes. Can we identify such a case?
– How do transfer sizes vary for different number of processors? Does the program apply some adaptive data partitioning strategy?
5
Future work
Although some of the original plan for the parallel application can be known from the stream of communication events, there is an obvious lack of information about com-putation in the trace. We plan to further develop our analysis of message-passing ap-plications behaviour by looking for detail in CPU bursts. As of now, the only attribute observed in the framework for CPU bursts is execution time. This allows for compar-ing CPU time to communications time in execution phases and so to make inferences about granularity or scalability. However, several event counters and other measure-ment devices are built into modern processors, and they can be exploited by adequately querying them at the end of a CPU burst. This can be done from inside the correspond-ing PRE callback function, at the entry of a communication event, and would add detail to the execution model. Having detail about how data is used by the program may give insight as to whether the program is, for instance, compute-bound or memory-bound, and this knowledge may assist in selecting target hardware or process placement.
Another research task ahead is communications modeling. We plan to continue evolving this simple framework in order to investigate its capacity for automated per-formance prediction in other scenarios. The simple parallel machine model we consider is an abstract model of processors related by communication links. Building a cluster of multicore machines with a certain (possibly heterogeneous) number of cores per ma-chine determines a tree where links are communication links and nodes are processors. Ideally, modeling these links would allow for simple value replacement in the code profiles obtained. However, much work is still to be done, as we need detailed models for all MPI primitives, taking into account the impact from asynchronous operations (where computation and communications overlap), different implementation of collec-tive operations (e.g. iteracollec-tive or scalable broadcast), etc.
6
Conclusions
References
1. The libunwind project. http://www.nongnu.org/libunwind/. 2. MPI documents. http://www.mpi-forum.org/docs/docs.html.
3. mpiP: lightweight, scalable MPI profiling. http://mpip.sourceforge.net/.
4. NASA advanced supercomputing (NAS) division home page. http://www.nas.nasa.gov/. 5. Rosa M. Badia, Germán Rodríguez, and Jesús Labarta. Deriving analytical models from a
limited number of runs. InPARCO, pages 769–776, 2003.
6. A. Goel, A. Roychoudhury, and T. Mitra. Compactly representing parallel program execu-tions.ACM SIGPLAN Notices, 38(10):202, 2003.
7. E. Grosclaude, C. Zanellato, J. Balladini, R. del Castillo, and S. Castro. Considering core density in hybrid clusters. 2010.
8. E. Grosclaude, C. Zanellato, J. Balladini, R. del Castillo, and S. Castro. Profiling MPI appli-cations with mixed instrumentation. 2010.
9. D Grove.Performance modelling techniques for parallel supercomputing applications. Nova Science Publishers, New York, 2010.
10. A. Knuepfer, D. Kranzlmueller, and W. E Nagel. Detection of collective MPI operation patterns.Recent Advances in Parallel Virtual Machine and Message Passing Interface, pages 259–267, 2004.
11. C. G Nevill-Manning and I. H Witten. Identifying hierarchical structure in sequences: A linear-time algorithm.Arxiv preprint cs/9709102, 1997.
12. R. Preissl, T. Kockerbauer, M. Schulz, D. Kranzlmuller, B. Supinski, and D. J Quinlan. De-tecting patterns in MPI communication traces. In37th International Conference on Parallel Processing, 2008. ICPP08, pages 230–237, 2008.