Int. J. Environ. Res. Public Health 2020, 17, 218; doi:10.3390/ijerph17010218 www.mdpi.com/journal/ijerph Article
A
Software
for
Calculating
the
Economic
Aspects
of
Floating
Offshore
Renewable
Energies
Laura Castro‐Santos 1,* and Almudena Filgueira‐Vizoso 2
1 Departamento de Enxeñaría Naval e Industrial, Escola Politécnica Superior, Universidade da Coruña,
Esteiro, 15471 Ferrol, Spain
2 Departamento de Química, Escola Politécnica Superior, Universidade da Coruña, Esteiro,
15471 Ferrol, Spain; [email protected]
* Correspondence: [email protected]
Received: 25 November 2019; Accepted: 24 December 2019; Published: 27 December 2019
Abstract: The aim of this work is to develop a software to calculate the economic parameters so as
to determine the feasibility of a floating offshore renewable farm in a selected location. The software
can calculate the economic parameters of several types of offshore renewable energies, as follows:
one renewable energy (floating offshore wind—WindFloat, tension leg platform (TLP), and spar;
floating wave energy—Pelamis and AquaBuoy), hybrid offshore wind and wave systems (Wave
Dragon and W2Power), and combined offshore wind and waves with different systems
(independent arrays, peripherally distributed arrays, uniformly distributed arrays, and non‐
uniformly distributed arrays). The user can select several inputs, such as the location, configuration
of the farm, type of floating offshore platform, type of power of the farm, life‐cycle of the farm,
electric tariff, capital cost, corporate tax, steel cost, percentage of financing, or interest and capacity
of the shipyard. The case study is focused on the Galicia region (NW of Spain). The results indicate
the economic feasibility of a farm of floating offshore renewable energy in a particular location in
terms of its costs, levelized cost of energy (LCOE), internal rate of return (IRR), net present value
(NPV), and discounted pay‐back period. The tool allows for establishing conclusions about the
dependence of the offshore wind resource parameters, the main distances (farm–shore, farm–
shipyard, and farm–port), the parameters of the waves, and the bathymetry of the area selected.
Keywords: feasibility study; offshore wind; levelized cost of energy (LCOE); wave energy; software
1. Introduction
Floating offshore renewable energies are those that are installed in deep waters (more than 50
m). They are composed by several main components, namely: energy generators, floating offshore
platforms, mooring, anchoring, and electric systems. The main difference between these floating
platforms and the fixed platforms (up to 50 m of depth; monopiles [1], tripiles, jackets [2], etc.) [3] is
that these last ones have platforms fixed to the seabed using several devices; therefore, they do not
have mooring and anchoring systems.
In this context, the most developed technology is offshore wind systems, although wave energy
will have great development in the future too. Floating offshore wind energy has been developed
over the last years, mainly in Europe and Japan [4,5]. Hywind Scotland was the first commercial
floating offshore wind farm installed in the world. It was installed in 2017 in Scottish waters [6] by
Statoil. It is based on a spar floating platform called Hywind, which was previously probed in
Norway in 2009 [7]. It has five spar platforms that were built in the Navantia‐Fene shipyard in Fene
(A Coruña, Spain). This shipyard is the leader in floating offshore wind building—it built one
wind farm in the Iberia Peninsula [8]), and it is starting to build five platforms for the Kinkardine
project (Aberdeen, U.K.), consisting of 9.5 MW platforms [9].
Floating offshore renewable energies will have a great future. However, nowadays, they are still
in development, mainly wave energy systems and hybrid technology, and need to increase their
unitary power in order to be more competitive with conventional offshore wind. Therefore, it is
important to determine the best areas where a floating offshore renewable energy farm can be
installed, and calculate their economic feasibility in order to make decisions about the final
installation of these technologies. There are some studies about the types of restrictions of the areas
where offshore wind energy is installed [10], restrictions for wave energy [11], mapping the electric
system of offshore ports [12], and a comparison between onshore and offshore wind [7].
There is a lot of information about offshore platforms, namely: semisubmersible [13–15],
tensioned leg platform (TLP) [16,17], and spar [18]. Arapogianni [19] analysed the main floating
systems and differences between the grid connected systems (Hywind of Statoil and WindFloat of
Principle Power) and the concepts under development (Advanced Floating Turbine of Nautica
WindPower; Aero‐generator X of Wind Power Ltd. Arup, Azimut of Consortium of Spanish Wind
Energy Industry lead by Gamesa; Blue H TLP of Blue H; DeepCWind floating wind of the consortium
of the University of Maine, AEWC, Seawall, Maine Maritime Academy, Technip, NREL and MARIN;
Deepwind, which is an EU project; DIWET Semisub of Pole Mer; EOLIA of Acciona Energy; IDEOL
of IDEOL; GICON TLP of GICON; Hexicon platform of Hexicon; HiPRwind, an EU project; Karmoy
of Sway; Ocean Breeze of Xanthus Energy; W2Power of Pelagic Power; Pelastar of Glosten Associates;
Poseidon Floating Power of the Floating Power; Sea Twirl of Sea Twirl; Trifloater Semisub of Gusto;
Vertiwind of Technip and Nenuphar; WindSea Floater of Force technology NLI; Winflo of Nass and
Wind and DCNS; ZEFIR Test Station of Catalonia Institute for Energy Research; and Haliade of
Alstom). Perhaps the most representative is the research developed by Jonkman and Matha [19,20],
where a spar, a semisubmersible, and a TLP (tensioned leg platform) were calculated, because it
compares the three main types of floating offshore wind platforms. In this context, Sclavounos et al.
[21,22] also considered the taught leg buoy concept. Collu et al. compared fixed and floating
structures for a 5‐MW wind turbine [23].
However, all of these studies did not take into account the economic aspects of such
technologies, although Wind Europe has established the importance of cost reductions [24] in order
to create competitive technologies comparable with onshore renewable energies. In addition,
presently, there is not any software that allows the user to develop the economic calculation of the
offshore renewable energy of several choices (wind, waves, and wind and waves), which is the
objective of the present work.
The aim of this paper is to create a software to calculate the most important parameters of the
economic feasibility of a floating offshore renewable farm in a selected location.
2. Software Characteristics
2.1. Description of the Software
The software can calculate the economic parameters of several types of offshore renewable
energies, as follows: one renewable energy (floating offshore wind—WindFloat, TLP, and spar;
floating wave energy—Pelamis [25] and AquaBuoy [26]), hybrid offshore wind and wave systems
(Wave Dragon [27] and W2Power [28]), and combined offshore wind and waves with different
systems (independent arrays, peripherally distributed arrays, uniformly distributed arrays, and non‐
uniformly distributed arrays). The user can select several inputs, namely: location, configuration of
the farm, type of floating offshore platform, type of calculation of the wave’s energy, power of the
farm, life‐cycle of the farm, electric tariff, capital cost, corporate tax, steel cost, percentage of financing,
interest, and capacity of the shipyard. The case study is focused on the Galicia region, located in the
North‐West of Spain. The economic results are as follows: the cost of each phase of the life‐cycle of
the project, the total cost of the life‐cycle of the farm, the internal rate of return (IRR), the net present
results indicate the economic feasibility of a farm of floating offshore renewable energy in a particular
location.
The objective of the created software (W2EC by LCS “Wind and Wave Energy farm economic
Calculator” by Laura Castro Santos) is to calculate several economic parameters of a floating offshore
renewable energy farm in a location. The formulation of costs has been previously developed [28].
This software has been created for the locations of Galicia, the Galicia and Cantabric region, and
Portugal, because these are the input maps data that we have available. However, if the data of other
locations is obtained, new areas of analysis can be included. Therefore, the software can be used for
any location that the user wants. The software has been registered.
The user can select the inputs wanted in order to calculate the economic maps of the location
selected. The programming language is MATLAB® (MathWorks, Natick, MA, USA), and the
software is compatible with Microsoft Windows® (Microsoft, Redmond, Washington DC, USA).
Firstly, the software calculates the main costs of the life‐cycle of the offshore renewable energy
farm (definition of the concept, design and development, manufacturing, installation [13],
exploitation, and dismantling), and then the total life‐cycle cost of the farm is calculated [29,30]. The
novelty of this work is to develop a software using an easy interface and considering several types of
offshore renewable energies. Therefore, the calculation of the costs will be conditioned by the type of
energy selected, among other factors.
In addition, the map inputs (scale parameter of the offshore wind resource, shape parameter of
the offshore wind resource, distance from farm to shore, distance from farm to shipyard, distance
from farm to port, height of waves, period of waves, and bathymetry) generate a map of the energy
produced in the specific location selected.
2.2. Inputs of the Software
Figure 1 shows the input variables (location, configuration of the farm, floating platform,
calculation of energy waves, total power of the farm (Ptotalfarm), number of years of the life‐cycle
(Nfarm), electric tariff, corporate tax, % financing, % interest, capital cost, cost of steel (Csteel), and
number platforms per year) that are used to calculate the total cost of the farm (Ctotal) and the input
maps related to the selected location (shape and scale of the wind parameter, bathymetry, and period
Figure 1. Flow diagram of the software. Input variables being the following: the total power of the farm (Ptotalfarm), number of years of the life‐cycle (Nfarm), cost of steel (Csteel), the number of points that the input maps have (k), energy produced (E), total cost of the farm (Ctotal), defining cost (C1), designing and developing cost (C2), manufacturing cost (C3), installing cost (C4), exploiting cost (C5),
and dismantling cost (C6).
In this context, the inputs of the software are (see Table 1, Table 2 and Figure 2):
Table 1. Inputs of the software I. TLP‐ tensioned leg platform.
Input Types
Location
Galicia
Galicia and Cantabric region
Portugal
Two renewable energies‐independent arrays
Two renewable energies‐peripherally distributed array
Two renewable energies‐uniformly distributed array
Two renewable energies‐non‐uniformly distributed array
Type of floating platform
WindFloat
Pelamis
AquaBuoy
Wave Dragon
W2Power
Poseidon
TLP
Spar
Type of calculation of the wave’s energy T and H
Matrix
Table 2. Inputs of the software II.
Inputs
Power of the farm (MW)
Life‐cycle of the farm (years)
Electric tariff (€/MWh)
Capital cost (%)
Corporate tax (%)
Steel cost (€/ton)
Percentage of Financing (%)
Interest (%)
Capacity of the shipyard (platform/year)
Figure 2. Software interface.
The software calculates the economic parameters of the project, considering the energy
produced and the total life‐cycle cost such as input variables. The economic results obtained are as
follows:
Internal rate of return of the financed project (IRR FP; %).
Net present value of the financed project (NPV FP; M€).
Discounted payback period of the financed project (DPBP FP; years).
Levelized cost of energy (LCOE; €/MWh).
2.3. Criteria and Protocol
Regarding the location, the user selects this input and he has three options (Galicia, Galicia +
Cantabric region and Portugal). These choices condition the map files (in .mat) that the software
selects for acting related to scale parameter of the offshore wind resource (Figure 3a), shape
parameter of the offshore wind resource (Figure 3b), distance from farm to shore (Figure 3c), distance
from farm to shipyard (Figure 3d), distance from farm to port (Figure 3e), height of waves (Figure
(a) (b)
(c) (d)
(e) (f)
(g) (h)
Figure 3. Map inputs: scale parameter of the offshore wind resource (a) in m/s, shape parameter of the offshore wind resource (b), distance from farm to shore in m (c), distance from farm to shipyard in m (d), distance from farm to port in m (e), height of waves in m (f), period of waves in s (g), and bathymetry in m (h).
-10.5 -10 -9.5 -9 -8.5 -8 -7.5 -7 -6.5
41.5 42 42.5 43 43.5 44 44.5
-10.5 -10 -9.5 -9 -8.5 -8 -7.5 -7 -6.5
41.5 42 42.5 43 43.5 44 44.5
-10.5 -10 -9.5 -9 -8.5 -8 -7.5 -7 -6.5
41.5 42 42.5 43 43.5 44 44.5
-10.5 -10 -9.5 -9 -8.5 -8 -7.5 -7 -6.5
41.5 42 42.5 43 43.5 44 44.5
-10.5 -10 -9.5 -9 -8.5 -8 -7.5 -7 -6.5
41.5 42 42.5 43 43.5 44 44.5
-10.5 -10 -9.5 -9 -8.5 -8 -7.5 -7 -6.5 41.5
42 42.5 43 43.5 44 44.5
-10.5 -10 -9.5 -9 -8.5 -8 -7.5 -7 -6.5 41.5
42 42.5 43 43.5 44 44.5
-10.5 -10 -9.5 -9 -8.5 -8 -7.5 -7 -6.5 41.5
Regarding the type of floating platform, the criteria is that they are divided in wind (WindFloat
[31], spar [21] and TLP (Tensioned Leg Platform) [21]), waves (Pelamis [25], AquaBuoy [32] and Wave
Dragon [33]) or hybrid (W2Power [28] and Poseidon [34]) (see Figure 4.). Depending on the type of
platform selected, the protocol to calculate the cost of manufacturing the platform, its generator, its
mooring and its anchoring, will change. In addition, it also affects to the installation, maintenance
and decommissioning cost.
Figure 4. Type of floating platform inputs: wind (WindFlaot, spar, TLP), waves (Pelamis, AquaBuoy,
Wave Dragon) and Hybrid (W2Power, Poseidon).
Regarding the configuration of the farm figure shows the four types of inputs: one renewable
energy (Figure 5a), two renewable energies and independent arrays (Figure 5b), two renewable
energies and peripherally distributed array. Figure 5c two renewable energies and uniformly
distributed array (Figure 5d) and two renewable energies and non‐uniformly distributed array
(Figure 5e). They will condition the length, type and size of the electric cable between platforms,
which has a great influence on costs.
(d). (e)
Figure 5. Configuration of the farm inputs [35]: one renewable energy (a), two renewable energies
and independent arrays (b), two renewable energies and peripherally distributed arrays (c), two
renewable energies and uniformly distributed arrays (d), and two renewable energies and non‐
uniformly distributed arrays (e).
Considering the type of calculation of the wave’s energy, there are two main types, namely: T
and H (period and height of waves, respectively), and matrix. The first consideration takes into
account a general equation for the calculation of the energy generated by a wave energy converter
considering the period of waves (𝑇 ), the height of waves (𝐻 ), the number of hours per year
(NHAT), the density of water (𝜌), the gravity (𝑔), the main dimension (𝐷 ), and the efficiency of the
wave generator (𝜂 ). This equation is used when there is not enough information of the area
selected to create the matrix (see Equation (1) [35]). Therefore, this calculation is an approximation to
the real value of the energy produced by the wave farm.
𝐸 𝑁𝐻𝐴𝑇 ∙ 2
64∙ 𝜌 ∙ 𝑔
𝜋 ∙ 𝑇 ∙ 𝐻 ∙ 𝐷 ∙ 𝜂
(1)
The second type considers the power matrix of the technology. Table 3 shows an example of the
power matrix of the Pelamis wave energy converter) and the matrix of the location, which is more
difficult to obtain.
Table 3. Pelamis power matrix (in kW) [36].
On the other side, the power farm and the life‐cycle of the farm are introduced by the user,
depend on the market being analyzed. The percentage of financing and the interest are determined
by the financing company. Finally, the capacity of the shipyard depends on the shipyard where the
platforms were built, mainly its size, and works in development in the moment of building the
platforms.
Finally, considering the outputs, the equations used are shown in Table 4, as follows [37–39]: C1,
in €, is the defining cost; C2 in € is the designing and developing cost; C3, in €, is the manufacturing cost; C4, in €, is the installing cost; C5, in €, is the exploiting cost; C6, in €, is the dismantling cost, 𝐶,
in €, is the cost of the correspondent year, 𝐸 , in MWh/year, is the energy produced, 𝑟, in %, is the
capital cost; 𝐶𝐹 is the cash flow; 𝑡, in years, is the life‐cycle of the project; and 𝐺 , in €, is the initial
investment. The project will be economically feasible if the net present value is positive, the internal
rate of return is higher than the capital cost, and the levelized cost of energy has low values.
Table 4. Output criteria.
Output Equation
Total cost 𝐶 𝐶1 𝐶2 𝐶3 𝐶4 𝐶5 𝐶6
Levelized cost of energy 𝐿𝐶𝑂𝐸
∑ 1𝐶𝑟
∑ 𝐸
1 𝑟
Net present value 𝑁𝑃𝑉 𝐺 1𝐶𝐹𝑟
Internal rate of return 𝐺 1 𝐶𝐹𝐼𝑅𝑅 0
3. Case of Study and Results
3.1. Case of Study
The case of study of the present paper is the Galician region, located in the North‐West of Spain
(in red in Figure 6.), which has very good conditions in terms of offshore wind and offshore wave
resources.
Figure 6. Galicia region (NW of Spain), in red.
The four cases studied in this paper differ, depending on their type of floating offshore
renewable energy platforms (Table 5), as follows: wind platform (WindFloat) [16,40] in Case 1, wind
platform (WindFloat) and wave platform (AquaBuoy) in Case 2, wave platform (AquaBuoy) [26] in
Case 3, and a hybrid platform that mixes wind and wave energy in the same platform (W2Power
Table 5. Characteristics of the case studies.
Input Case of Study 1 Case of Study 2 Case of Study 3 Case of Study 4
Location Galicia Galicia Galicia Galicia
Configuration of
the farm
One Renewable
Energy
Two Renewable Energies –
Independent Arrays (IA)
One Renewable
Energy
One Renewable
Energy
Floating platform WindFloat
WindFloat
and
AquaBuoy
AquaBuoy W2Power
Calculation energy
waves ‐ T and H T and H T and H
For the case study of this paper, the inputs of the four cases of study are shown in Table 6.
Table 6. Inputs.
Input Value Units
Power of the farm 200 MW
Life‐cycle of the farm 20 years
Electric tariff 150 €/MWh
Capital cost 8% ‐
Corporate tax 25% ‐
Steel cost 524 €/ton
Percentage of financing 60% ‐
Interest 5.24% ‐
Capacity of the shipyard 5 Platforms/year
3.2. Results
The software created calculates the energy produced by a floating offshore renewable energy
farm. In the particular cases of study of this paper, the energy produced by a floating offshore
renewable energy farm composed by offshore wind turbines (Figure 7a), offshore wind and waves
(different platforms) (Figure 7b), offshore wave energy (Figure 7c) and offshore hybrid platform
(wind and waves in the same platform) (Figure 7d), has different values depending on the type of
technology selected. The values go from 79,500,000 MWh/year to 701,000,000 M€/year for case 1; from
58,890,000 MWh/year to 497,340,000 M€/year for case 2; from 7,087,500 MWh/year to 121,110,000
(a)
(b)
Map E [MWh/year]
-10.5 -10 -9.5 -9 -8.5 -8 -7.5 -7 -6.5 41.5
42 42.5 43 43.5 44 44.5
1 2 3 4 5 6 7
#108
Map E [MWh/year]
-10.5 -10 -9.5 -9 -8.5 -8 -7.5 -7 -6.5 41.5
42 42.5 43 43.5 44 44.5
1 1.5 2 2.5 3 3.5 4 4.5
(c)
(d)
Figure 7. Results of the energy produced for Case 1 (a); Results of the energy produced for Case 2 (b); Results of the energy produced for Case 3 (c); Results of the energy produced for Case 4 (d).
On the other hand, the software gives results regarding the costs (C1, C2, C3, C4, C5, C6, and
Ctotal) and the economic feasibility of the floating offshore renewable energy farm (LCOE, IRR, NPV,
and DPBP).
Figure 8, Figure 9, Figure 10 and Figure 11 are the maps of results for case 1, case 2, case 3 and case 4 respectively. It is important to notice that results of all the maps depend on the shape and scale
parameters of the offshore wind resource, the distance from farm to shore, distance from farm to
shipyard, distance from farm to port, the height and the period of waves and the bathymetry of the
location of study (in this case the Galician region). This fact is shown in Figure 8, Figure 9, Figure 10
Map E [MWh/year]
-10.5 -10 -9.5 -9 -8.5 -8 -7.5 -7 -6.5
41.5 42 42.5 43 43.5 44 44.5
1 2 3 4 5 6 7 8 9 10 11 12
#107
Map E [MWh/year]
-10.5 -10 -9.5 -9 -8.5 -8 -7.5 -7 -6.5
41.5 42 42.5 43 43.5 44 44.5
0.5 1 1.5 2 2.5 3
and Figure 11. Of course, the maps of results depend on the inputs, therefore this software is valid for all the locations that user wants.
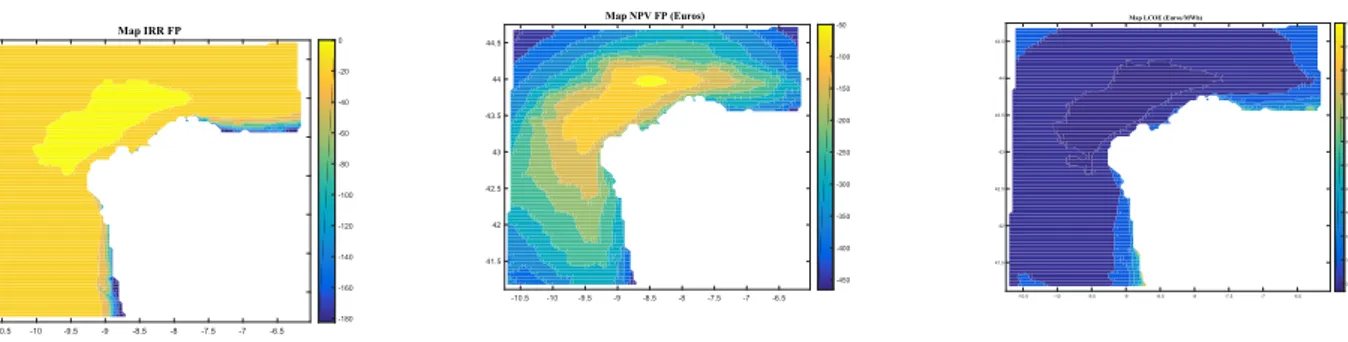
Regarding case 1, results depends on the location and they go (see Figure 8): from 6.94 M€ to
126.52 M€ for C1; 0.46 M€ for C2; from 403.02 M€ to 847.23 M€ for C3; from 14.85 M€ to 272.11 M€ for C4; from 241.68 M€ to 409.15 M€ for C5; from 1.44 M€ to 37.23 M€ for C6; from 674.21 M€ to 1,650 M€
for Ctotal; from 100.31 €/MWh to 882.93 €/MWh for LCOE; from 11 years to 22 years for DPBP; from
‐142.40% to 14.75% for IRR; and from ‐535.50 € to 330.85 € for NPV.
Figure 8. Results (C1, C1, C3, C4, C5, C6, Ctotal, LCOE, DPBP, IRR, NPV) for Case 1.
Regarding Case 2, the results depend on the location, and they go (see Figure 9) from 4.85 M€ to
503.08 M€ for C1, 0.34 M€ for C2, from 367.45 M€ to 676.09 M€ for C3, from 9.92 M€ to 180.32 M€ for
C4, from 314.59 M€ to 482.57 M€ for C5, from 20.72 M€ to 37.46 M€ for C6, from 720.97 M€ to 1835.70
M€ for Ctotal, from 138.22 €/MWh to 1186.30 €/MWh for LCOE, from 18 years to 22 years for DPBP,
from −176.90% to 7.83% for IRR, and from −840.31 € to 59.06 € for NPV.
Map C1 [MEuros]
-10.5 -10 -9.5 -9 -8.5 -8 -7.5 -7 -6.5 41.5 42 42.5 43 43.5 44 44.5 10 20 30 40 50 60 70 80 90 100 110 120
Map C3 [MEuros]
-10.5 -10 -9.5 -9 -8.5 -8 -7.5 -7 -6.5 41.5 42 42.5 43 43.5 44 44.5 450 500 550 600 650 700 750
800 Map C4 [MEuros]
-10.5 -10 -9.5 -9 -8.5 -8 -7.5 -7 -6.5 41.5 42 42.5 43 43.5 44 44.5 50 100 150 200 250
Map C5 [MEuros]
-10.5 -10 -9.5 -9 -8.5 -8 -7.5 -7 -6.5 41.5 42 42.5 43 43.5 44 44.5 250 300 350
400 Map C6 [MEuros]
-10.5 -10 -9.5 -9 -8.5 -8 -7.5 -7 -6.5 41.5 42 42.5 43 43.5 44 44.5 5 10 15 20 25 30
35 Map Ctotal [MEuros]
-10.5 -10 -9.5 -9 -8.5 -8 -7.5 -7 -6.5 41.5 42 42.5 43 43.5 44 44.5 700 800 900 1000 1100 1200 1300 1400 1500 1600
Map IRR FP
-10.5 -10 -9.5 -9 -8.5 -8 -7.5 -7 -6.5 41.5 42 42.5 43 43.5 44 44.5 -140 -120 -100 -80 -60 -40 -20
0 Map NPV FP (Euros)
-10.5 -10 -9.5 -9 -8.5 -8 -7.5 -7 -6.5 41.5 42 42.5 43 43.5 44 44.5 -500 -400 -300 -200 -100 0 100 200
300 Map DPBP FP (years)
-10.5 -10 -9.5 -9 -8.5 -8 -7.5 -7 -6.5 41.5 42 42.5 43 43.5 44 44.5 11 12 13 14 15 16 17 18 19 20 21 22
Map LCOE (Euros/MWh)
Figure 9. Results (C1, C1, C3, C4, C5, C6, Ctotal, LCOE, DPBP, IRR, NPV) for Case 2.
Regarding case 2, results depends on the location and they go (see Figure 9): from 4.85 M€ to
503.08 M€ for C1; 0.34 M€ for C2; from 367.45 M€ to 676.09 M€ for C3; from 9.92 M€ to 180.32 M€ for
C4; from 314.59 M€ to 482.57 M€ for C5; from 20.72 M€ to 37.46 M€ for C6; from 720.97 M€ to 1,835.70
M€ for Ctotal; from 138.22 €/MWh to 1,186.30 €/MWh for LCOE; from 18 years to 22 years for DPBP;
from ‐176.90% to 7.83% for IRR; and from ‐840.31 € to 59.06 € for NPV
Map C1 [MEuros]
-10.5 -10 -9.5 -9 -8.5 -8 -7.5 -7 -6.5 41.5 42 42.5 43 43.5 44 44.5 50 100 150 200 250 300 350 400 450 500
Map C3 [MEuros]
-10.5 -10 -9.5 -9 -8.5 -8 -7.5 -7 -6.5 41.5 42 42.5 43 43.5 44 44.5 400 450 500 550 600 650
Map C4 [MEuros]
-10.5 -10 -9.5 -9 -8.5 -8 -7.5 -7 -6.5 41.5 42 42.5 43 43.5 44 44.5 20 40 60 80 100 120 140 160 180
Map C5 [MEuros]
-10.5 -10 -9.5 -9 -8.5 -8 -7.5 -7 -6.5 41.5 42 42.5 43 43.5 44 44.5 320 340 360 380 400 420 440 460
480 Map C6 [MEuros]
-10.5 -10 -9.5 -9 -8.5 -8 -7.5 -7 -6.5 41.5 42 42.5 43 43.5 44 44.5 22 24 26 28 30 32 34 36
Map Ctotal [MEuros]
-10.5 -10 -9.5 -9 -8.5 -8 -7.5 -7 -6.5 41.5 42 42.5 43 43.5 44 44.5 800 900 1000 1100 1200 1300 1400 1500 1600 1700 1800
Map IRR FP
-10.5 -10 -9.5 -9 -8.5 -8 -7.5 -7 -6.5 41.5 42 42.5 43 43.5 44 44.5 -160 -140 -120 -100 -80 -60 -40 -20
0 Map NPV FP (Euros)
-10.5 -10 -9.5 -9 -8.5 -8 -7.5 -7 -6.5 41.5 42 42.5 43 43.5 44 44.5 -800 -700 -600 -500 -400 -300 -200 -100 0
Map DPBP FP (years)
-10.5 -10 -9.5 -9 -8.5 -8 -7.5 -7 -6.5 41.5 42 42.5 43 43.5 44 44.5 18 18.5 19 19.5 20 20.5 21 21.5 22
Map LCOE (Euros/MWh)
-10.5 -10 -9.5 -9 -8.5 -8 -7.5 -7 -6.5 41.5 42 42.5 43 43.5 44 44.5 200 300 400 500 600 700 800 900 1000 1100
Map C1 [MEuros]
-10.5 -10 -9.5 -9 -8.5 -8 -7.5 -7 -6.5 41.5 42 42.5 43 43.5 44 44.5 100 200 300 400 500 600 700
800 Map C3 [MEuros]
-10.5 -10 -9.5 -9 -8.5 -8 -7.5 -7 -6.5 41.5 42 42.5 43 43.5 44 44.5 300 320 340 360 380 400 420
440 Map C4 [MEuros]
Figure 10. Results (C1, C1, C3, C4, C5, C6, Ctotal, LCOE, DPBP, IRR, NPV) for Case 3.
Regarding Case 4, the results depend on the location, and they go (see Figure 11) from 4.14 M€
to 167.97 M€ for C1, 0.17 M€ for C2, from 222.77 M€ to 350.75 M€ for C3, from 7.37 M€ to 186.64 M€
for C4, from 355.56 M€ to 521.30 M€ for C5, from 11.60 M€ to 29.81 M€ for C6, from 603.83 M€ to
1210.40 M€ for Ctotal, from 167.85 €/MWh to 1340.10 €/MWh for LCOE, more than 22 years for DPBP,
from −182.39% to −3.57% for IRR, and from −465.38 € to −39.78 € for NPV.
Map C5 [MEuros]
-10.5 -10 -9.5 -9 -8.5 -8 -7.5 -7 -6.5 41.5 42 42.5 43 43.5 44 44.5 740 760 780 800 820 840 860 880
Map C6 [MEuros]
-10.5 -10 -9.5 -9 -8.5 -8 -7.5 -7 -6.5 41.5 42 42.5 43 43.5 44 44.5 45 50 55 60 65 70 75 80 85
Map Ctotal [MEuros]
-10.5 -10 -9.5 -9 -8.5 -8 -7.5 -7 -6.5 41.5 42 42.5 43 43.5 44 44.5 1200 1400 1600 1800 2000 2200 2400
Map IRR FP
-10.5 -10 -9.5 -9 -8.5 -8 -7.5 -7 -6.5 41.5 42 42.5 43 43.5 44 44.5 -185 -184 -183 -182 -181 -180 -179 -178 -177 -176 -175
-174 Map NPV FP (Euros)
-10.5 -10 -9.5 -9 -8.5 -8 -7.5 -7 -6.5 41.5 42 42.5 43 43.5 44 44.5 -1800 -1600 -1400 -1200 -1000 -800
-600 Map LCOE (Euros/MWh)
-10.5 -10 -9.5 -9 -8.5 -8 -7.5 -7 -6.5 41.5 42 42.5 43 43.5 44 44.5 1000 2000 3000 4000 5000 6000 7000 8000 9000 10000
Map C1 [MEuros]
-10.5 -10 -9.5 -9 -8.5 -8 -7.5 -7 -6.5 41.5 42 42.5 43 43.5 44 44.5 20 40 60 80 100 120 140 160
Map C3 [MEuros]
-10.5 -10 -9.5 -9 -8.5 -8 -7.5 -7 -6.5 41.5 42 42.5 43 43.5 44 44.5 230 240 250 260 270 280 290 300 310 320 330 340
Map C4 [MEuros]
-10.5 -10 -9.5 -9 -8.5 -8 -7.5 -7 -6.5 41.5 42 42.5 43 43.5 44 44.5 20 40 60 80 100 120 140 160 180
Map C5 [MEuros]
-10.5 -10 -9.5 -9 -8.5 -8 -7.5 -7 -6.5 41.5 42 42.5 43 43.5 44 44.5 360 380 400 420 440 460 480 500 520
Map C6 [MEuros]
-10.5 -10 -9.5 -9 -8.5 -8 -7.5 -7 -6.5 41.5 42 42.5 43 43.5 44 44.5 12 14 16 18 20 22 24 26
28 Map Ctotal [MEuros]
Figure 11. Results (C1, C1, C3, C4, C5, C6, Ctotal, LCOE, DPBP, IRR, NPV) for Case 4.
Therefore, considering all of these results, the user can select what is the best technology
depending on the location. In this sense, in terms of LCOE, the best technology for the case study is
the Case 1 (offshore wind—WindFloat), because it has the smallest LCOE (100.31 €/MWh), and the
worst technology is Case 3 (wave energy‐AquaBuoy), with a minimum value of 756.39 €/MWh. On
the other hand, in terms of IRR and NPV, the best value is also for Case 1 with 14.75% and 330.85 €,
respectively, and the worst is Case 3, with values of −173.52% and −581.42 €, respectively.
4. Conclusions
The objective of this work was to present a software to calculate the most important parameters
of the feasibility of a floating offshore renewable farm in a selected location. This tool can be valuable
for enterprises or public entities that want to know the best places where an offshore renewable
energy farm can be located, because this can compile the software for the economic calculation of the
most important types of offshore renewable energies existing in the world.
The software can calculate the economic parameters of several types of offshore renewable
energies, namely: one renewable energy (floating offshore wind—WindFloat, TLP, and spar; floating
wave energy—Pelamis and AquaBuoy), hybrid offshore wind and wave systems (Wave Dragon and
W2Power), and combined offshore wind and waves with different systems (independent arrays,
peripherally distributed arrays, uniformly distributed arrays, and non‐uniformly distributed arrays).
The user can select several inputs, namely: location, configuration of the farm, type of floating
offshore platform, type of calculation of the wave’s energy, power of the farm, life‐cycle of the farm,
electric tariff, capital cost, corporate tax, steel cost, percentage of financing, interest, and capacity of
the shipyard.
The economic results are as follows: the cost of each phase of the life‐cycle of the project, the total
cost of the life‐cycle of the farm, the internal rate of return (IRR), the net present value (NPV), the
discounted payback period (DPBP), and the levelized cost of energy (LCOE).
The case study considered here analysed the Galician region (North‐West of Spain), using four
alternatives depending on the technology, namely: one renewable energy (offshore wind, WindFloat;
wave energy, AquaBuoy; and a hybrid system with offshore wind and waves, W2Power) and two
renewable energies installed separately in the same farm (offshore wind, Windfloat and wave energy,
AquaBuoy). The software gives the results for the case that the user selects. In this particular case
study, the technology that is more economically feasible is the offshore wind (WindFloat) with the
best value of LCOE (100.31 €/MWh), IRR (14.75%, and NPV (330.85 €), and the technology with the
worst economic values is the wave energy (AquaBuoy), with results of 756.39 €/MWh (LCOE),
−173.52% of IRR, and −581.42 € of NPV.
The results depend on the shape and scale parameters of the offshore wind resources, the
distance from farm to shore, distance from farm to shipyard, distance from farm to port, the height
and the period of waves, and the bathymetry of the location of study. The results indicate the
economic feasibility of a farm of floating offshore renewable energy in a particular location.
Map IRR FP
-10.5 -10 -9.5 -9 -8.5 -8 -7.5 -7 -6.5 41.5
42 42.5 43 43.5 44 44.5
-180 -160 -140 -120 -100 -80 -60 -40 -20 0
Map NPV FP (Euros)
-10.5 -10 -9.5 -9 -8.5 -8 -7.5 -7 -6.5 41.5
42 42.5 43 43.5 44 44.5
-450 -400 -350 -300 -250 -200 -150 -100
-50 Map LCOE (Euros/MWh)
-10.5 -10 -9.5 -9 -8.5 -8 -7.5 -7 -6.5 41.5
42 42.5 43 43.5 44 44.5
Author Contributions: introduction: Laura Castro‐Santos, Almudena Filgueira‐Vizoso; software characteristics:
Laura Castro‐Santos; case of study and results: Laura Castro‐Santos; conclusions: Laura Castro‐Santos,
Almudena Filgueira‐Vizoso All authors have read and agreed to the published version of the manuscript.
Funding: This research received no external funding.
Conflicts of Interest: The authors declare no conflicts of interest
References
1. Kallehave, D.; Byrne, B. W.; LeBlanc Thilsted, C.; Mikkelsen, K. K. Optimization of monopiles for offshore
wind turbines. Philos. Trans. R. Soc. A Math. Phys. Eng. Sci. 2015, 373.
2. Henderson, A. R.; Witcher, D. Floating offshore wind energy ‐ a review of the current status and an
assessment of the prospects. Wind Eng. 2010, 34, 1–16.
3. Offshore Wind in Europe Offshore Wind in Europe. Wind Eur. 2018.
4. Henderson, A. R.; Leutz, R.; Fujii, T. Potential for Floating Offshore Wind Energy in Japanese Waters. In
12th International Offshore and Polar Engineering Conference; International Society of Offshore and Polar
Engineers: Kitakyushu, Japan, 2002; Vol. 3, pp. 505–512.
5. Kosugi, A.; Ogata, R.; Kagemoto, H.; Akutsu, Y.; Kinoshita, T. A feasibility study on a floating wind farm off Japan coast. In Proceedings of The Twelfth (2002) International Offshore and Polar Engineering Conference;
Kitakyushu, Japan, 2002.
6. Ulazia, A.; Gonzalez‐Roji, S. J.; Ibarra‐Berastegi, G.; Carreno‐Madinabeitia, S.; Saenz, J.; Nafarrate, A.
Seasonal Air Density Variations over the East of Scotland and the Consequences for Offshore Wind Energy.
In 7th International IEEE Conference on Renewable Energy Research and Applications, ICRERA 2018; Paris, France, 14–17 on October 2018; Volume 5, pp. 261–265.
7. Myhr, A.; Bjerkseter, C.; Ågotnes, A.; Nygaard, T. A. Levelised cost of energy for offshore floating wind
turbines in a lifecycle perspective. Renew. Energy 2014, 66, 714–728.
8. Repsol Repsol. Available online: http://www.repsol.es (accessed 26 Dec, 2019).
9. Navantia Navantia. Available online: http://www.navantia.es (accessed 26 Dec, 2019).
10. Schillings, C.; Wanderer, T.; Cameron, L.; van der Wal, J. T.; Jacquemin, J.; Veum, K. A decision support system for assessing offshore wind energy potential in the North Sea. Energy Policy 2012, 49, 541–551. 11. Castro‐Santos, L.; Prado Garcia, G.; Estanqueiro, A.; A.P.S. Justino, P. The Levelized Cost of Energy (LCOE)
of wave energy using GIS based analysis: The case study of Portugal. Int. J. Electr. Power Energy Syst. 2015,
65, 21–25.
12. Itiki, R.; Di Santo, S. G.; Costa, E. C. M.; Monaro, R. M. Methodology for mapping operational zones of VSC‐HVDC transmission system on offshore ports. Int. J. Electr. Power Energy Syst. 2017, 93, 266–275.
13. Castro‐Santos, L.; Filgueira‐Vizoso, A.; Lamas‐Galdo, I.; Carral‐Couce, L. Methodology to calculate the
installation costs of offshore wind farms located in deep waters. J. Clean. Prod. 2018, 170, 1124–1135. 14. Aubault, A.; Cermelli, C.; Roddier, D. Windfloat: a floating foundation for offshore wind turbines. Part III:
Structural analysis. In ASME 28th International Conference on Ocean, offshore and Arctic Engineering
OMAE2009; Honolulu, Hawaii (USA), 2009; pp. 1–8.
15. Maciel, J. The WindFloat Project; 2010.
16. Matha, D. Model Development and Loads Analysis of an Offshore Wind Turbine on a Tension Leg Platform
, with a Comparison to Other Floating Turbine Concepts; 2010.
17. Oguz, E.; Clelland, D.; Day, A. H.; Incecik, A.; López, J. A.; Sánchez, G.; Almeria, G. G. Experimental and numerical analysis of a TLP floating offshore wind turbine. Ocean Eng. 2018, 147, 591–605.
18. Driscoll, F.; Jonkman, J.; Robertson, A.; Sirnivas, S.; Skaare, B.; Nielsen, F. G. Validation of a FAST Model of the Statoil‐hywind Demo Floating Wind Turbine. Energy Procedia 2016, 94, 3–19.
19. Athanasia, A. Deep offshore and new foundation concepts. In DeepWind2013; Trondheim, Norway, 2013;
p. 17.
20. Jonkman, J.; Matha, D. Dynamics of offshore floating wind turbines — analysis of three concepts. Wind
Energy 2011, 14, 557–569.
21. Jonkman, J.; Matha, D. A quantitative comparison of the responses of three floating platforms; National Renewable
22. Sclavounos, P. D.; Lee, S.; DiPietro, J. Floating offshore wind turbines: tension leg platform and taught leg
buoy concepts supporting 3–5 mw wind turbines. In European Wind Energy Conference (EWEC); Warsaw,
Poland, 20‐23 April 2010; pp. 1–7.
23. Collu, M.; Kolios, A. A. J.; Chabardehi, A.; Brennan, F. RINA, Royal Institution of Naval Architects–Marine
Renewable and Offshore Wind Energy. London, UK 2010, pp. 63–74.
24. Wind Europe Driving cost reductions in offshore wind; 2017.
25. Pelamis Wave Power Pelamis Webpage http://www.pelamiswave.com. (accessed 26 Dec, 2019).
26. Weinstein, A.; Fredrikson, G.; Jane, M.; Group, P.; Denmark, K. N. R. AquaBuOY ‐ The Offshore Wave
Energy Converter Numerical Modeling and Optimization. In; IEEE, 2003; pp. 1854–1859.
27. Castro‐Santos, L.; Silva, D.; Bento, A. R.; Salvação, N.; Soares, C. G. Economic feasibility ofwave energy
farms in Portugal. Energies 2018, 11, 1–16.
28. Pelagic Power AS W2Power web page http://www.pelagicpower.no/ (accessed Feb 17, 2016).
29. Castro‐Santos, L.; Martins, E.; Soares, C. G. Methodology to calculate the costs of a floating offshore
renewable energy farm. Energies 2016, 9, 324.
30. Castro‐Santos, L.; Filgueira‐Vizoso, A.; Carral‐Couce, L.; Formoso, J. Á. F. Economic feasibility of floating offshore wind farms. Energy 2016, 112, 868–882.
31. Castro‐Santos, L.; Diaz‐Casas, V. Life‐cycle cost analysis of floating offshore wind farms. Renew. Energy
2014, 66, 41–48.
32. Dunnett, D.; Wallace, J. S. Electricity generation from wave power in Canada. Renew. Energy 2009, 34, 179– 195.
33. Page, W. D. W. Wave Dragon Technology http://www.wavedragon.net (accessed Sep 7, 2016).
34. Floating Power Plant AS Poseidon Floating Power web page http://www.floatingpowerplant.com/
(accessed Feb 17, 2016).
35. Castro‐Santos, L.; Martins, E.; Guedes Soares, C. Economic comparison of technological alternatives to
harness offshore wind and wave energies. Energy 2017, 140, 1121–1130.
36. Silva, D.; Bento, A. R.; Martinho, P.; Guedes Soares, C. High Resolution local wave energy modelling in the Iberian Peninsula. Energy 2015, 91 and 94, 1099–1112 and 857–858.
37. Castro‐Santos, L. Energía Eólica Marina ‐ Situación actual. In I Jornadas sobre Energías Renovables Marinas:
Eólica Marina & Offshore; Ferrol, Spain, 2014.
38. Silva, D.; Rusu, E.; Guedes Soares, C. Evaluation of Various Technologies for Wave Energy Conversion in
the Portuguese Nearshore. Energies 2013, 6, 1344–1364.
39. Castro‐Santos, L.; Martins, E.; Guedes Soares, C. Cost assessment methodology for hybrid floating offshore
renewable energy platforms. Renew. Energy 2016, 97, 866–880.
40. Roddier, D.; Cermelli, C. Windfloat: a floating foundation for offshore wind turbines. Part I: design basis
and qualification process. In ASME 28th International Conference on Ocean, Offshore and Arctic Engineering
(OMAE2009); Honolulu, Hawaii (USA), 2009; pp. 1–9.
© 2019 by the authors. Licensee MDPI, Basel, Switzerland. This article is an open access
article distributed under the terms and conditions of the Creative Commons
![Figure 5. Configuration of the farm inputs [35]: one renewable energy (a), two renewable energies](https://thumb-us.123doks.com/thumbv2/123dok_es/7035859.312775/8.892.138.554.114.325/figure-configuration-farm-inputs-renewable-energy-renewable-energies.webp)