ESSAYS ON HUMAN CAPITAL
Jessica Helen Pérez Reynosa
Dipòsit Legal: T.74-2014
ADVERTIMENT. L'accés als continguts d'aquesta tesi doctoral i la seva utilització ha de respectar els drets de la persona autora. Pot ser utilitzada per a consulta o estudi personal, així com en activitats o materials d'investigació i docència en els termes establerts a l'art. 32 del Text Refós de la Llei de Propietat Intel·lectual (RDL 1/1996). Per altres utilitzacions es requereix l'autorització prèvia i expressa de la persona autora. En qualsevol cas, en la utilització dels seus continguts caldrà indicar de forma clara el nom i cognoms de la persona autora i el títol de la tesi doctoral. No s'autoritza la seva reproducció o altres formes d'explotació efectuades amb finalitats de lucre ni la seva comunicació pública des d'un lloc aliè al servei TDX. Tampoc s'autoritza la presentació del seu contingut en una finestra o marc aliè a TDX (framing). Aquesta reserva de drets afecta tant als continguts de la tesi com als seus resums i índexs.
ADVERTENCIA. El acceso a los contenidos de esta tesis doctoral y su utilización debe respetar los derechos de la persona autora. Puede ser utilizada para consulta o estudio personal, así como en actividades o materiales de investigación y docencia en los términos establecidos en el art. 32 del Texto Refundido de la Ley de Propiedad Intelectual (RDL 1/1996). Para otros usos se requiere la autorización previa y expresa de la persona autora. En cualquier caso, en la utilización de sus contenidos se deberá indicar de forma clara el nombre y apellidos de la persona autora y el título de la tesis doctoral. No se autoriza su reproducción u otras formas de explotación efectuadas con fines lucrativos ni su comunicación pública desde un sitio ajeno al servicio TDR. Tampoco se autoriza la presentación de su contenido en una ventana o marco ajeno a TDR (framing). Esta reserva de derechos afecta tanto al contenido de la tesis como a sus resúmenes e índices.
Universitat Rovira I Virgili
Faculty of Economics and Business
Department of Economics
Jessica Helen P´erez Reynosa
ESSAYS ON HUMAN CAPITAL
Ph.D. Dissertation
Director : Luis D´ıaz-Serrano
Co-Director: Susana Iranzo Sancho
Jessica Helen P´erez Reynosa
ESSAYS ON HUMAN CAPITAL
DOCTORAL THESIS
Submitted to the Department of Economics
in partial fulfillment of the requirements for the degrees of
Doctor of Philosophy
at the
Universitat Rovira i Virgili
Supervised by:
Ph.D. Luis D´ıaz-Serrano
Director
Ph.D. Susana Iranzo Sancho
Co-Director
Departament d’Economia
Avda. de la Universitat, 1
43204 Reus
Tel. 977 75 98 11
Fax. 977 75 89 07
WE STATE that the present study, entitled “Essays on Human Capital”, presented by Jessica
Helen P´erez Reynosa for the award of the degree of Doctor, has been carried out under our
super-vision at the Department of Economics of this university, and that it fulfills all the requirements
to be eligible for the International Doctorate Award.
Reus, 16 September 2013
Doctoral Thesis Supervisor Doctoral Thesis Supervisor
Luis D´ıaz-Serrano Susana Iranzo Sancho
Director Co-Director
CPISR-1 C Luis Díaz Serrano 2013.10.31 13:26:21 +01'00'
Acknowledgment
First, thank God for letting me get here and for being surrounded by great people to achieve
this goal. It has been a great four-year project that finally comes to an end. I appreciate all
the support, patience and guidance of the following people who have contributed directly and
indirectly to the completion of this thesis.
I would like to express my deepest appreciation and gratitude to my advisors, Prof. Luis
D´ıaz-Serrano and Prof. Susana Iranzo, for their invaluable guidance and encouragement that helped
me to carry out this thesis. I am truly in debt and thankful to Prof. D´ıaz-Serrano, for his constant
support, patience and help. Without his guidance I could not have concluded this work. I owe my
deepest gratitude to Prof. Susana Iranzo for giving me at the first step the opportunity to pursue
my doctoral studies under her guidance and direction. Their wide knowledge, commitment and
enthusiasm were always a motivation for me. I cannot say thank you enough for their support,
advice and encouragement.
I would like to thank the Department of Economics of Universitat Rovira I Virgili, for providing
the support and equipment I have needed to produce and complete my thesis. Specially, I thank
to Prof. Bernd Theilen, Director, Department of Economics and Prof. Miquel Manj´on Antolin,
Master coordinator (2009-2010), for giving me the opportunity to undertake doctoral studies
through a predoctoral fellowship. I also thank to all the administrative staff of the Department
of Economics, for their cooperation and guide in all administrative issues during my stay.
We also want to thank to Prof. Joop Hartog, University of Amsterdam; Prof. Ferr´an Ma˜n´e,
Universitat Rovira I Virgili and Prof. Maite Bl´azquez, Universidad Aut´onoma de Madrid, for
agreeing to be members of the dissertation committee. I also thank to Prof. Hernando Zuleta,
referees of my thesis dissertation.
I am grateful to Prof. Mario Jametti, University of Lugano, for giving me the opportunity to
stay in the Institute of Economics (IdEP). Thanks to IdEP for providing me an office space, access
to their resources and the opportunity to present my work in an internal Brown Bag seminar.
The stay in Lugano was very helpful since I was able to attend seminars and share with students
and faculty members of the department.
I would like to acknowledge to Prof. Ferr´an Ma˜n´e for providing the access to the database used
in the first chapter. I wish to thank Prof. Timothy Besley and Prof. Marta Reynal-Querol for
generously agreeing to make the data in Besley and Reynal-Querol (2011) available for carrying
out the second chapter.
This thesis has also been made possible by external funding. Prof. D´ıaz-Serrano and I
acknowledge the financial support from the Spanish Ministry of Education and Science through
Grant ECO2010-20829 for carrying out the last two chapters. I also had the financial support of
the SGR Program (2009-SGR-322) of the Regional Government of Catalonia.
I would like to offer my special thanks to Prof. Miquel `Angel Bov´e Sans for being there in the
first moments of adaptation to a new culture and for his personal support during first months. I
am still waiting for the book “100 motivos para ser del bar¸ca”!.
The whole process of the thesis has been a rollercoaster of emotions and personally I have been
blessed of always having support of the following people: Shirley Triana, Carlos Hurtado, Paula
Alvarado, Judit Albiol, Marina Bannikova, Guiomar Iba˜nez, Sergi Bosque and Judit Martinez.
Thank you all for being there when I needed them the most. I also thank my cheerful group of
fellow students: Patricia Esteve, Jordi Teixid´o, Judit Albiol, Enric Meix and Guiomar Iba˜nez for
all the experience shared together and the fun we have had in the last four years. Special thanks
to my fellow and partner, Jilber Urbina, for his love and support, especially when Stata did not
give me the answer, he was there with R to help me.
Last but not the least, I would like to thank my beloved ones, who have supported me
throughout entire process: my family. My parents, Angelita Reinosa and Carlos P´erez; my
brother and sisters, Jose Carlos, Elizabeth and Angie. Likewise, to my uncle Hugo Silva Reyes
Contents
Acknowledgment ii
Contents iv
List of Tables vi
List of Figures viii
Introduction ix
Chapter 1 Delegation of Decisions in Small Firms: Some Empirical Evidence
from Spanish SMEs. 1
1.1 Introduction . . . 1
1.2 Determinants of Decentralization within the Firm: A Literature Review . . . 3
1.2.1 Internal Factors . . . 4
1.2.2 External Factors . . . 6
1.3 Data Description . . . 7
1.3.1 Measuring Decentralization . . . 8
1.3.2 Measuring the Determinants of Decentralization . . . 9
1.4 Empirical Model and Results . . . 11
1.4.1 Discrete Choice Models . . . 12
1.5 Conclusions . . . 18
References . . . 19
Appendix 1. Tables . . . 22
Chapter 2 Do More Educated Leaders Raise Citizens’ Education? 27 2.1 Introduction . . . 27
2.2 Literature Review . . . 28
2.3 Hypothesis . . . 30
2.4 Dataset and Variables . . . 31
2.5 Empirical Strategy . . . 38
2.6 Empirical Results . . . 40
2.7 Conclusions . . . 42
References . . . 43
Appendix 2. Tables and Figures. . . 47
Chapter 3 Impact of Duration of Primary Education on School Enrollment, Graduation and Drop-outs: A Cross-Country Analysis 57 3.1 Introduction . . . 57
3.2 Conceptual Framework. . . 59
3.3 Literature Review . . . 61
3.4 Empirical Strategy and Data . . . 63
3.4.1 Empirical Model . . . 63
3.4.2 Data . . . 64
3.5 Results . . . 66
3.6 Conclusions . . . 68
References . . . 69
List of Tables
Table 1.1 Summary Statistics. . . 8
Table 1.2 Results of the Baseline Ordered Probit Model: Marginal Effects.. . . 14
Table 1.3 Results of the Baseline Probit Model. . . 15
Table 1.4 Estimation Results (OLS).. . . 17
Table 1.5 Explanatory Variables and Expected Signs . . . 22
Table 1.6 Results of Ordered Probit Model (Marginal Effects): Task Planning De-cisions. . . 23
Table 1.7 Results of Ordered Probit Model (Marginal Effects): Labor Decisions. . 24
Table 1.8 Results of Ordered Probit Model (Marginal Effects): Production Decisions. 25 Table 1.9 Results of Probit Model for each Group of Decisions: Marginal Effects. . 26
Table 2.1 Variables Description and Sources . . . 47
Table 2.2 Summary Statistics (All sample) . . . 48
Table 2.3 Summary Statistics by Group of Countries. . . 48
Table 2.4 Political Leaders Included in our Sample . . . 49
Table 2.5 Positive Transitions and Negative Transitions by Country. . . 55
Table 2.6 GMM Estimation Results: Primary Completion Rate. . . 56
Table 3.1 Variables Description and Sources . . . 73
Table 3.3 Estimation Results for Primary and Secondary Education: Linear
Fixed-Effect Model. . . 75
Table 3.4 Estimation Results for Primary Education: Effect of Changes in Duration
of Primary Education. . . 76
Table 3.5 Estimation Results for Secondary Education: Effect of Changes in
List of Figures
Figure 1.1 Allocation of Decision Rights within the Firm. . . 10
Figure 2.1 Average Age of Leaders at Taking office. . . 34
Figure 2.2 Average Tenure of Leaders (expressed in years). . . 35
Figure 2.3 Evolution of Proportion of Leaders with at least College Degree.. . . 36
Figure 2.4 Evolution of Primary Completion Rate. . . 37
Figure 2.5 Primary Completion Rate and Educational Transitions: Italy. . . 38
Introduction
“Education is the most powerful weapon which you can use to change the world”.
Nelson Mandela
This thesis includes three essays on topics related to human capital, particularly that attained through education. Chapter 1 considers the human capital as an important factor which determines the allocation of decision rights within the firm. The last two chapters carry out an empirical analysis on the link between institutions, governance and education. Each chapter can be considered indepen-dently of the rest.
The first chapter is aimed at the enterprise level. Chapter 1 examines empirically the determinants of delegation of decision-making in small and medium-sized enterprises (SMEs). An important contribution of this chapter is that existing literature focuses on large firms. Instead, the research study of this chapter focuses on small and medium-sized enterprises (SMEs), that is, firms with less than 250 employees. Using a unique dataset on Spanish SMEs that includes information on the hierarchical level of the person making decisions on a number of firm issues, the results show that the determinants of decentralization in SMEs are not necessarily the same than for larger firms. The delegation of decision rights to basic workers or a team of workers is positively correlated to firm characteristics such as the use of internal networks, the number of workplaces or the firm’s export intensity. However, unlike previous studies for larger firms, firm size is found not to matter. The allocation of authority is also related to the composition of the firm’s labor force; in particular, to the average education of workers and, importantly, to their distribution as well.1
Chapter 2 using a panel of countries covering the period 1970-2004, looks at the contribution of political leaders to enhance citizens education and investigates how the educational attainment of the
population is affected while a leader with higher education remains in office. For this purpose, the empirical analysis considers educational transitions of political leaders in office defined as the change in the educational level of political leader from one mandate to other. The research findings show that the educational attainment of population increases when a more educated leader remains in office. Moreover, the educational attainment of the population is negatively impacted when a country transitions from an educated leader to a less educated one. These results are a plausible explanation for the effect of leader’s education on economic growth found in the previous literature. Also, the empirical analysis contributes to the literature by providing further evidence in the scant but emerging literature that links leaders’ characteristics with countries’ performance. Altogether, results suggest that the socio-economic background of political leaders may be informative about the type of policies they can be more sensitive. Therefore, this claims for the convenience of the use of “open lists” in democratic countries, where voters can decide not only about the party in the government but also about the individuals in each list.
Finally, Chapter 3 analyzes the impact of duration of primary education on school enrollment, graduation and drop-outs rates. The empirical analysis draws upon a panel data for non-OECD countries covering the period 1970-2012. The results show that for children in elementary school one additional grade of primary education have a negative impact on the enrollment rate, while the effect on drop-outs is positive. Analogously, it is obtained that an additional grade in primary education reduces the enrollment rate in secondary education. These results are in line with the fertility model approach, that is, in developing and underdeveloped countries parents do not have incentive to send children to school given the high perceived economic value of children. Thus, an increase in duration of primary education discourages their continuation in the education system. Although previous literature provides evidence that increasing compulsory schooling in developed countries have positive returns in terms of earnings and non-pecuniary outcomes (school externalities), this may not apply for developing and underdeveloped countries where children earnings are one component of the household income and in many cases represent the support of the entire family. Therefore, policies consisting in lasting the duration of primary education, which have been proved to be successful in developed countries, may fail in developing and underdeveloped countries since it might have an undesired impact on children educational outcomes (enrollment, graduation or drop-outs).2
CHAPTER
1
Delegation of Decisions in Small Firms: Some Empirical Evidence from
Spanish SMEs.
1.1
Introduction
The decentralization or delegation of decisions within the firm is an important issue because the
allocation of decision rights and other organizational aspects of the firm are related to several
indicators of firm performance. For instance, Kastl et al. (2013)find a positive relation between
delegation and firm R&D activity andCaroli and Van Reenen (2001)obtain a positive effect of
or-ganizational changes (including the decentralization of authority) on firm productivity. Similarly,
Cooke (1994)andBoning et al. (2007)stress the relationship between the firm’s organizational
de-sign and productivity, whereasIchniowski (1990) and Osterman (2006)highlight the relationship
with financial results and wages, respectively.
By decentralization of decisions we mean the delegation of decision rights from the owner or
manager (the principal, hereafter) to the plant supervisor and/or floor workers (the agent,
here-after) who potentially possess more information about the specific matters of the firm. However,
the interests of the principal and the agent might not be aligned, and the agent can use his or
her informational advantage to make choices that are not in the best interest of the principal.
A large theoretical literature has analyzed this trade-off between the benefits and the costs of
In recent years some efforts have also been made to empirically test the theories concerning
delegation of authority. For example, using a survey of Italian manufacturing firms,Colombo and
Delmastro (2004)investigate the relationship between the allocation of decision-making authority
and internal aspects of the firm’s organizational structure. Acemoglu et al. (2007) study
decen-tralization on a dataset on British and French firms and emphasize an establishment’s distance
to the technological frontier, as well as firm age and the heterogeneity in which the firm operates
as determinants of decentralization. Bloom et al. (2012) find that product-market competition
and trust are associated with decentralization while the religious preferences of a region can be
associated with centralization. Similarly, Guadalupe and Wulf (2010) find that product market
competition has an effect on the number of layers between division managers and the Chief
Ex-ecutive Officers (CEO). Wait and Meagher (2008) model the allocation of decision making rights
between a principal and an agent when there are multiple decisions to be made and empirically
find that delegation is more likely the more competitive the product market is and also in the
case of exporting firms. All these works focus on large firms though. Instead, in this paper we
focus on small and medium-sized enterprises (SMEs), that is, firms with less than 250 employees,
which is an important contribution of the paper.
SMEs play a key role in many economies like Spain and other southern European countries.
Just to have an idea of their economic importance, as of 2011, 99.88% of Spanish firms were
SMEs and they employed about 60% of the total workforce. In the Spanish region we look at in
this paper, Catalonia, SMEs represent 99.86% of total businesses and contribute to 51.3% of the
region gross value added. SMEs have certain particularities that make them different from larger
firms. One such aspect is the ownership structure; many of them are family businesses (that is,
the majority of the voting securities are held by a single family) which has clear implications
for the hierarchical organization and the allocation of decision rights within the firm. Moreover,
given their reduced size they naturally tend to have fewer hierarchical layers and the information
from bottom workers (and customers) to supervisors and managers can flow more easily than in
larger firms. A priori, all these factors would make us expect higher levels of centralization of
decisions among SMEs and thus it is not obvious what factors, if any, would lead to the delegation
of decision making in small and medium-sized firms.
We use the existing theoretical predictions and empirical findings concerning the delegation
of decision rights within large firms as a guideline to empirically explore the determinants of
provides detailed information on the allocation of a number of decision rights for a sample of
over 300 manufacturing SMEs in the Spanish region of Catalonia. As the dataset contains rich
information not only on the firms but also on a sample of their workers, in addition to the firm
characteristics commonly stressed in the literature, we can consider workers characteristics that
previous empirical works did not include. For example, we investigate the role of workers skills
and the distribution of workers skills as possible determinants of decentralization within the firm.
The rest of the paper is organized as follows. Section 1.2presents the empirical and theoretical
literature about the determinants of decentralization. Section 1.3 describes the dataset. In
Section 1.4the econometric model is specified and main results are presented. Finally,Section 1.5
concludes.
1.2
Determinants of Decentralization within the Firm: A Literature
Review
As said above the principal-agent problem lies at the heart of the decentralization problem and
there is a rich stream of theoretical papers analyzing the issue within this framework.1 For
instance, Aghion and Tirole (1997) show that the optimal transfer of decision authority to the
agent depends positively on the information advantage he or she enjoys with respect to the
principal and the extent of the private benefits he or she can extract from exercising
decision-making power. If the agent’s private benefits are large, delegation may increase both the agent’s
initiative to acquire information and his or her participation in the contractual relationship.
Similarly, Laffont and Martimort (1998) argue that decentralization emerges whenever limits of
communication and collusive behavior among agents are taken into account. That is, the
trade-off between the superior knowledge of the agent and the agency costs of managerial delegation
determines the optimal degree of decentralization or, in other words, the determinants governing
the decision to delegate authority depend on the costs and benefits it implies. Among thebenefits
1There exists another important strand of literature on decentralization that ignores the problem of conflicting
objectives between the principal and the agent and, instead, emphasizes the issue of coordination of imperfectly
informed actors –see for example,Geanakoplos and Milgrom (1991),Bolton and Dewatripont (1994),Aghion and
Tirole (1997),Garicano (2000),Hart and Moore (2005)andAlonso et al. (2008). These papers also highlight the
fact that hierarchical organizations that centralize the decision-making tend to have organization failures due to
information transmission leaks (Keren and Levhari, 1983,1989) and delays in transmitting information from the
of decentralization we have the following: i) it reduces the costs of information transfer and
communication because the information is processed at the level at which it is used (Caroli and
Van Reenen, 2001); ii) it increases the agent’s initiative and participation (Aghion and Tirole,
1997) and so it may increase productivity through increased involvement of lower level staff and
higher job satisfaction (Caroli and Van Reenen, 2001); iii) it allows full exploitation of agent’s
competencies as it fosters task specialization (Bolton and Dewatripont, 1994; Geanakoplos and
Milgrom, 1991);iv) it increases the response of firms to market changes and v) it reduces delays
because it allows tasks to be performed concurrently.
On the other hand, decentralization entails some costs: i) as it is natural in a context of
asymmetric information, there is a control cost; that is, agents are tempted to hide valuable
information in order to achieve their own objectives that generally are not congruent with those
of their superior (Aghion and Tirole, 1997; Poitevin, 2000; Wait and Meagher, 2008; Christie
et al., 2003);ii) there tends to be duplication of information between hierarchical levels (Greenan
and Guellec, 1994;Caroli and Van Reenen, 2001); iii) it might increase the risk of errors because
specialized monitoring disappears and there are less direct controls over the production process;
iv) it might lead to increased stress of workers due to the greater responsibility they face; v) as
decentralization leads to skill upgrading, it might also lead to increased wage inequality (Aghion
et al., 1999).
Some of the costs and benefits of decentralization are related to internal aspects of the firm
(for example, the ease with which information flows between hierarchical levels or the skills of the
workforce) while others have to do with external factors (market conditions or uncertain demand).
We use the classification between internal and external factors as guidance to our empirical work
and try to identify the determinants that affect the delegation of decisions in practice.
1.2.1 Internal Factors
Among the factors intrinsic to the firm that might affect the allocation of decision rights, the
theoretical and empirical literatures have emphasized the following: firm size and the firm
or-ganizational structure, the use of communication technologies, firm human capital, firm age and
the use of pay incentives.
Firm size might difficult the flow of information within the firm and makes local knowledge
important (Colombo and Delmastro, 2004). In effect, a larger size might lead to information
presses him to delegate decision-making power to the agent who is closer to the firm’s operations.
As for the firm organizational structure, the organization in several plants requires greater
coordination among them, which encourages the centralization of decision making.2 However,
the physical distance between the agent and the principal is also greater if the plant belongs
to a multi-unit firm, and this can have two opposite effects. First, a greater physical distance
reinforces the informational advantage on local issues enjoyed by the agent and makes
communi-cation with the principal more difficult, which favors decentralization. Second, it becomes harder
for the principal to monitor the decisions taken by the agent which, in the absence of effective
incentive systems, would lead to greater centralization. Thus, it has an ambiguous effect on
de-centralization. Likewise, the communication technologies used by the firm might either centralize
or decentralize the decision-making process (Garicano and Rossi-Hansberg, 2006). On the one
hand, the decentralization disadvantage of losing control is reduced as advanced communication
technologies allow the principal to monitor the agent and to be informed. On the other hand,
they can also reduce the disadvantages of centralization by speeding up the transmission of
in-formation from the top to the bottom of the hierarchy.3 Therefore, the effect of communication
technologies is ambiguous too.
The firm human capital is another important factor because decentralization requires higher
levels of human capital of workers in order to deal with increased responsibility and uncertainty.
Other arguments supporting this idea are the fact that skilled workers are more autonomous
and less likely to make mistakes, they are better at communicating which reduces the risk of
duplicating information and they are more able to analyze new pieces of knowledge so that the
benefits of local information processing are enhanced (Caroli et al., 2001). We go one step further
and consider not only the firm average human capital but also the dispersion of skills among the
labor force. In effect, although neglected in the literature on the allocation of decision rights,
some studies analyzing firm productivity such asIranzo et al. (2008);Ilmakunnas and Maliranta
(2005); Hellerstein et al. (1999)have looked at the composition of the labor force and found that
it does also matter.
Firm age is generally included as a control variable without a clear theoretical prediction.
Acemoglu et al. (2007), for instance, find that, on average, younger firms tend to be more
decen-2The use of yardstick competition, though, may increase the ability of the company’s headquarters to
decen-tralize decision-making (Colombo and Delmastro, 2004).
3Keren and Levhari (1979); Keren and Levhari (1983), Radner (1993)andAghion and Tirole (1997) consider
tralized than older firms.4
The nature of the decision is also important. Aghion and Tirole (1997) show that the need
to delegate authority is higher for decisions that involve large private benefits for the agent while
the decisions about projects that involve a large pay-off to the principal tend to be centralized.
For instance, decisions such as hiring staff, that affects the agent’s power and personal
relation-ships with subordinates, are more likely to be delegated whereas decisions that require greater
coordination should be retained with the agent’s superior.
Finally, given the principal-agent problem it is necessary to also take into consideration the
use of pay incentives. Colombo and Delmastro (2004) argue that the degree of decentralization
is influenced by the ability of the principal to design efficient incentive schemes to induce certain
behavior of the agent and so the use of individual pay incentives would be associated to higher
decentralization.
1.2.2 External Factors
Among the external factors to the firm that affect decentralization we focus on the conditions of
the markets in which firms operate; in particular, product market competition and whether or not
the firm operates in international markets. Regarding product market competition, Guadalupe
and Wulf (2010)argue that competition increases the need for timely decisions that make better
use of local knowledge and find that it leads to flatter firms. However,Bloom et al. (2012)present
counter-arguments to this notion: very strong competition, i.e., more firms, means more public
knowledge so there is less need to delegate to privately knowledgeable managers, and conclude
that ultimately the effect of competition on decentralization is an empirical issue. The export
status of a firm is also important because an establishment selling in a foreign market will be
under higher competitive pressures to adopt the most productive work system and this may lead
to more flexible work organizations (Osterman, 1994). Empirically, Marin and Verdier (2003)
find that greater international competition leads to the delegation of authority from the CEO to
the managers and Wait and Meagher (2008) find that workplaces that export are more likely to
decentralize decision-making rights.
4According to their data about 45% of the firms under the age of five years are decentralized, compared to 30%
1.3
Data Description
The data comes from a unique survey on small and medium-sized firms,5 conducted during 2005
and 2006 in the Spanish region of Catalonia.6 It contains a rich set of questions and information
that is not typically available in standard firm-level datasets.7 All in all, it includes information
for a cross-section of about 500 firms covering the main manufacturing and service sectors
repre-sentative of the Catalan economy. For homogeneity and ease of comparability, in this paper we
focus on manufacturing SMEs, that is, 318 firms.8 Workers from three different hierarchical levels
(core employees, supervisors and managers) in each firm were sampled randomly. On average,
about half of the workforce in a firm was interviewed and we have information on those workers
as well.
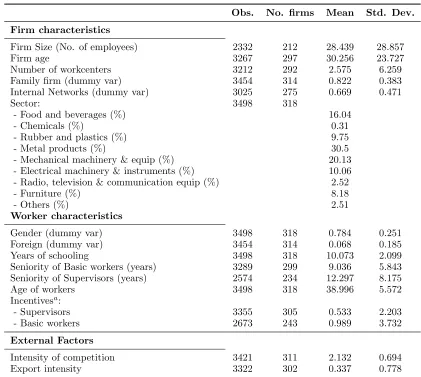
Table 1.1 provides descriptive statistics of the firm and worker characteristics of the final
sample used in our main regression models.9 Notice that as these are small and medium-sized
enterprises, the average number of employees is rather small, 28 workers. A high percentage of
the firms (82%) are family business, on average they have 2 workcenters and the average firm age
is 30 years. As for the workers characteristics, most of them are male (78% of the interviewed
workers); they have on average 10 years of schooling; basic workers and supervisors have spent
on average 9 and 12 years, respectively working in the current firm. Finally, regarding incentive
payments, as there are many workers whose salary does not include a variable component, on
average, the percentage of the salary that depends on firm performance is rather small, 0.53%
and 1% of the wages of basic workers and supervisors, respectively.
5That is, firms with less than 250 employees.
6The survey is called “Enquesta Empresarial de Desenvolupament de Producte i Necessitats de Cualificacions
Transversals” and was run by the Catalonian SME association,Petita i Mitjana Empresa de Catalunya (PIMEC).
7The survey shares some similarities with the British Workplace Employment Relations Survey (WERS), upon
which it was based, containing additional questions not included in the WERS.
8They include the following two-digit NACE-code sectors: Food products and beverages (15), Chemicals (24),
Rubber and plastic products (25), Fabricated metal products, except machinery and equipment (28), Machinery
and mechanical equipment (29), Electrical machinery and instruments (31), Radio, television and communication
equipment (32), Medical, precision and optical instruments, watches and clocks (33), Motor vehicles, trailers and
semi-trailers (34), Furniture; manufacturing not elsewhere classified (36).
9As in Colombo and Delmastro (2004), in our main empirical models we stack the firm-level data according
to the eleven firm decisions we have information on, and create a pseudo-panel. As we have 318 firms and eleven
decisions for each firm, we have a total of 3,498 firm-decision pairs. There are fewer observations in the cases of
Table 1.1: Summary Statistics.
Obs. No. firms Mean Std. Dev.
Firm characteristics
Firm Size (No. of employees) 2332 212 28.439 28.857
Firm age 3267 297 30.256 23.727
Number of workcenters 3212 292 2.575 6.259
Family firm (dummy var) 3454 314 0.822 0.383
Internal Networks (dummy var) 3025 275 0.669 0.471
Sector: 3498 318
- Food and beverages (%) 16.04
- Chemicals (%) 0.31
- Rubber and plastics (%) 9.75
- Metal products (%) 30.5
- Mechanical machinery & equip (%) 20.13
- Electrical machinery & instruments (%) 10.06
- Radio, television & communication equip (%) 2.52
- Furniture (%) 8.18
- Others (%) 2.51
Worker characteristics
Gender (dummy var) 3498 318 0.784 0.251
Foreign (dummy var) 3454 314 0.068 0.185
Years of schooling 3498 318 10.073 2.099
Seniority of Basic workers (years) 3289 299 9.036 5.843
Seniority of Supervisors (years) 2574 234 12.297 8.175
Age of workers 3498 318 38.996 5.572
Incentivesa:
- Supervisors 3355 305 0.533 2.203
- Basic workers 2673 243 0.989 3.732
External Factors
Intensity of competition 3421 311 2.132 0.694
Export intensity 3322 302 0.337 0.778
Note:a Percentage of salary depending on firm performance.
1.3.1 Measuring Decentralization
The survey contains questions on who in the firm decides on a number of issues. In particular,
the following firm decisions are considered: i) daily tasks planning, ii) weekly tasks planning,
iii) follow-up of results, iv) customer relations, v) quality control, vi) supply purchases, vii)
machinery and equipment maintenance, viii) job listing, ix) hiring, x) production technology
choice and xi) training. The possible answers to those questions range from 1 to 5, depending
on who makes the decision: the firm’s owner (value 1), manager (value 2), supervisor (value 3),
a group of workers (value 4) or basic workers (value 5). Thus, according to our definition of
decentralization a value of 5 corresponds to the greatest degree of delegation or decentralization
of decisions and a value of 1 to the greatest degree of centralization, while a value of 3 would
It is worthwhile pointing out that the degree of centralization of decisions for these small and
medium-sized firms is quite high. In most firms many of the decisions are taken by the owner
or the manager. Only 3.6% and 2.9% of the firm-decisions observations correspond to core/basic
employees and to a group of workers, respectively, with partial delegation to the supervisor
accounting for 23.2% of the observations. Thus, in order to avoid econometric problems of thin
cells for low levels of centralization, we group some of the answers to the decision questions and
consider 2 possible models depending on how the dependent variable is defined:
• A model of Centralization (if the decision is taken by the firm’s owner or manager),Partial
Delegation (if the decision is made by a supervisor) andDecentralization (if the decision is
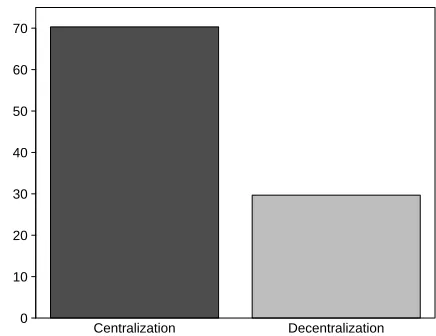
made by either a group of workers or core employees). Figure 1.1 (a)shows the distribution
of the allocation of decision rights in this case, with 70.3% of the observations indicating
centralization, 23.2% representing partial delegation and 6.5% decentralization.
• A model of just Centralization (if the decision is taken by firm’s owner or manager) and
Decentralization (if the decision is made by a supervisor, a group of workers or core
em-ployees). As Figure 1.1 (b)shows, 29.7% of the observations correspond to decentralization
now.
In the first case we estimate an ordered probit model whereas in the second case we estimate
a simple probit model.
1.3.2 Measuring the Determinants of Decentralization
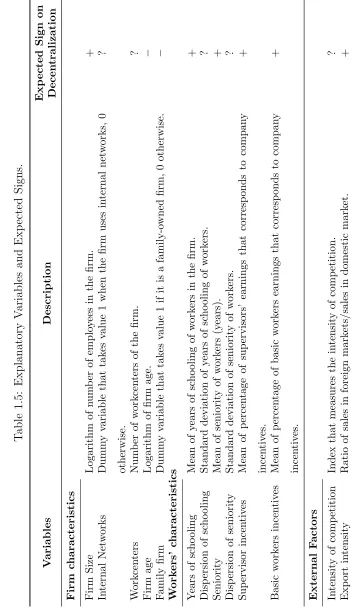
Based on our discussion on internal and external factors, we briefly discuss the proxies used in
our empirical analysis for each of the determinants of decentralization, as well as their expected
signs.10
Firm size is measured as the logarithm of the number of employees in the firm and, according
to the literature, we would expect it to have a positive impact on decentralization. The
organiza-tional structure of the firm is captured byWorkcenters, the number of workcenters that the firm
has and its expected sign is uncertain. As a proxy for information communication technologies
we use a dummy variable (Internal Networks) that takes value one if the firm has an intranet and
zero otherwise. As explained above, its expected sign is ambiguous.
Figure 1.1: Allocation of Decision Rights within the Firm (based on the question in the survey
“Who makes decision...?”).
Centralization Partial Delegation Decentralization
P
ercentage
0 10 20 30 40 50 60 70
(a) Distribution of the allocation of decision rights (Model
1): Centralization (70.3%), Partial Delegation (23.2%) and
Decentralization (6.5%).
Centralization Decentralization 0
10 20 30 40 50 60 70
(b) Distribution of the allocation of decision rights (Model
2): Centralization (70.3%) and Decentralization (29.7%).
As for the workers variables, human capital is measured as the average years of schooling of
the workers in the firm and their experience in the firm (seniority).11 We expect these variables to
have a positive impact on the delegation of authority. Importantly, we also consider the dispersion
of workers skills; in particular, the standard deviation of years of schooling (years of schooling std
dev) and experience (seniority std dev) of workers in the firm. There is no theory on whether a
more or less homogeneous labor force facilitates the delegation of authority from top to bottom
workers and so a priori there is no expected sign on these variables. The use of incentive schemes
to motivate employees is proxied bySupervisor incentives andBasic worker incentives which are
respectively the percentage of their wages that depend on firm performance. Based on the theory,
we would expect a positive effect of these variables on decentralization.
We also include a dummy variable forfamily firms. Family firms are different from non-family
firms in a number of dimensions. For example, Bassanini et al. (2013) show that family firms
tend to have lower compensation packages but also lower job insecurity. It is not unreasonable
11Ideally we would like to include the overall work experience of the workers but we only know the number of
years they have been working in the current firm. Thus, although imperfect, we use it as a proxy for experience.
Another issue with this variable to bear in mind (and that might complicate the interpretation of results) is its
to think then that family firms might have different organizational arrangements in terms of
decision-making as well. Although there is no formal prediction on the literature on delegation,
Colombo and Delmastro (2004) argue that owner-managers (about 89% of the observations in
our sample) may be unwilling to delegate authority due to personal preferences for autocratic
decision-making.
Regarding the external factors influencing decentralization we include two proxies for
product-market conditions: a variable directly measuring the intensity of competition and the firm’s
export intensity. The former is based on the subjective answers to the question in the survey
“Considering the market in which the company operates (national, international), how many
competing firms are there?” Possible answers range from 1 (“few competitors”) to 3 (“many
competitors”). So, a high value of this variable corresponds to a more competitive environment.
The firm’s export intensity was constructed from the information on the firms market share in
domestic and international markets. In particular, we took the ratio between the share of sales in
foreign markets versus the share of sales in the domestic market. Although there is no consensus
on the effect of intensity of competition, most previous empirical studies have obtained a positive
correlation between export intensity and decentralization.
We complete the list of explanatory variables with some additional controls for the workforce
such as the ratio of men to women and the percentage of foreigners in the firm. We also control
for the effect of each particular decision by including decision-specific dummies.12
1.4
Empirical Model and Results
As explained, we use the answers to the 11 firm decisions contained in the survey as our measure
of decentralization or delegation of authority within the firm and estimate two types of models:
1. Discrete choice models (ordered probit and simple probit models) on the stacked data of
firm-decision observations and
2. OLS models with a (continuous) decentralization index at the firm-level as dependent
vari-able.
We explain each type of model and present the estimation results next.
12We estimated different specifications of the model. The results reported include individual decision dummies
but we also estimated other specifications with decision-group dummies instead of individual decision dummies
1.4.1 Discrete Choice Models
The choice of allocation of authority across hierarchical levels reflects the firm’s profit
maximiza-tion. Let D∗ij denote the “optimal” allocation of authority over decision i for firm j, which is
given by:
Dij∗ =γXj+vi+εij, (i= 1, . . . ,11;j = 1, . . . ,318) (1.1)
whereXj is the vector of firm internal and external factors governing decentralization, as well as
other firm and worker controls,vi is a decision-specific fixed effect andεij is a random disturbance
term.
We do not observe Dij∗ but just a latent variable,Dij,which in the case of the ordered probit
model takes values from 1 to 3 and whose relation with the optimal allocation of authority is as
follows:
Dij = 1 (Centralization) if D∗ij ≤µ1 Dij = 2 (P artial Delegation) if µ1 < D∗ij ≤µ2 Dij = 3 (Decentralization) if D∗ij > µ2
(1.2)
Or in the case of a simple probit model:
Dij = 0 (Centralization) if D∗ij ≤µ0
Dij = 1 (Decentralization) ifD∗ij > µ0 (1.3)
with µk being, in either case, the threshold that separates the different discrete categories of
delegation of authority.
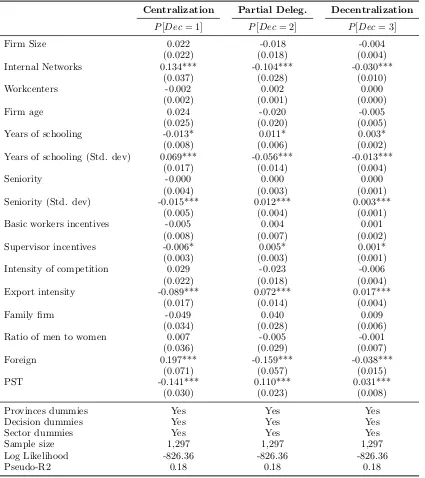
Table 1.2 reports the marginal effects of the baseline ordered probit estimation. Since we
are interested in the decentralization of decision rights, we will focus on the marginal effects
of this outcome. Decentralization is negatively and significantly associated to the use of
intra-firm communication technologies (Internal Networks). In particular, using internal networks
decreases the probability to delegate decisions onto basic workers by 3 percentage points and it
increases the probability of either the firm’s owner or the manager making the decisions by 13
percentage points. This means that the use of an intranet and other communication technologies
makes it easier for the owner or the manager to have access to all the relevant information as to
make herself the decisions without having to delegate on workers (decentralization) or supervisors
(partial delegation).
Firm size does not result significant –and as we will see, it is not significant in any of the other
models. This constitutes an important difference with previous empirical studies considering
larger firms that generally find quite a robust positive effect of firm size on decentralization. The
the costs of information transfer and communication entailed by centralization are too high so
that it becomes optimal for firms to decentralize decisions. Given our dataset of SMEs, firm size
might be too “small” as to capture that effect. With reference to the other firm characteristics,
firm age has the expected negative sign although it fails to be statistically significant, while the
coefficients on the number of workcenters and being a family firm are also insignificant.
With regard to workers characteristics, the average years of schooling is positively and
sig-nificantly correlated to decentralization. The probability of decentralization increases by 0.3
percentage points (and that of centralization decreases by 1.3 percentage points) with one
addi-tional year of average schooling of the firm’s labor force. On the other hand, average seniority has
a null effect on delegation. The other relevant and statistically significant result is the negative
correlation between the dispersion of workers schooling and decentralization. This means that the
delegation of decisions from top to bottom workers is more likely the more homogeneous, in terms
of skills or education, is the workforce.13 Delegation also appears to be positively associated to
pay incentives to both basic workers and supervisors, although the coefficient is only statistically
different from zero in the case of supervisors.14 Basing part of the supervisors’ salaries on firm
performance increases the probability of delegation to workers (decentralization) by 0.1
percent-age points and that of partial delegation by 0.5 percentpercent-age points. As for the additional control
on workers characteristics, it is worthwhile to note the negative and significant coefficient on the
dummy variable for being a foreigner. That is, firms with a higher percentage of foreign workers
tend to decentralize (even partially delegate) less whereas the gender composition does not seem
to have any significant impact on delegation.
The external factors considered here have signs that are in line with those obtained in
pre-vious empirical studies: the firm export intensity is positively and significantly correlated with
decentralization while the effect of the intensity of competition (which is based on the manager’s
13Decentralization also appears positively correlated to the dispersion of workers seniority. We do not want to
stress much this result though, because the first moment (average seniority) is irrelevant (a coefficient of small
magnitude and statistically insignificant) and, as pointed out, seniority in the firm is an imperfect measure of
human capital. Moreover, as Tables1.6 through 1.8show (See Appendix 1), this result is not as robust as the
relation between delegation and the dispersion of workers schooling.
14Throughout all the specifications, the point estimates on workers pay incentives display large standard errors
that prevent the coefficients from being statistically significant. This could respond to an identification problem
as few workers in the dataset receive pay incentives and even for those who do receive them the percentage of
their wages depending on firm performance is rather small. In other words, there is not much variability in these
Table 1.2: Results of the Baseline Ordered Probit Model: Marginal Effects.
Centralization Partial Deleg. Decentralization
P[Dec= 1] P[Dec= 2] P[Dec= 3]
Firm Size 0.022 -0.018 -0.004
(0.022) (0.018) (0.004)
Internal Networks 0.134*** -0.104*** -0.030***
(0.037) (0.028) (0.010)
Workcenters -0.002 0.002 0.000
(0.002) (0.001) (0.000)
Firm age 0.024 -0.020 -0.005
(0.025) (0.020) (0.005)
Years of schooling -0.013* 0.011* 0.003*
(0.008) (0.006) (0.002)
Years of schooling (Std. dev) 0.069*** -0.056*** -0.013***
(0.017) (0.014) (0.004)
Seniority -0.000 0.000 0.000
(0.004) (0.003) (0.001)
Seniority (Std. dev) -0.015*** 0.012*** 0.003***
(0.005) (0.004) (0.001)
Basic workers incentives -0.005 0.004 0.001
(0.008) (0.007) (0.002)
Supervisor incentives -0.006* 0.005* 0.001*
(0.003) (0.003) (0.001)
Intensity of competition 0.029 -0.023 -0.006
(0.022) (0.018) (0.004)
Export intensity -0.089*** 0.072*** 0.017***
(0.017) (0.014) (0.004)
Family firm -0.049 0.040 0.009
(0.034) (0.028) (0.006)
Ratio of men to women 0.007 -0.005 -0.001
(0.036) (0.029) (0.007)
Foreign 0.197*** -0.159*** -0.038***
(0.071) (0.057) (0.015)
PST -0.141*** 0.110*** 0.031***
(0.030) (0.023) (0.008)
Provinces dummies Yes Yes Yes
Decision dummies Yes Yes Yes
Sector dummies Yes Yes Yes
Sample size 1,297 1,297 1,297
Log Likelihood -826.36 -826.36 -826.36
Pseudo-R2 0.18 0.18 0.18
Notes: Categorical Dependent Variable: Centralization, Partial Delegation and Decentralization. This table reports the marginal effects for each possible outcome of the dependent variable. *** Significant at 1%, ** Significant at 5%, * Significant at 10%. Robust stand. errors in parentheses.
subjective perception) would be inconclusive as the coefficient fails to be statistically significant.
Finally, as the cross-section nature of the data does not allow us to use firm-fixed effects but
only decision-specific fixed effects, it is important to somehow control for some of the remaining
unobserved heterogeneity at the firm-level by including variables that might be correlated with
the tendency to delegate authority. One type of such variables is the use of certain Human
Table 1.3: Results of the Baseline Probit Model.
Marginal Effects Std. Error
Firm Size -0.032 (0.022)
Internal Networks -0.104*** (0.040) Workcenters 0.003* (0.002)
Firm age -0.015 (0.027)
Years of schooling 0.012 (0.008) Years of schooling (Std. dev) -0.071*** (0.019)
Seniority -0.001 (0.004)
Seniority (Std. dev) 0.017*** (0.005) Basic workers incentives -0.002 (0.009) Supervisor incentives 0.006 (0.004) Intensity of competition -0.038* (0.022) Export intensity 0.099*** (0.022)
Family firm 0.038 (0.036)
Ratio of men to women 0.007 (0.039)
Foreign -0.153* (0.083)
PST 0.154*** (0.034)
Provinces dummies Yes Decision dummies Yes Sector dummies Yes
Sample size 1,297
Log Likelihood -619.80
Pseudo-R2 0.23
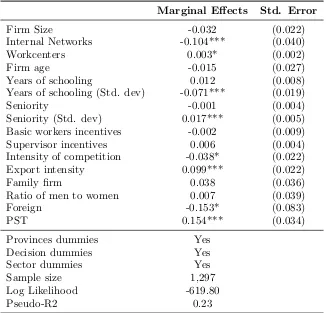
Notes: Dependent Variable: Decentralization. This table reports the marginal
effects of the baseline probit model. *** Significant at 1%, ** Significant at 5%,
* Significant at 10%. Robust standard errors in parentheses.
workers. Thus, we use a dummy variable for whether the firm uses Problems Solution Teams
(PST), one of the human resource management practices for which information is available.15
By and large, we obtain the same qualitative results with our baseline probit model where
decentralization is defined as the allocation of decision rights to any hierarchical level below the
manager. The estimation results are presented in Table 1.3. Clearly, we confirm the negative
correlation between decentralization and the use of internal communication technologies and the
dispersion of workers education, and the positive correlation between decentralization and export
intensity. In this case, we also obtain a positive correlation between delegation and the number
of workcenters and a negative and significant (at the 10% significance level) effect of intensity
of competition on the probability to decentralize which is not completely incongruent with the
previous literature.
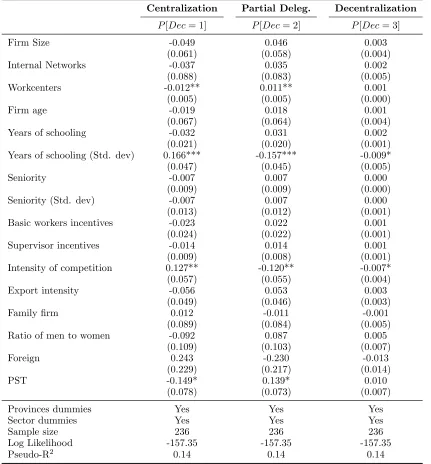
As robustness checks, we estimate the models separately for different groups of decisions. Using
factor analysis, we identify the decisions that are more related among them and consequently
group the 11 firm decisions into 3 subgroups: task planning decisions (daily and weekly tasks
planning decisions), labor decisions (decisions on job listing, hiring and training) andproduction
decisions (that include the decisions on follow-up of results, quality control, supply purchases,
machinery and equipment maintenance and production technology choice). Tables 1.6 through
1.9 (see Appendix 1) report the results of the ordered probit estimation and for the simple probit
model for each of those sub-groups. Although we lose estimation precision when we split the
sample into the 3 decision subgroups and due to the large standard errors some of the variable
coefficients are no longer significant, we confirm the most important qualitative results obtained
for the pooled firm-decisions data. Decentralization is significant and negatively correlated with
the use of internal networks (in the case of production decisions), the heterogeneity of workers
educational levels (labor and task planning decisions) and the intensity of competition (task
planning decisions), whereas it is positively and significantly correlated with the firm export
intensity (production and labor decisions).
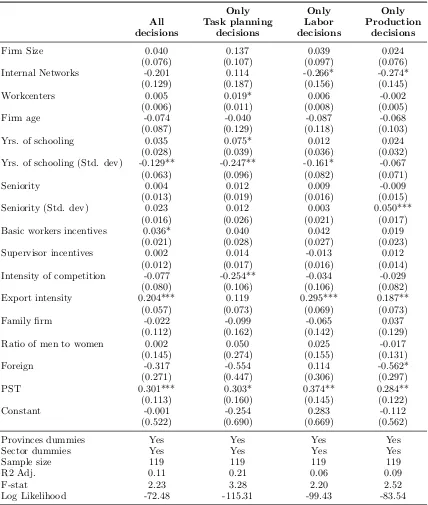
1.4.2 OLS Models
Alternatively to the estimation of discrete choice models on the stacked data of firm-decision
observations, we construct different continuous indices of decentralization at the firm-level and
estimate simple linear OLS models. In particular, we compute an overall index of decentralization
based on the 11 decisions and indices for the 3 different subgroups of decisions listed above, that
is, for task-planning, labor and production decisions.
Table 1.4 presents the OLS estimation results for those decentralization indices. It is
worth-while noting that as we have now only firm-level observations (instead of the pseudo-panel of
firm-decision observations) the sample size is considerably reduced and this results in large
stan-dard errors and identification problems in some of the specifications.16 Yet, we confirm the
robustness of most of our previous results. Firms with more homogeneous workforce in terms
of education tend to decentralize more –the coefficient on the dispersion of years of schooling is
negative throughout all the models and it is also highly significant with the only exception of
the group of production decisions. Delegation is also higher when firms use pay incentives for
basic workers, although this effect is only statistically significant in the pooled data. The use of
internal networks presents, except for task planning decisions, a negative coefficient that is now
only significant in the case of labor decisions. Other firm characteristics such as size or being
Table 1.4: Estimation Results (OLS).
Only Only Only
All Task planning Labor Production
decisions decisions decisions decisions
Firm Size 0.040 0.137 0.039 0.024
(0.076) (0.107) (0.097) (0.076)
Internal Networks -0.201 0.114 -0.266* -0.274*
(0.129) (0.187) (0.156) (0.145)
Workcenters 0.005 0.019* 0.006 -0.002
(0.006) (0.011) (0.008) (0.005)
Firm age -0.074 -0.040 -0.087 -0.068
(0.087) (0.129) (0.118) (0.103)
Yrs. of schooling 0.035 0.075* 0.012 0.024
(0.028) (0.039) (0.036) (0.032)
Yrs. of schooling (Std. dev) -0.129** -0.247** -0.161* -0.067
(0.063) (0.096) (0.082) (0.071)
Seniority 0.004 0.012 0.009 -0.009
(0.013) (0.019) (0.016) (0.015)
Seniority (Std. dev) 0.023 0.012 0.003 0.050***
(0.016) (0.026) (0.021) (0.017)
Basic workers incentives 0.036* 0.040 0.042 0.019
(0.021) (0.028) (0.027) (0.023)
Supervisor incentives 0.002 0.014 -0.013 0.012
(0.012) (0.017) (0.016) (0.014)
Intensity of competition -0.077 -0.254** -0.034 -0.029
(0.080) (0.106) (0.106) (0.082)
Export intensity 0.204*** 0.119 0.295*** 0.187**
(0.057) (0.073) (0.069) (0.073)
Family firm -0.022 -0.099 -0.065 0.037
(0.112) (0.162) (0.142) (0.129)
Ratio of men to women 0.002 0.050 0.025 -0.017
(0.145) (0.274) (0.155) (0.131)
Foreign -0.317 -0.554 0.114 -0.562*
(0.271) (0.447) (0.306) (0.297)
PST 0.301*** 0.303* 0.374** 0.284**
(0.113) (0.160) (0.145) (0.122)
Constant -0.001 -0.254 0.283 -0.112
(0.522) (0.690) (0.669) (0.562)
Provinces dummies Yes Yes Yes Yes
Sector dummies Yes Yes Yes Yes
Sample size 119 119 119 119
R2 Adj. 0.11 0.21 0.06 0.09
F-stat 2.23 3.28 2.20 2.52
Log Likelihood -72.48 -115.31 -99.43 -83.54
Notes: *** Significant at 1%, ** Significant at 5 %, * Significant at 10 %. Robust standard errors
in parentheses.
a family firm continue to have statistically insignificant coefficients. Finally, decentralization is
higher (and this effect is generally statistically significant) for all decisions and for all groups of
decisions among those firms that export more while firms facing more intense competition tend to
centralize decisions more, although this correlation is only significant in the case of task planning
1.5
Conclusions
Using a unique dataset on SMEs, we empirically investigate the factors affecting decentralization
or delegation of authority within the firm in the case of small and medium-sized enterprises.
Since most of the studies on decentralization have looked at large companies, this is an important
contribution of the paper.
We consider eleven strategic decisions to a firm’s activity and test the predictions of economic
theory for a sample of 318 Spanish manufacturing firms. In particular, we estimate discrete choice
models on the probability to delegate decisions from the owner or manager to lower hierarchical
levels in the firm (basic workers and/or supervisors). Our main empirical results are easily
summarized. First, as found in previous studies, internal aspects of the firms such as the use of
internal networks or the number of workplaces affect the degree of decentralization of decisions
in the firm. External aspects such as product market conditions, proxied by the intensity of
competition and the firm’s export intensity, are significant determinants of delegation as well.
It is also important to note some of the differences we obtain with respect to the previous
empirical works considering larger firms. For instance, while the positive effect of firm size on
decentralization tends to be a generally pretty robust result, in our sample of small and
medium-sized firms it is never a significant explanatory factor of delegation of decisions. Other aspects
such as the use of pay incentives does not seem to matter much either. However, in this case
caution is in order as one can not be sure whether pay incentives genuinely do not affect the
allocation of decision-making rights in SMEs or whether this is rather an identification problem
due to the low use of this type of incentives.
Finally, we show that workers characteristics and the composition of the firm’s labor force are
also related to the delegation of decisions. In particular, workers with a higher educational level
and a more homogeneous labor force in terms of education are associated to higher degrees of
References
Acemoglu, D., Aghion, P., Lelarge, C., Van Reenen, J., and Zilibotti, F. (2007). Technology,
Information, and the Decentralization of the Firm. The Quarterly Journal of Economics,
122(4):1759–1799.
Aghion, P., Caroli, E., and Garc´ıa-Pe˜nalosa, C. (1999). Inequality and Economic Growth: The
Perspective of the New Growth Theories. Journal of Economic Literature, 37(4):1615–1660.
Aghion, P. and Tirole, J. (1997). Formal and Real Authority in Organizations.Journal of Political
Economy, 105(1):1–29.
Alonso, R., Dessein, W., and Matouschek, N. (2008). When Does Coordination Require
Central-ization? The American Economic Review, 98(1):145–179.
Bassanini, A., Breda, T., Caroli, E., and Reb´erioux, A. (2013). Working in Family Firms: Paid
Less But More Secure? Evidence from Matched Employer-employee Data. Industrial and Labor
Relations Review, 66(2):433–466.
Bloom, N., Sadun, R., and Van Reenen, J. (2012). The Organization of Firms Across Countries.
The Quarterly Journal of Economics, 127(4):1663–1705.
Bolton, P. and Dewatripont, M. (1994). The Firm as a Communication Network. The Quarterly
Journal of Economics, 109(4):809–839.
Boning, B., Ichniowski, C., and Shaw, K. (2007). Opportunity Counts: Teams and the
Effective-ness of Production Incentives. Journal of Labor Economics, 25(4):613–650.
Caroli, E., Greenan, N., and Guellec, D. (2001). Organizational Change and Skill Accumulation.
Industrial and Corporate Change, 10(2):481–506.
Caroli, E. and Van Reenen, J. (2001). Skill-Biased Organizational Change? Evidence from a Panel
of British and French Establishments. The Quarterly Journal of Economics, 116(4):1449–1492.
Christie, A. A., Joye, M. P., and Watts, R. L. (2003). Decentralization of the Firm: Theory and
Evidence. Journal of Corporate Finance, 9(1):3 – 36.
Colombo, M. G. and Delmastro, M. (2004). Delegation of Authority in Business Organizations:
Cooke, W. N. (1994). Employee Participation Programs, Group-based Incentives, and
Com-pany Performance: A Union-nonunion Comparison. Industrial and Labor Relations Review,
47(4):594–609.
Garicano, L. (2000). Hierarchies and the Organization of Knowledge in Production. Journal of
Political Economy, 108(5):874–904.
Garicano, L. and Rossi-Hansberg, E. (2006). Organization and Inequality in a Knowledge
Econ-omy. The Quarterly Journal of Economics, 121(4):1383–1435.
Geanakoplos, J. and Milgrom, P. (1991). A Theory of Hierarchies Based on Limited Managerial
Attention. Journal of the Japanese and International Economies, 5(3):205–225.
Greenan, N. and Guellec, D. (1994). Coordination within the Firm and Endogenous Growth.
Industrial and Corporate Change, 3(1):173–197.
Guadalupe, M. and Wulf, J. (2010). The Flattening Firm and Product Market Competition: The
Effect of Trade Liberalization on Corporate Hierarchies. American Economic Journal: Applied
Economics, 2(4):105–27.
Hart, O. and Moore, J. (2005). On the Design of Hierarchies: Coordination versus Specialization.
Journal of Political Economy, 113(4):675–702.
Hellerstein, J. K., Neumark, D., and Troske, K. R. (1999). Wages, Productivity, and Worker
Characteristics: Evidence from Plant-level Production Functions and Wage Equations.Journal
of Labor Economics, 3(17):409–446.
Ichniowski, C. (1990). Human Resource Management Systems and the Performance of U.S.
Manufacturing Businesses. Working Paper 3449, National Bureau of Economic Research.
Ilmakunnas, P. and Maliranta, M. (2005). Technology, Labour Characteristics and
Wage-Productivity Gaps. Oxford Bulletin of Economics and Statistics, 5(67):623 – 645.
Iranzo, S., Schivardi, F., and Tosetti, E. (2008). Skill Dispersion and Firm Productivity: An
Analysis with Employer-employee Matched Data. Journal of Labor Economics, 2(26):247–285.
Kastl, J., Martimort, D., and Piccolo, S. (2013). Delegation, Ownership Concentration and R&D
Keren, M. and Levhari, D. (1979). The Optimum Span of Control in a Pure Hierarchy.
Manage-ment Science, 25(11):1162–1172.
Keren, M. and Levhari, D. (1983). The Internal Organization of the Firm and the Shape of
Average Costs. The Bell Journal of Economics, 14(2):474–486.
Keren, M. and Levhari, D. (1989). Decentralization, Aggregation, Control Loss and Costs in a
Hierarchical Model of the Firm. Journal of Economic Behavior, 11(2):213 – 236.
Laffont, J.-J. and Martimort, D. (1998). Collusion and Delegation. The RAND Journal of
Economics, 29(2):280–305.
Marin, D. and Verdier, T. (2003). Globalization and the New Enterprise. Journal of the European
Economic Association, 1(2-3):337–344.
Osterman, P. (1994). How Common is Workplace Transformation and Who Adopts It? Industrial
and Labor Relations Review, 47(2):173–188.
Osterman, P. (2006). Wage Effects of High Performance Work Organization in Manufacturing.
Industrial and Labor Relations Review, 59(2):187–204.
Poitevin, M. (2000). Can the Theory of Incentives Explain Decentralization? Canadian Journal
of Economics, 33(4):878–906.
Radner, R. (1993). The Organization of Decentralized Information Processing. Econometrica,
61(5):1109–1146.
Van Zandt, T. (1999). Real-Time Decentralized Information Processing as a Model of
Organiza-tions with Boundedly Rational Agents. The Review of Economic Studies, 66(3):633–658.
Wait, A. and Meagher, K. (2008). Big Decisions and Little Fish: Theory and Evidence on
Table 1.6: Results of Ordered Probit Model (Marginal Effects): Task Planning Decisions.
Centralization Partial Deleg. Decentralization
P[Dec= 1] P[Dec= 2] P[Dec= 3]
Firm Size -0.049 0.046 0.003
(0.061) (0.058) (0.004)
Internal Networks -0.037 0.035 0.002
(0.088) (0.083) (0.005)
Workcenters -0.012** 0.011** 0.001
(0.005) (0.005) (0.000)
Firm age -0.019 0.018 0.001
(0.067) (0.064) (0.004)
Years of schooling -0.032 0.031 0.002
(0.021) (0.020) (0.001)
Years of schooling (Std. dev) 0.166*** -0.157*** -0.009*
(0.047) (0.045) (0.005)
Seniority -0.007 0.007 0.000
(0.009) (0.009) (0.000)
Seniority (Std. dev) -0.007 0.007 0.000
(0.013) (0.012) (0.001)
Basic workers incentives -0.023 0.022 0.001
(0.024) (0.022) (0.001)
Supervisor incentives -0.014 0.014 0.001
(0.009) (0.008) (0.001)
Intensity of competition 0.127** -0.120** -0.007*
(0.057) (0.055) (0.004)
Export intensity -0.056 0.053 0.003
(0.049) (0.046) (0.003)
Family firm 0.012 -0.011 -0.001
(0.089) (0.084) (0.005)
Ratio of men to women -0.092 0.087 0.005
(0.109) (0.103) (0.007)
Foreign 0.243 -0.230 -0.013
(0.229) (0.217) (0.014)
PST -0.149* 0.139* 0.010
(0.078) (0.073) (0.007)
Provinces dummies Yes Yes Yes
Sector dummies Yes Yes Yes
Sample size 236 236 236
Log Likelihood -157.35 -157.35 -157.35
Pseudo-R2 0.14 0.14 0.14
Table 1.7: Results of Ordered Probit Model (Marginal Effects): Labor Decisions.
Centralization Partial Deleg. Decentralization
P[Dec= 1] P[Dec= 2] P[Dec= 3]
Firm Size 0.057 -0.043 -0.013
(0.039) (0.031) (0.009)
Internal Networks 0.086 -0.064 -0.022
(0.062) (0.044) (0.019)
Workcenters -0.003 0.002 0.001
(0.002) (0.002) (0.001)
Firm age -0.010 0.008 0.002
(0.037) (0.028) (0.009)
Years of schooling -0.003 0.002 0.001
(0.011) (0.009) (0.003)
Years of schooling (Std. dev) 0.085*** -0.065*** -0.020**
(0.029) (0.023) (0.008)
Seniority -0.000 0.000 0.000
(0.006) (0.005) (0.002)
Seniority (Std. dev) -0.003 0.002 0.001
(0.008) (0.006) (0.002)
Basic workers incentives -0.000 0.000 0.000
(0.013) (0.010) (0.003)
Supervisor incentives 0.004 -0.003 -0.001
(0.006) (0.005) (0.001)
Intensity of competition 0.008 -0.006 -0.002
(0.036) (0.028) (0.009)
Export intensity -0.106*** 0.081*** 0.025***
(0.031) (0.025) (0.009)
Family firm -0.028 0.022 0.007
(0.058) (0.045) (0.013)
Ratio of men to women -0.019 0.015 0.005
(0.056) (0.043) (0.013)
Foreign -0.039 0.030 0.009
(0.095) (0.073) (0.022)
PST -0.093* 0.069* 0.024*
(0.051) (0.038) (0.014)
Provinces dummies Yes Yes Yes
Sector dummies Yes Yes Yes
Sample size 350 350 350
Log Likelihood -195.91 -195.91 -195.91
Pseudo-R2 0.09 0.09 0.09