DOCTORAL THESIS
Gender differences in the
association between disability
and mortality in the elderly
Rosa Lamarca Casado
Health and Life Sciences Faculty Pompeu Fabra University
Gender differences in the association
between disability and mortality in the
elderly
Dissertation presented by Rosa Lamarca Casado in order to obtain the title of doctor by
the Pompeu Fabra University
Doctoral thesis done under the supervision of Dr. Jordi Alonso i Caballero of the Health Services Research Unit at the
Institut Municipal d'Investigació Mèdica (IMIM), acting as a tutor Dr. Jodi Sunyer i Déu of the Respiratory and
Environmental Health Research (IMIM)
Doctoral Programme in Health and Life Sciences Department of Experimental and Health Sciences
Pompeu Fabra University (2001-2003)
To Ricard whose unconditional support and motivation was essential in making a dream a reality. He gave me the strength to overcome all the external difficulties that arose along the way.
TABLE OF CONTENTS
PREFACE... 3
ACKNOWLEDGEMENTS... 7
TABLES AND FIGURES INDEX... 9
TABLES... 9
FIGURES... 9
SUMMARY ... 11
1. INTRODUCTION ... 17
1.1. POPULATION AGEING... 17
1.1.1. Demographic transition ... 17
1.1.2. Theories about the population health status changes due to ageing... 24
1.1.2.1. Compression of morbidity ... 25
1.1.2.2. Expansion of morbidity ... 27
1.1.2.3. Dynamic equilibrium ... 27
1.1.2.4. General theory of population ageing ... 28
1.1.2.5. Current situation ... 28
1.1.3. Implications on health, social and economical systems ... 31
1.2. DISABILITY... 35
1.2.1. Conceptual framework ... 35
1.2.2. Measures of disability ... 44
1.2.3. Evolution of disability ... 46
1.2.4. Risk factors of disability ... 47
1.2.5. Gender differences ... 50
2. JUSTIFICATION ... 57
3. OBJECTIVES ... 61
4. METHODS ... 65
4.1. STUDY DESIGN... 65
4.1.1. Disability ... 68
4.2. DATA COLLECTION... 69
4.3. STATISTICAL METHODS... 70
4.3.1. Multiple Correspondence Analysis ... 70
4.3.2. Survival analysis ... 71
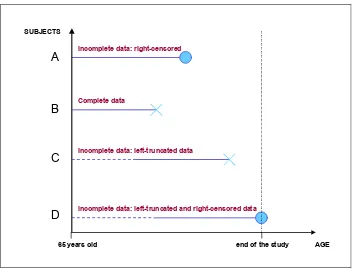
4.3.2.1. Left-truncated data... 71
4.3.2.2. Counting processes in the survival analysis framework ... 74
4.3.2.2.1. The Nelson-Aalen estimator of the cumulative hazard function... 74
4.3.2.2.2. The Cox’s proportional hazards model... 77
5. RESULTS ... 83
5.1.1. Baseline data ... 83
5.1.2. Follow-up data ... 87
5.2. EMPIRICAL VALIDITY OF THE DISABILITY INDICATORS... 90
5.3. THESIS PAPERS... 95
PAPER 1: Left-truncated data with age as the time-scale: an alternative for survival analysis in the elderly population... 96
PAPER 2: Changing relationship between disability and survival among the elderly at different ages. ... 105
5.4. SUPPORT PAPERS... 119
PAPER S1: Smoking after 65 years of age and mortality in Barcelona-city... 120
PAPER S2: Comparison of performance-based and self-rated functional capacity in Spanish elderly... 127
PAPER S3: Evolution of self-rated health status in the elderly: cross-sectional vs. longitudinal estimates. ... 136
6. DISCUSSION ... 147
6.1. CONTRIBUTIONS... 148
6.1.1. Evolution of disability and changes in the relationship between disability and mortality as elderly people age... 148
6.1.2. Differences between women and men... 149
6.1.3. Relationship between mortality and other factors... 151
6.1.4. Methodological issues ... 153
6.2. LIMITATIONS... 155
6.3. IMPLICATIONS... 158
7. CONCLUSIONS ... 163
8. BIBLIOGRAPHY ... 167
PREFACE
This thesis is presented as a set of original research articles published in scientific journals, according to the current regulations on doctoral theses at the Department of Experimental and Health Sciences of the Universitat Pompeu Fabra approved in June 2001.
The thesis is mainly aimed at assessing whether or not there are gender differences in the relationship between disability and mortality. In doing so the methodological aspects of the survival analysis in ageing research have turned into a key role. Therefore, it has been considered more appropriate to classify the research articles as ‘thesis papers’ or ‘support papers’. The first ones are the core papers focussing on the association between mortality and disability by gender in which the leading author is the doctoral candidate; the latter ones correspond to those research papers whose findings give an answer to some relevant issues, that emerged at some stage in the development of this work and mainly contributed to the elaboration of the second thesis paper. For that reason, the thesis is mostly focused on the two core papers.
chapter 5, the study sample is described by means of baseline and follow-up characteristics with the purpose of giving the necessary background to the reader to be able to set findings of the thesis. A summary of the results derived from the validity analysis of the disability measure is also provided in this chapter. Furthermore, it includes the thesis and support papers together with a brief description of the main results of the thesis papers. In chapter 6, the relevant findings of the research are presented and discussed in light of the current knowledge. In chapter 7, the conclusions of this research are listed. Bibliographic notes and comments are given as footnotes to facilitate the reading, nevertheless all references are listed alphabetically in chapter 8. The principal concepts of the counting process, an approach that has substantial impact on the survival analysis methodology, are presented in the Appendix.
Funding and support
The first and second waves of the cohort were funded by grants from the Spanish Fondo de Investigación Sanitaria (FIS, Expte.:89/0450 and 91/0629).
The graduand as doctor was supported by a grant from Institut Municipal d’Investigació Mèdica and from Instituto de Salud Carlos III (Expte.:97/4364).
Mortality data of the cohort were provided by the Regional Mortality Register of the Generalitat de Catalunya.
Mortality rates of Barcelona population stratified by gender and age were provided by the Institut Municipal de la Salut de Barcelona.
Presentations
Part of this thesis was presented at 5th Spanish Conference of Biometry (Valencia 1995), XIV Meeting of the Spanish Society of Epidemiology (Zaragoza 1996), and the 52nd Annual Scientific Meeting of the Gerontological Society of America (San Francisco 1999).
Prizes
ACKNOWLEDGEMENTS
TABLES AND FIGURES INDEX
Tables
Table 1: Evolution of life expectancy in Catalonia and Spain (1992-2002)... 23
Table 2: ICF definitions in the context of health. ... 42
Table 3: ICF overview. ... 43
Table 4: The disablement model and the International Classification of Functioning, Disability and Health model (ICF)... 44
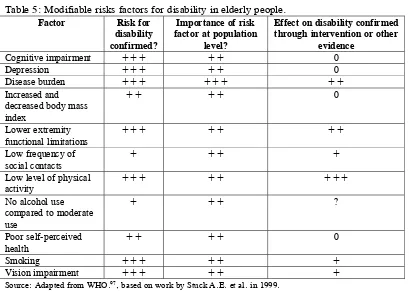
Table 5: Modifiable risks factors for disability in elderly people... 50
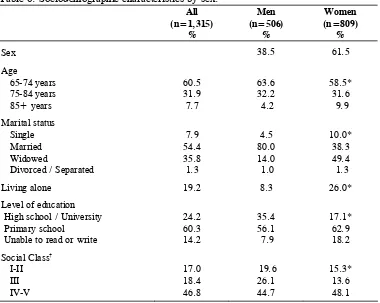
Table 6: Sociodemographic characteristics by sex... 84
Table 7: Health services use and health behaviours by sex... 85
Table 8: Prevalence of the ten leading chronic conditions among participants by sex... 87
Table 9: Baseline characteristics according to vital status in 1994, by gender. ... 88
Table 10: Baseline characteristics according to vital status in 1994, by gender. ... 89
Table 11: Disability status at baseline according to vital status in 1994, by gender. ... 90
Table 12: Distribution of the activities of daily living (ADLs) at baseline stratified by sex... 93
Table 13: Semi-parametric Cox model stratified by gender for both time-on study and age as time scales... 97
Table 14: Semi-parametric Cox model for both men and women... 106
Figures Figure 1: Age pyramids for early, intermediate and late phases of the demographic transition.18 Figure 2: Life expectancy by time period. Females. ... 21
Figure 3: Life expectancy by time period. Males... 22
Figure 4: Life expectancy at 65 years old by gender and time period... 23
Figure 5: People aged over 65 years old as the percentage of the total population of Catalonia. ... 24
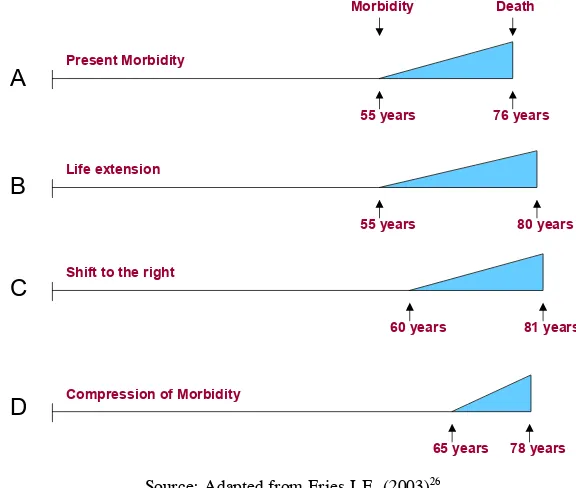
Figure 6: Current status and three possible scenarios for future morbidity and mortality... 26
Figure 7: Nagi’s disability model (1965)... 37
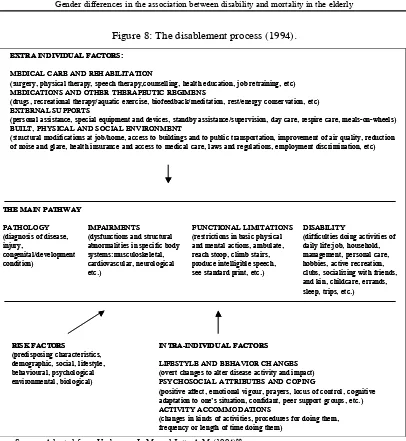
Figure 8: The disablement process (1994). ... 38
Figure 9: The International Classification of Impairments, Disabilities and Handicaps model (ICIDH), (1980)... 39
Figure 10: The International Classification of Functioning, Disability and Health model (ICF), (2001). ... 41
Figure 11: Participation into the survey (waves 1 and 2). ... 69
Figure 12: Left-truncated data... 72
Figure 13: Distribution of age at entry into the study. ... 73
Figure 14: Self-reported health status by sex. ... 86
Figure 15: Distribution of the number of chronic conditions by sex. ... 86
Figure 16:Group at risk: Men………..90
Figure 17:Group at risk: Women ………..90
Figure 18: Hierarchical pattern of the activities of daily living: Multiple Correspondence Analysis. ... 94
Figure 19: Relative risk of dying by disability status for Men... 107
SUMMARY
BACKGROUND
It is estimated that the spectacular growth of the elderly population will lead to an increase in the number of old people with disabilities. This will result in an important economic burden, since disability increases the risk for need of home help, hospitalisation, nursing home admission and premature death. Despite the fact that women experience a higher burden of morbidity and disability, men die earlier; the reasons for such premature mortality are not entirely explained.
OBJECTIVES
This thesis evaluated the existence of gender differences in the relationship between disability and mortality by using the disability life history and taking into account other risk factors. To this end, the evolution of disability prevalence over 8 years was assessed in a sample of non-institutionalised elderly. Also, the use of age as time scale in the survival analyses for elderly studies was examined.
METHODS
analysis with delayed entry was formulated in the counting process framework to study time from aged 65 years to death or exit from the study. The semi-parametric Cox model with age as time scale and disability as time-dependent variable was applied to mortality data by sex.
RESULTS
The proportion of subjects who were dependent or who had difficulties was higher among women than men both at baseline (42% vs. 30%, respectively) and at follow-up (60.0% vs. 48.7%, respectively). Disability status showed a dynamic pattern over time, being the group of elderly people with difficulties at baseline the most variable (only 20.0% among men and 30.2% among women remained in the same disability category group after eight years of follow-up, among those with follow-up information). Also, a subset of those who had some degree of disability (‘difficulty’ or ‘dependency’) at baseline improved their disability status (26.6 % for men, and 26.9% for women). The risk of mortality associated with disability varied with gender and age. The adjusted relative risk of dying for those with basic ADLs dependency ranged from 3.5 for women and 1.8 at age 80 for men, to 1.9 and 1.2, respectively, at age 90. Also, multivariate analyses showed that a low body mass index (RR= 2.2), and either former or current smoking (RR= 1.6 and 2.4, respectively) were independently associated with mortality among elderly men.
where it is necessary to carry out several figures and join the different pieces of the survival curves implementing an additional method. It was possible to estimate more percentiles of the survival time, such as the second and third quartiles for those subjects not disabled (16.9 and 22.5, respectively) that couldn’t be obtained with the time-on-study scale. It also overcame the confusing role of age since a substantial number of risk factors correlate with age. The statistical models were more parsimonious since they avoided the inclusion of interaction terms (i.e., age*time-on-study) due to the inherent assumption of linearity between the independent variables and the outcome in the semi-parametric Cox model. Although the results derived from both approaches were similar in the multivariate context, the estimates were slightly attenuated in the analysis of age as time scale, RR= 1.84 vs. 1.77 for males and RR= 2.10 vs. 1.92 for females. This attenuation is most likely due to the fact that adjustment by age was more tight using age as time scale.
CONCLUSIONS
In 8 years disability in the elderly evolves over time worsening with age, but a non-negligible proportion of subjects are able to recover. There are gender differences in the evolution of disability: women are less able to regain functional capacity once they become disabled.
mainly attributed to cancers, heart and respiratory diseases. However, the association between low weight and mortality is less consistent, on the one hand it is likely to be a symptom of underlying diseases such as cancer or a poor nutritional status, and on the other, it may reflect individuals who are physically less active.
Health and social care policies focusing on disabled women should be implemented, due to the higher proportion of disabled women than disabled men, the lower probability of regaining functional capacity, and their higher risk of dying compared to disabled men.
Age should be considered the natural time-scale for the survival analysis in the elderly population. In doing so, the interpretation of the results is more straightforward because the estimates get rid of the confounding effect of age, the survival plots are then meaningful, and the risk factors are considered at the age time that they were measured. Moreover, the available information of the subjects is handled in a more efficient way allowing us to estimate more percentiles. Also, the multivariate models are simpler because the proportional hazards assumption of the semi-parametric Cox’s model does not hold for those risk factors whose exposition tend to decrease with age, which are not rare in the elderly population.
CHAPTER 1
1. Introduction
1.1. Population ageing
1.1.1. Demographic transition
World population is growing as a consequence of several factors such as improvements in nutrition, in public health and hygiene, technology and medical advances that yield a reduction of both mortality and fertility rates. This phenomenon is known as the ‘Demographic transition’, the transition from a society with high mortality and fertility rates to a society with increasing longevity due to low mortality and fertility rates. At the beginning of this process, a decline in the infant and childhood mortality rate is observed and later on the fertility rate drops1. As a consequence, the population besides
growing also ages and life expectancy increases.
Population age structure depends mainly on three factors: fertility, mortality and net migration levels. With the purpose of simplifying the description of demographic transition the latter will be omitted2. As is shown in Figure 1, a
population can be in one of three demographic phases3: a) early: where the age
structure follows a pyramid pattern, the weight of each age stratum of the
1 Although there are a few exceptions in the reverse order, where the fertility declined first and
then the mortality rate as the United States and France.
2 The effect of the migration levels on the population age structure is not well established. R.
Lee (2003) defined it as modest because the immigrants also get old and tend their fertility rates to the ones of the receptor country. The United Nations is in agreement with this argument unless the migration flows would be very large, i.e., millions anually.
3 Other authors as R.P. Cincotta, R. Engelman and D. Anastasion (2003) describe the
population being smaller than the subsequent one, overall a rapid population growth characterise this phase, b) intermediate: where the middle-age stratum groups have the largest weight on population and a slight asymmetry between men and women is observed in the age pyramid, and c) late: where a rectangular shape is observed, except in the oldest and youngest age stratums, with an increase in the proportion of elderly population4, with women showing
the largest survival rates. It leads to population ageing and a possible population reduction.
Figure 1: Age pyramids for early, intermediate and late phases of the demographic transition.
≥85 80 – 84 75 – 79 70 – 74 65 – 69 60 – 64 55 – 59 50 – 54 45 – 49 40 – 44 35 – 39 30 – 34 25 – 29 20 – 24 15 – 19 10 – 14 5 – 9 0 – 4
≥85 80 – 84 75 – 79 70 – 74 65 – 69 60 – 64 55 – 59 50 – 54 45 – 49 40 – 44 35 – 39 30 – 34 25 – 29 20 – 24 15 – 19 10 – 14 5 – 9 0 – 4
≥85 80 – 84 75 – 79 70 – 74 65 – 69 60 – 64 55 – 59 50 – 54 45 – 49 40 – 44 35 – 39 30 – 34 25 – 29 20 – 24 15 – 19 10 – 14 5 – 9 0 – 4
Males Females Males Females Males Females
EARLY INTERMEDIATE LATE
However, there are marked differences in how far countries have progressed all along the demographic transition. While the transition began in Europe in 1800 and expanded around the world5, in most Asian, Caribbean and Latin American
countries the infant and childhood mortality rate did not decrease until the early to mid 20th century. Industrialized countries, the ones in a late phase, are
experiencing further reductions in mortality rates as a result of a decrease in fatality rates of some illnesses such as cancer and heart disease and
4 Elderly population is defined as those subjects aged 65 years old or over.
5 Lee R. The demographic transition: three centuries of fundamental change. Journal of
improvements in living conditions6. In contrast, the countries with more delay
in the transition are experiencing a more rapid decline in mortality than was observed in industrialized countries before, although not without difficulties. Indeed, the mortality trend has been modified by the HIV/AIDS epidemic in some countries, especially those belonging to sub-Saharan Africa7.
The fertility rate started to decrease in Europe in the first decade of the 20th
century and in most Asian, Caribbean and Latin American countries this decrease took place in the 1960s and 1970s8. In 2000, the fertility rate was
below the replacement rate (2.1 children per woman) in the majority of industrialized countries, and in some Asiatic countries other than Japan (Singapore 1.2, South Korea 1.7, China 1.8, Thailand 1.9 and Sri Lanka 2.0)9.
The behaviour of mortality and fertility rates is leading the world population to an unprecedented ageing process. Among the 25 countries10 with the largest
proportion of elderly population in 2000, only one does not belong to Europe (Japan). The list is headed by Italy (18.1%) while Spain is in 5th position
(16.9%), and the United States is not included due to its moderate proportion (13%) compared to most industrialized countries.
6 Riley J.C. Rising life expectancy: a global history. Cambridge;Cambridge University Press:
New York, 2001. Quoted in page 171 of Lee R. The demographic transition: three centuries of fundamental change. Journal of Economic Perspectives 2003;17:167-90.
7 Cincotta R.P., Engelman R. and Anastasion D. The Security Demographic. In: Population
and civil conflict after the cold war. Population Action International: Washington, 2003: pp. 24-41.
8 Cincotta R.P., Engelman R. and Anastasion D. The Security Demographic. Population and
civil conflict after the cold war. In: Population Action International: Washington, 2003: pp. 24-41.
9 Kinsella K. and Velkoff V.A. U.S. Census Bureau, Series P95/01-1, An Aging World:
2001, U.S. Government Printing Office, Washington, DC, 2001.
Among the elderly population, the eldest (≥80 years) are the fastest growing of all population groups. In 2000, more than half of them lived in China, the United States, India, Japan, Germany and Russia11.It has been estimated that, in
general, the number of elderly people aged from 90 to 99 years will rise from the current 8 million to 60 million by 2050, whereas the number of centenarians will increase from 190,000 to 2.5 million12. It is worth mentioning that although
industrialized countries have the highest proportion of elderly population; around sixty percent of the world’s elderly lived in developing countries in 2000. It is precisely in these countries where there are more room to grow, projections describe an increase in the elderly population of up to seventy one percent by 203013.
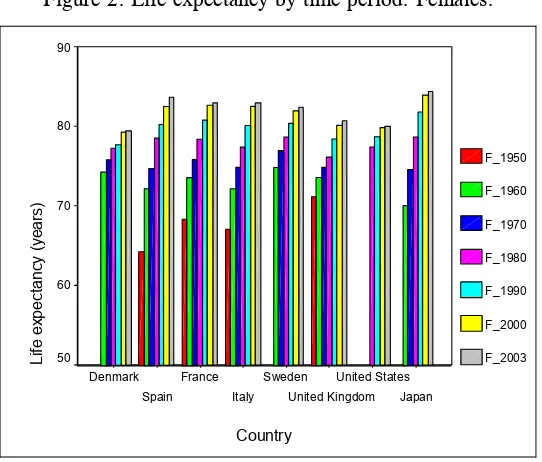
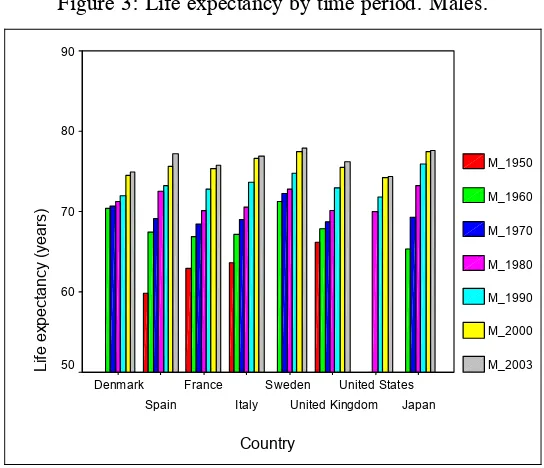
The effects of the demographic change described above can be illustrated in the trend of life expectancy at birth and at the age of 65 in six European countries (Denmark, France, Italy, Spain, Sweden and United Kingdom) using data from Eurostat14 and comparing them with those from the United States and Japan.
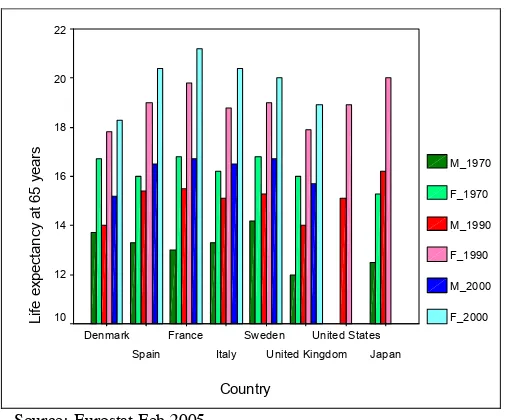
Continuing gains in life expectancy at birth have been experienced in both females and males from 1950 to the present, see Figures 2 and 3. A sustained sex differential in life expectancy at birth is observed along time in the 4.7-7.4 year range in 2000. Also, a rise in life expectancy at age 65 is observed in both sexes, see Figure 4. An average gap of around 3 years between the sexes in
11 Kinsella K. and Velkoff V.A. U.S. Census Bureau, Series P95/01-1, An Aging World:
2001, U.S. Government Printing Office, Washington, DC, 2001.
12 Kalache A., Aboderin I. and Hoskins I. Compression of morbidity and active aging: key
priorities for public health policy in the 21st century. Bull World Health Organ 2002;80:243-4.
13Kinsella K. and Velkoff V.A. U.S. Census Bureau, Series P95/01-1, An Aging World:
2001, U.S. Government Printing Office, Washington, DC, 2001.
favour of females is observed in 2000 with the exception of France that increased up to 4.5 years. This pattern of life expectancy is consistent with the observed low rates of infant and children mortality, since it implies that the decline in mortality can only come from a reduction of the mortality in the eldest group.
Figure 2: Life expectancy by time period. Females.
Country
Japan United States United Kingdom Sweden
Italy France Spain Denmark
Life ex
pec
tanc
y (y
ears
)
90
80
70
60
50
F_1950
F_1960
F_1970
F_1980
F_1990
F_2000
F_2003
Source: Eurostat Feb 2005.
Figure 3: Life expectancy by time period. Males.
Country
Japan United States United Kingdom Sweden
Italy France Spain Denmark
Lif
e expect
ancy (years)
90
80
70
60
50
M_1950
M_1960
M_1970
M_1980
M_1990
M_2000
M_2003
Source: Eurostat Feb 2005.
In Spain, life expectancy increased by 26.6 and 28.3 percent, respectively, in males and females. That is, from 59.8 to 75.7 years in males and from 64.3 to 82.5 years in females between 1950 and 2000. In addition, the average number of years remaining at 65 years also augmented by 39.8 and 51.1 percent in males and females, respectively, between 1950 and 2000. In the same time period, the former European Union (EU) compounded by 15 countries experienced an increase from 67.4 to 75.5 years (12.0%) in males and from 72.9 to 81.4 years in females (11.7%). These figures15 decrease slightly with
Figure 4: Life expectancy at 65 years old by gender and time period. Country Japan United States United Kingdom Sweden Italy France Spain Denmark Lif e ex pec tanc y at 65 y ears 22 20 18 16 14 12 10 M_1970 F_1970 M_1990 F_1990 M_2000 F_2000
Source: Eurostat Feb 2005.
[image:29.595.179.432.128.338.2]Data from the ‘Institut d’Estadística de Catalunya’ show how life expectancy has also increased in Catalonia by around 2 years in the decade from 1992 to 2002 in both sexes, being similar to the pattern in Spain according to data from the ‘Instituto Nacional de Estadística’ (see Table 1).
Table 1: Evolution of life expectancy in Catalonia and Spain (1992-2002).
1992 1995 2000 2002 Males Females Males Females Males Females Males Females
Catalonia1 74.0 81.4 74.8 82.2 76.5 83.2 76.9 83.4
Spain2 73.8 81.1 74.4 81.6 75.7 82.5 75.7 83.1
1 Departament de Salut de la Generalitat de Catalunya. 2 Instituto Nacional de Estadística.
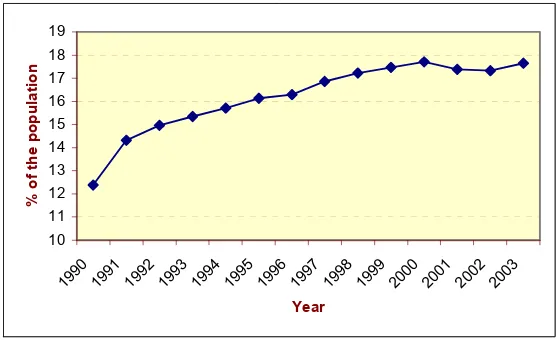
In addition, the number of people over 65 years old has also grown. The elderly accounted for 12.4% of the overall Catalan population in 1990, but this figure increased steadily until 2000 where it seemed to level off at around 17.7% from 2000-2003 (see Figure 5). This change in the age structure of the Catalan population is reflected in the increasing average age of the whole population
from 34.2 years in 1981 to 40.8 years in 2002, as well as the ageing index16
[image:30.595.151.430.201.371.2]from 44.0% in 1981 to 123.7% in 2002.
Figure 5: People aged over 65 years old as the percentage of the total population of Catalonia.
10 11 12 13 14 15 16 17 18 19
1990 1991 1992 1993 1994 1995 1996 1997 1998 1999 2000 2001 2002 2003
Year
% of
t
he popul
at
ion
Source: Institut d’Estadística de Catalunya.
Estructura en grans grups d’edat de la població.
1.1.2. Theories about the population health status changes due to ageing
There is controversy about whether population ageing will imply a change in overall health status. In the following sections, the principal theories about population health change are presented. However, to understand the health changes in the elderly population, it is important to note that there are normal age-related changes in the organism, which are being approached by the Theories of Ageing (genetic17, cellular18, problems in homeostasis19, and ‘wear
and tear’20 theories, among others) and are out of the scope of this thesis.
16 Individuals aged 65 years or over per 100 individuals younger than 15 years old.
17 Among other genetic theories, it has been argued that the number of times that a cell can
replicate without error is limited and there may be a relationship between the number of cell replications and lifespan. Hayflick L. How and why we age. Ballantine Books. New York. 1996.
18 The free radical theory is one of the leading cellular theories. The free radicals are produced
In general, it must be considered that human ageing is a process that involves biological changes that occur with age (e.g., decline in cellular activity). An additional aspect that should be highlighted is the existence of a high variability between elderly people: some individuals are disabled in their 70’s, while others are able to run marathons at the same age.
1.1.2.1. Compression of morbidity
When presenting his Compression of Morbidity theory in 1980, J.M. Fries postulated that, at the population level, the disability state will be compressed in a shorter period in the later stages of life21,22,23,24. That is, an increase in life
expectancy will be associated with a diminution of disability. The theory is based on the following assumptions25: a) the increase in life expectancy will be
smaller than the postponed onset of disability, b) the capacity to postpone or avoid disability by preventive activities, and c) the increase in survival as a result of removing life-threatening conditions will not counterbalance the gains
age as more free radicals are generated in the cell. Sohal S.S. and Weindruch R. Oxidative stress, caloric restriction, and aging. Science 1996;273:63-7.
19 The homeostatis maintains intra and extracellular environmental conditions, such as
temperature, pH balance, and heart rate, among others. There is evidence that it is more difficult to sustain homeostatis as people age. Taffett G.E. Age-related physiologic changes. In: Reuben D.B., Yoshikawa T.T. and Besdine R.W. (eds.). Geriatrics review syllabus. Kendall/Hunt. Dubuke. 1996.
20 The theory proposes that the organism wears out after extended use.
21 Fries J.F. Aging, natural death, and the compression of morbidity. N Engl J Med
1980;303:130-5.
22 Fries J.F. The compression of morbidity. Milbank Mem Fund Q Health Soc
1983;61:397-419.
23 Fries J.F. Compression of morbidity in the elderly. Vaccine 2000;18:1584-9.
24 Fries J.F. Measuring and monitoring success in compressing morbidity. Ann Intern Med
2003;139:455-9.
25 Kane R.L., Evans J.G. and Macfadyen D. Improving the health of older people. A world
achieved by this elimination. As shown in the scenario D of Figure 6, Compression of Morbidity will imply a deferred onset of morbidity from 55 to 65 years in the illustration, while longevity will increase from 76 to 78 years. Thus, the gain in the postponement of morbidity is larger than the gain in life expectancy, yielding as a result a compression of the period of time with morbidity.
[image:32.595.143.431.377.621.2]The policy implication of this rather optimistic theory is that health resources should be shifted to the later stages of life and for a shorter period of time.
Figure 6: Current status and three possible scenarios for future morbidity and mortality.
55 years 76 years
Morbidity Death
55 years 80 years
60 years 81 years
65 years 78 years Present Morbidity
Life extension
Shift to the right
Compression of Morbidity A
B
C
D
Source: Adapted from Fries J.F. (2003)26.
26 Fries J.F. Measuring and monitoring success in compressing morbidity. Ann Intern Med
1.1.2.2. Expansion of morbidity
E.M. Gruenberg (1977)27 and M. Kramer (1980)28 introduced the Expansion of
Morbidity theory also known as the Failure of Success theory. They postulated that the gain in years lived as a result of the increase in life expectancy, would be spent in a poorer health condition because the life being extended is that of individuals with disease and disability. As illustrated in the scenario B (Figure 6), if the age at death is postponed (from 76 to 80 years old) but the age of onset of morbidity remains constant (55 years old) then the period of time with morbidity will increase. Under this pessimistic theory, the demand for health resources will rise dramatically due to the expansion for morbidity.
1.1.2.3. Dynamic equilibrium
K.G. Manton (1982)29 proposed a theory that contains elements from both the
compression and expansion theories. In this one, the decrease in mortality rates will come from a reduction in the rate of chronic disease evolution. According to this approach, the number of years lived with disability will increase but the severity of the disability will decrease. Thus, the period of life with severe illnesses or disability will decrease or stabilise, whereas the period with moderate illnesses or disability will increase leading all together to a dynamic equilibrium.
27 Gruenberg E.M. The failures of success. Milbank Mem Fund Q Health Soc 1977;55:3-24. 28 Kramer M. The rising pandemic of mental disorders and associated chronic diseases and
disabilities. Acta Psychiatrica Scandinavica 1980;62:282-97.
29 Manton K.G. Changing concepts of morbidity and mortality in the elderly population.
1.1.2.4. General theory of population ageing
Recently, J.P. Michel and J.M. Robine (2004)30,31 proposed the basis for a new
theory that comprises the ‘Compression of morbidity’, ‘Expansion of morbidity’ and ‘Dynamic equilibrium’ theories in an attempt to explain the current contradictory findings on chronic conditions, disability and functional limitations research taking into account the demographic change.
The theory relies on a cyclical movement: The decline in mortality at old ages in the demographic transition leads to the possibility of sick people surviving into old age supporting the ‘Expansion of morbidity’ because the prevalence of chronic conditions and disability rates increases. Then, medical improvements slow down the evolution of chronic conditions achieving certain equilibrium thus supporting the ‘Dynamic equilibrium’ theory. Afterwards, a new status will follow where new cohorts enter into the elderly process. Given that these people will be healthier due to predominantly better health habits and living conditions, then the ‘Compression of Morbidity’ will apply at this stage. Finally, the emergence of very old populations will imply the need to deal with frail people burdened by multiple chronic diseases in their last years of life. Therefore, the scenario about population ageing will vary depending on the demographic transition phase where the country is positioned.
1.1.2.5. Current situation
Apart from the recent General Theory of Population Ageing still under discussion, to date there is no conclusive evidence about the true health status
30 Robine J.M. and Michel J.P. Looking forward to a general theory on population aging. J
Gerontol Med Sci 2004;59A:M590-M597.
31 Michel J.P. and Robine J.M. A new general theory of population aging. The Geneva papers
change, although the current dominant view is that an initial Compression of morbidity will be followed by a Dynamic Equilibrium in industrialised countries, there is, however, no sign of compression of morbidity in developing countries32.
J.F. Fries stated that some compression of comorbidity has occurred during the last 20 years33 and is being experienced nowadays in the population of the
United States34: the U.S. elderly adult mortality decline is about 1% per year
and the disability decline about 2% per year35. K.G. Manton and
colleagues36,37,38,39 showed a decrease of chronic diseases and disability over
time using data from the National Long Term Surveys (NLTS)40. B.H. Singer
and K.G. Manton estimated that a 1.5% decline in chronic disability per year within the period 1995-2070 would be possible if the correct health polices were applied (appropriate public health programs and increasing biomedical research
32 Kalache A., Aboderin I. and Hoskins I. Compression of morbidity and active aging: key
priorities for public health policy in the 21st century. Bull World Health Organ 2002;80:243-4.
33 Fries J.F. Compression of morbidity in the elderly. Vaccine 2000;18:1584-9.
34 Fries J.F. Measuring and monitoring success in compressing morbidity. Ann Intern Med
2003;139:455-9.
35 Fries J.F. Reducing disability in older age. JAMA 2002;288:3164-6.
36 Manton K.G., Corder L.S. and Stallard E. Estimates of change in chronic disability and
institutional incidence and prevalence rates in the U.S. elderly population from the 1982,1984, and 1989 National Long Term Care Survey. J Gerontol Soc Sci 1993;48:S153-S166.
37 Manton K.G.,Corder L.S. and Stallard E. Chronic disability trends in elderly United States
populations: 1982-1994. Proc Natl Acad Sci USA 1997;94:2593-98.
38 Manton K.G., Stallard E. and Corder L.S. The dynamics of dimensions of age-related
disability 1982 to 1994 in the U.S. elderly population. J Gerontol Bio Sci 1998;53:B59-B70.
39 Manton K.G. and Gu X. Changes in the prevalence of chronic disability in the United States
black and nonblack population above age 65 from 1982 to 1999. Proc Natl Acad Sci USA 2001;98:6354-9.
investments)41. Using data from the National Institute on Ageing Established
Populations for Epidemiological Studies of the Elderly, L.A. Beckett et al.42
showed a decline in physical function (Katz ADL scale, Nagi scale and the Rosow-Breslau Functional scale) that increased with age. V.A. Freedman and L.G. Martin43also observed declines from 1984 to 1993 in the prevalence of
difficulty in four functions (seeing, lifting and carrying, climbing and walking) among participants in the U.S. Bureau of the Census’s Survey of Income and Program Participation. Recently, V.A. Freedman, L.G. Martin and R.F. Shoeni (2002)44 conducted a systematic review of studies about self-reported disability
and functioning among older adults in the United States that were performed in the late 1980s and early 1990s. The authors concluded, based on 8 studies, that there was a decrease in the prevalence of any disability during the 1990s. However, contradictory results were available about the trend in Activities of Daily Living (BADLs) in contraposition to the clear decline pattern observed in the Instrumental Activities of Daily Living (IADLs)45.
Nevertheless, the postponement of morbidity could be larger if health policies focus on diminishing/eliminating unhealthy behavioural factors, such as smoking, sedentary lifestyle, and diet (specially saturated fat) since they are among the major contributors to chronic diseases. Findings from the University
41 Singer B.H. and Manton K.G.The effects of health changes on projections of health service
needs for the elderly population of the United States. Proc Natl Acad Sci USA 1998;95:15618-22.
42 Beckett L.A., Brock D.B., Lemke J.H., Mendes de Leon C.F., Guralnik J.M., Fillenbaum
G.G., Branch L.G., Wetle T.T. and Evans D.A. Analysis of change in self-reported physical function among older persons in four population studies. Am J Epidemiol 1996;143:766-78.
43 Freedman V.A. and Martin L.G. Understanding trends in functional limitations among older
Americans. Am J Public Health 1998;88:1457-62.
44 Freedman V.A., Martin L.G. and Shoeni R.F. Recent trends in disability and functioning
among older adults in the United States. A systematic review. JAMA 2002;288:3137-46.
of Pennsylvania Study46 and the Precursors of Arthritis Study47 support this fact
by showing that subjects with healthier habits were associated with lower rates of disability and that the onset of disability emerged at an older age.
A widespread implementation of the use of health expectancy indicators48, that
combine information from current health status (quality) and remaining life (quantity), will help monitor the evolution of population health and clarify whether or not the aforementioned theories are correct.
1.1.3. Implications on health, social and economical systems
Increased longevity can be considered a success and a sign of progress. However, this demographic change has an impact on public expenditure, particularly health care systems and social (pension) care costs: those increased costs are more importantly due to the change in the age structure of the population than the population growth itself. There are two major issues: the population of working age has shrunk and the elderly population has grown. Those societies with a large proportion of elderly people are likely to devote a high proportion of resources to their care, which may inhibit economic growth since there are not enough individuals in the working age group to support it, challenging the sustainability of welfare states.
Some economists have expressed their concern that the population ageing together with inefficient public policies may jeopardise long-term growth49.
46 Vita A.J., Terry R.B., Hubert H.B. and Fries J.F. Aging, health risks and cumulative
disability. N. Engl J Med 1998;338:1035-41.
47 Fries J.F., Singh G, Morfeld D, Hubert H.B., Lane N.E. and Brown B.W. Running and the
development of disability with age. Ann Intern Med 1994;121:502-9.
48 Among the health expectancy indicators are found the Health-Adjusted Life Expectancy
(HALEs) and Disability-Adjusted Life Expectancy (DALEs).
They point out two reasons to support their position: first, personal savings of the elderly may diminish since people may rely either on the public pension system or on their descendents; provoking both a burden on the working age population directly by means of family transfers or indirectly by means of taxes and secondly, the decrease in productivity in industrialized countries due to reduced labour working years, mainly in the stratum of males aged between 55 and 64 years. In Catalonia, for instance, 8,130 out of the 8,700 million Euros devoted to the ageing population in 2000 (excluding health services) were devoted to pensions. The economic resources used for pensions have doubled in the 1990-2000 period50.
In Europe there are differing approaches to pension regimens, while some countries combine basic social insurance with pay-as-you-go (PAYG) in which people currently working support retired individuals, others prefer privatisation and funding51. The first system fails when successive generations are of
different sizes, whereas the second one may put people from lower socio-economic levels at risk.
A positive discrimination towards women should be evaluated because women live longer and are less likely to have full contribution records in employment. Therefore, they are more likely than men to not receive complete pensions and to be poor at old age. Moreover, if we consider the existing gender inequalities in salary income during the working years, women should be targeted in public policies.
50 Data from the Institut d’Estadística de Catalunya.
Another aspect to be considered is the growing contribution of women in the labour force that has changed traditional values, which ensured that ‘women will cope with the care of elderly’. In addition, fertility rates have dropped and family size has diminished; therefore the number of potential informal carers has also been reduced. In our country, the number of children per woman has dropped from 2.80 in 1975 to 1.27 in 2002 in Spain52 (2.86 in 1975 to 1.33 in
2002 in Catalonia53). As a consequence, the family-based care system needs to
be revised, especially if we consider that family structure has varied in recent decades (due to factors such as the rise in the divorce rates, the number of people living alone, among others). Therefore, social policies need to be updated or transformed to face this situation.
The evolution of health spending will depend on whether or not morbidity will decline in relation with mortality. The gain life expectancy by diminishing mortality rates may also imply an increase in the number of disabled elderly people. Alternatively, the functional status of elderly people may be good, with a resulting gain in healthy years. The chances of increasing the proportion of disabled people were discussed in section 1.1.2. Beyond the disability rate, the fall in the mortality rates may imply that other diseases that may be more costly in terms of care are replacing some diseases. For instance, Alzheimer’s disease may replace heart diseases, as a consequence of the competing mortality behaviour. Those individuals who have not died from a previous disease due to medical improvements are then susceptible to suffer a more demanding (in terms of health care) disease.
In relation to the use of hospital resources, a previous study54 describes that it
was 4.5 times higher in those subjects aged between 65 and 74 years old than in those aged between 5 and 54 years old, and it increased up to 6 times for the age stratum of individuals older than 74 years old in our setting. Concerning drugs expenditure, pensioners consumed 10 times more than the remaining population in our setting55. In 2000, 77.4% and 78.0% of the pharmaceutical
expenses came from pensioners (who may include people below 65 years) in Spain and Catalonia, respectively56.
Some strategies adopted by European policymakers to preserve economic growth are: to accept a larger influx of immigrants, extend the retirement age and incorporate more women into the labour market by trying to make it compatible with their family activities57 (including direct economic incentives
for additional children). In contrast, Japan replaces low-skilled jobs with technology, and out- sources less innovative, labour-intensive industries overseas and increases its investment in research and development58.
54 Casado D. and López G. Vellesa, dependència i atencions de llarga durada. Situació actual i
perspectives de futur, Col·lecció d’estudis socials, num. 6. Fundació La Caixa, 2001, page 12.
55 Casado D. and López G. Vellesa, dependència i atencions de llarga durada. Situació actual i
perspectives de futur, Col·lecció d’estudis socials, num. 6. Fundació La Caixa, 2001, page 12.
56 Abellán A. Longevidad y estado de salud. In: Las personas mayores en España.Informe
2002.Volumen I, Ministerio de Trabajo y Asuntos Sociales, 2002, page 113.
57 Cincotta R.P., Engelman R. and Anastasion D. The Security Demographic. In: Population
and civil conflict after the cold war. Population Action International: Washington, 2003: pp. 24-41.
58 Cincotta R.P., Engelman R. and Anastasion D. The Security Demographic. In: Population
1.2. Disability
1.2.1. Conceptual framework
In order to understand and evaluate disability, it is important to have an understanding of the progression ending with a loss of functionality. Unfortunately, there is no consensus and differing viewpoints of the underlying frameworks of disability exist. Indeed, the magnitude of such confusion is so significant that the same terms may have different meanings depending on the conceptual framework.
The present work is based on the model proposed by L.M. Verbrugge and A.M. Jette59 called the Disablement Process. It is a development of the initial
model conceived by the sociologist S.Z. Nagi60,61,62. Other frameworks to
describe the disability process include the International Classification of Impairments, Disabilities and Handicaps (ICIDH) and its current revision the International Classification of Functioning, Disability and Health (ICF). The three major disability frameworks, as well as the definition of the term disability under each conceptual framework, are discussed below.
Nagi’s model, developed in 1965, attempted to incorporate social and physical environment aspects into the medical perspective of disability. Disability is seen as a gap between a person’s capabilities and the demands of the social and
59 Verbrugge L.M. and Jette A.M. The disablement process. Soc Sci Med 1994;38:1-14. 60 Nagi S.Z. Some conceptual issues in disability and rehabilitation. In:Sussman M.B. (ed).
Sociology and rehabiliation.Washington D.C. American Sociological Association,1965: pp. 110-13.
61 Nagi S.Z. An epidemiology of disability among adults in the United States. Milbank Mem
Fund Q Health Soc 1976;54:439-67.
62 Nagi S.Z. Disability concepts revisited: implications for prevention. In Disability in
physical environment that causes cessation or restriction in performing the activities of daily living. Therefore, disability is not intrinsic to a person but reflects the interaction between the individual and her/his environment. It follows that an individual limitation may lead to different patterns of disability or no-disability at all, depending on how the subject experiences a situation and reacts to it within their environment, and how others (for example relatives and friends,) view such a situation. For instance, a decrease in visual acuity may disable a pilot because he/she will be unable to operate a plane. However, the same impairment may not have any major limitation on a lawyer to perform her/his activities. Further, a distinction between intrinsic and actual disability is made. The first refers to disability when the individual has no access to assistance (personal or equipment) and the second, when such assistance is available.
Nagi’s disability model63 is based on four related concepts that compound the
main pathway: pathology, impairment, functional limitation and disability in performing social roles and activities, see Figure 7. Nagi defined the first three terms as64: a) pathology: the interruption of normal cellular processes and the
efforts of the organism to regain a normal state, b) impairment: anatomical, physiological, intellectual or emotional loss or abnormality at the tissue, organ, and body system level, c) functional limitations: restrictions in the basic physical or cognitive performance of the person.
63 Nagi S.Z. Disability concepts revisited: implications for prevention. In Disability in
Figure 7: Nagi’s disability model (1965).
DISABILITY LIMITATION
FUNCTIONAL IMPAIRMENT
PATHOLOGY⇒ ⇒ ⇒
L.M. Verbrugge and A.M. Jette65 extended Nagi’s model to include a complete
sociomedical perspective taking into account personal and environmental factors that influence the evolution of the disablement process, see Figure 8. The model emphasizes the dynamic aspect of disablement focusing on the process itself that leads to disability, that is, the factors that affect its evolution over time (direction, pace and pattern of change). The extraindividual factors, predisposing risk factors and intraindividual factors may modify the relationship of the four concepts in the main pathway.
64 Jette A.M. and Keysor J.J. Disability models: implications for arthritis exercise and physical
activity interventions. Arthritis Rheum 2003;49:114-20.
Figure 8: The disablement process (1994).
EXTRA INDIVIDUAL FACTORS:
MEDICAL CARE AND REHABILITATION
(surgery, physical therapy, speech therapy,counselling, health education, job retraining, etc) MEDICATIONS AND OTHER THERAPEUTIC REGIMENS
(drugs, recreational therapy/aquatic exercise, biofeedback/meditation, rest/energy conservation, etc) EXTERNAL SUPPORTS
(personal assistance, special equipment and devices, standby assistance/supervision, day care, respire care, meals-on-wheels) BUILT, PHYSICAL AND SOCIAL ENVIRONMENT
(structural modifications at job/home, access to buildings and to public transportation, improvement of air quality, reduction of noise and glare, health insurance and access to medical care, laws and regulations, employment discrimination, etc)
THE MAIN PATHWAY
PATHOLOGY (diagnosis of disease, injury,
congenital/development condition)
IMPAIRMENTS (dysfunctions and structural abnormalities in specific body systems:musculoskeletal, cardiovascular, neurological etc.)
FUNCTIONAL LIMITATIONS (restrictions in basic physical and mental actions, ambulate, reach stoop, climb stairs, produce intelligible speech, see standard print, etc.)
DISABILITY
(difficulties doing activities of daily life:job, household, management, personal care, hobbies, active recreation, clubs, socializing with friends, and kin, childcare, errands, sleep, trips, etc.)
RISK FACTORS
(predisposing characteristics, demographic, social, lifestyle, behavioural, psychological environmental, biological)
IN TRA-INDIVIDU AL FACTORS
LIFESTYLE AND BEHAVIOR CHANGES (overt changes to alter disease activity and impact) PSYCHOSOCIAL ATTRIBUTES AND COPING
(positive affect, emotional vigour, prayers, locus of control, cognitive adaptation to one’s situation, confidant, peer support groups, etc.) ACTIVITY ACCOMMODATIONS
(changes in kinds of activities, procedures for doing them, frequency or length of time doing them)
Source: Adapted from Verbrugge L.M. and Jette A.M.(1994)66.
The ICIDH was aimed at describing the impact of disease/disorder on functioning. It describes a process that starts with an underlying cause, which results in an impairment that may produce disability, and may end in a handicap, see Figure 9.
Figure 9: The International Classification of Impairments, Disabilities and Handicaps model (ICIDH), (1980).
HANDICAPS
ES DISABILITI
S IMPAIRMENT
DISORDER
or DISEASE
⇒ ⇒
⇒
It is not mandatory that a subject will complete the whole pathway, that is, disability does not necessarily evolve into handicap, or impairment into disability; in this sense they are relatively independent concepts. Impairment refers to an organ level, disability to a personal level and handicap to a social level. Impairment is defined as any loss or abnormality of physiological, psychological or anatomical structural or function. Disability is viewed as a restriction in the ability to perform an activity considered as ‘normal’ due to impairment. Handicap is seen as a disadvantage that limits the ‘normal’ role of the individual.
This approach raised some controversies such as: being too medically-oriented, ignoring the social and the psychological dimensions; the negative connotation of the term ‘handicap’; assuming a linear casual connection between impairment to handicaps; omitting environmental factors; and being too complex from an operational point of view to distinguish unequivocally the three concepts.
The ICDIH model in comparison with Nagi’s disablement model presents some similarities in the definition of the four concepts. The disease and impairment terms in the ICDIH model are comparable to the pathology and impairment terms in Nagi’s model. Whereas, the concepts of disability and handicap may be comparable to functional limitation and disability, respectively67.
In 2001, the WHO presented a revision of the classification in response to the ICIDH’s criticism68: the International Classification of Functioning, Disability
and Health (ICF)69, see Figure 10. The new conceptual framework for health
and disability was originated by putting major emphasis on health and functioning instead of disability as they did in the past, ICF focuses on ‘components of health as human functioning’ instead of ‘disabilities as consequences of disease’. The criticism about the linear link between impairment, disability and handicap is sorted out by the inclusion of bi-directional arrows, which allow all the components to be connected.
The ICF has a broader coverage than its predecessor, and allows its use in different sectors, besides health research and clinical setting, for example in insurance, economics, and education, among others.
67 Pope A.M. and Tarlov A.R. (eds). A model for disability and disability prevention. In:
Disability in America: toward a National agenda for prevention. Institute of Medicine, National Academy Press, Washington, DC, 1991: pp.76-108.
68 Before the release of the ICF model, WHO also developed a new version of the ICIDH
model in 1997; it was called ICIDH-2 and took into consideration participation and environmental factors.
69 World Health Organisation. ICF Introduction. Accessed on February 2005. URL:
Figure 10: The International Classification of Functioning, Disability and Health model (ICF), (2001).
Personal Factors
(Contextual factors)
Activities (Limitation) Body function&structure
(Impairment)
Environmental Factors
Participation (Restriction) Health Condition
(Disease/Disorder)
(Functioning and Disability)
Source: Adapted from WHO70.
Instead of describing impairment, disability, and handicap, the ICF describes body structure, functioning, activities and participation. The goal of this approach was to focus on health components instead of disease consequences, classifying the status of a person in an array of health or health-related domains71. The definitions of the key terms used in the ICF framework are
displayed in Table 2.
70 World Health Organisation. Towards a common language for functioning, disability and
health ICF. Geneva 2002. Accessed on February 2005. URL: www3.who.int/icf/beginners/bg.pdf.
71 Health domains are vision, hearing, speech, digestion, bodily excretion, fertility, sexual
Table 2: ICF definitions in the context of health.
Body functions: physiological functions of body systems (including psychological
functions) example: seeing
Body structures: anatomical parts of the body such as organs, limbs and their components
example: eye and related structures
Impairments: problems in body function or structure such as significant deviation or loss
example: loss of vision
Activity: execution of a task or action by an individual
example: reading
Participation: involvement in a life situation
example: reading performance
Activity limitations: difficulties an individual may experience in involvement in life
situations
example: attend the University without the use of any assistance
Environmental factors: make up the physical, social and attitudinal environment in which
people live and conduct their lives example: light or transportation services
Source: Adapted from ‘ICF introduction’72.
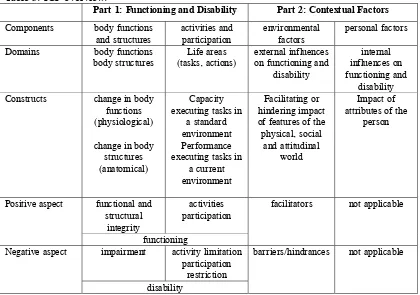
The ICF follows a hierarchical structure. In the first level two parts are differentiated, then each part has two components and each component is made up of domains and then categories. As is shown in Table 3, the two parts are: a) functioning and disability and b) contextual factors. The first part contains two components: body functions and structures (changes in body function and body structure), and activities and participation (capacity and performance), it measures what a person with a specific health condition can do in a standard environment and what they can actually do in their usual environment. The components of the second part are environmental factors (barriers and facilitators) and personal factors. Environmental factors include social norms, cultural and political factors, among others, whereas personal factors refer to characteristics of the individual such as gender, age, education, other health conditions, coping style and social background, among others. Therefore, the
72 World Health Organisation. ICF Introduction. Accessed on February 2005. URL:
person’s functioning and disability comes from the interaction between health conditions and contextual factors, therefore disability may be caused by a health condition or an existing disability may change a health condition.
Table 3: ICF overview.
Part 1: Functioning and Disability Part 2: Contextual Factors
Components body functions
and structures activities and participation environmental factors personal factors
Domains body functions
body structures
Life areas (tasks, actions)
external influences on functioning and
disability
internal influences on functioning and
disability
Constructs change in body
functions (physiological)
change in body structures (anatomical)
Capacity executing tasks in
a standard environment Performance executing tasks in
a current environment
Facilitating or hindering impact of features of the physical, social
and attitudinal world
Impact of attributes of the
person functional and structural integrity activities participation Positive aspect functioning
facilitators not applicable
impairment activity limitation participation
restriction Negative aspect
disability
barriers/hindrances not applicable
Source: Adapted from ‘ICF introduction’.
Table 4: The disablement model and the International Classification of Functioning, Disability and Health model (ICF).
Anatomical body
parts functions of the Physiological
body
Task
performance Involvement in life roles
Pathology Impairment Functional Limitations Disability Disablement Model Disease, injury, congenital condition Dysfunctions and structural abnormalities Restrictions in basic physical and
mental actions
The expression of a physical or mental
limitation in a social context Body Functions and Structures Activities and Participation
ICF
Physiological functions of body systems
and anatomical parts of body Activity: execution of a task or action Participation: involvement in a life situation
Source: Adapted from Jette A.M. and Keysor J.J.73
The disablement model of L.M. Verbrugge and A.M. Jette has been used as a conceptual frame in this work. Although the ICF model has implied a significant step further as a classification tool, the disablement model is more useful for disability research in the elderly population. In the epidemiological studies, it facilitates distinguishing and studying the different factors that contribute to the development of disability.
1.2.2. Measures of disability
Disability is typically assessed by means of self-reported measures that evaluate the ability to perform a set of tasks needed to maintain one’s lifestyle in order to live independently74. These tasks are known as ‘activities of daily living’
(ADLs) classified in: basic (BADLs75) developed by S. Katz and colleagues in
73 Jette A.M. and Keysor J.J. Disability models: implications for arthritis exercise and physical
activity interventions. Arthritis Rheum 2003; 49:114-20.
196376 and instrumental activities (IADLs) developed by M.P. Lawton and
E.M. Browdy in 196977. The BADLs refer to everyday life tasks of personal
care, whereas IADLs refer to more complex tasks needed to live in the community. S. Katz highlighted that the loss of function takes place in a specific order so the ability to perform the most complex activities are lost first, which are also the last acquired in the learning process due to their difficulty. Besides these two measures, disability can also be assessed through mobility performance, objective measures that evaluate standardized tasks, such as standing balance, walking distances, climbing stairs, and chair stand tests, among others by means of counting repetitions or timing the task.
Measures of disability such as ADLs are important because they provide an appraisal of the burden caused by suboptimal health by taking into consideration other factors (e.g., underlying diseases, psychological and social factors). Moreover, in the elderly population, impairment in ADLs has been found to be predictor of all-cause mortality78, institutionalisation79, nursing home
76 Katz S., Ford A.B., Moskowitz R.W., Jackson B. and Jaffe M.W. Studies of illness in the
aged. The Index of ADL: A Standardized Measure of Biological and Psychosocial Function. JAMA 1963;185:914-9;
Katz S. Assessing self-maintenance: activities of daily living, mobility and instrumental activities of daily living. J Am Geriatr Soc 1983;31:721-6.
77 Lawton M.P. and Browdy E.M. Assessment of older people: self-maintaining and
instrumental activities of daily living. Gerontologist 1969;9:179-89.
78 Scott W.K., Macera C.A., Cornman C.B. and Sharpe P.A. Functional health status as a
placement80, increase the use of hospital services81 and associated to higher
costs82, and be used as eligibility criteria for long-term care in the States83.
However, ADL measures in elderly research to improve in some areas such as: a) the number of activities considered differ across studies creating difficulties in comparing their findings, and b) the validity of these measures in different cultural settings beyond industrialised countries needs to be more thoroughly evaluated.
1.2.3. Evolution of disability
There is some degree of variability among elderly people in the evolution of disability. The average pattern is defined by a considerable proportion of elderly persons who are able to live with a good functional ability during several years, whereas some elderly people experience a functional decline over time, and a small proportion of elderly people recover from disability over time84. This
risks of subsequent nursing home placement and death. J Gerontol B Psychol Sci Soc Sci 1993;48:S93-S101.
79 Mor V., Wilcox V., Rakowski W. and Hiris J. Functional transitions among the elderly:
patterns, predictors, and related hospital use. Am J Public Health 1994;84:1274-80.
80 Wolinsky F.D., Callahan C.M., Fitzgerald J.F. and Johnson R.J. Changes in functional
status and the risks of subsequent nursing home placement and death. J Gerontol B Psychol Sci Soc Sci 1993;48:S93-S101.
81 Ferrucci L., Guralnik J.M., Pahor M, Corti M.C. and Havlik R.J. JAMA
1997;227:728-34.
82 Mor V., Wilcox V., Rakowski W. and Hiris J. Functional transitions among the elderly:
patterns, predictors, and related hospital use. Am J Public Health 1994;84:1274-80.
83 Spector W.D. and Fleishman J.A. Combining activities of daily living with instrumental
activities of daily living to measure functional disability. J Gerontol B Psychol Sci Soc Sci 1998; 53:S46-57; Stone R.I. and Murtaugh C.M. The elderly population with chronic functional disability: implications for home care eligibility. Gerontologist 1990;30:491-6.
84 Fried L.P and Guralnik J.M. Disability in older adults: evidence regarding significance,