Application of image processing methodologies for
fruit detection and analysis
Davínia Font Calafell
Dipòsit Legal: L.1695-2014
http://hdl.handle.net/10803/284652
Nom/Logotip de la Universitat on s’ha
llegit la tesi
ADVERTIMENT. L'accés als continguts d'aquesta tesi doctoral i la seva utilització ha de respectar els drets de la persona autora. Pot ser utilitzada per a consulta o estudi personal, així com en activitats o materials d'investigació i docència en els termes establerts a l'art. 32 del Text Refós de la Llei de Propietat Intel·lectual (RDL 1/1996). Per altres utilitzacions es requereix l'autorització prèvia i expressa de la persona autora. En qualsevol cas, en la utilització dels seus continguts caldrà indicar de forma clara el nom i cognoms de la persona autora i el títol de la tesi doctoral. No s'autoritza la seva reproducció o altres formes d'explotació efectuades amb finalitats de lucre ni la seva comunicació pública des d'un lloc aliè al servei TDX. Tampoc s'autoritza la presentació del seu contingut en una finestra o marc aliè a TDX (framing). Aquesta reserva de drets afecta tant als continguts de la tesi com als seus resums i índexs.
ADVERTENCIA. El acceso a los contenidos de esta tesis doctoral y su utilización debe respetar los derechos de la persona autora. Puede ser utilizada para consulta o estudio personal, así como en actividades o materiales de investigación y docencia en los términos establecidos en el art. 32 del Texto Refundido de la Ley de Propiedad Intelectual (RDL 1/1996). Para otros usos se requiere la autorización previa y expresa de la persona autora. En cualquier caso, en la utilización de sus contenidos se deberá indicar de forma clara el nombre y apellidos de la persona autora y el título de la tesis doctoral. No se autoriza su reproducción u otras formas de explotación efectuadas con fines lucrativos ni su comunicación pública desde un sitio ajeno al servicio TDR. Tampoco se autoriza la presentación de su contenido en una ventana o marco ajeno a TDR (framing). Esta reserva de derechos afecta tanto al contenido de la tesis como a sus resúmenes e índices.
PhD Thesis
Engineering and Information Technologies
Application of image processing
methodologies for fruit detection and
analysis
Author
Davínia Font Calafell
Department of Computer Science and Industrial Engineering University of Lleida
Director of the PhD Thesis
Dr. Jorge Palacín Roca
Departament d’Informàtica i Enginyeria Industrial Escola Politècnica Superior
Universitat de Lleida
Application of image processing
methodologies for fruit detection and
analysis
Memòria presentada per optar al grau de Doctor per la Universitat de Lleida redactada segons els criteris establerts en l’Acord núm. 19/2002 de la Junta de Govern del 26 de febrer de 2002 per la presentació de la tesis doctoral en format d’articles i menció international.
Programa de doctorat: Enginyeria i Tecnologies de la Informació
Director de la Tesis: Dr. Jordí Palacin Roca
El Dr. Jordi Palacín Roca, professor titular de l’Escola Politècnica Superior de la Universitat de Lleida
CERTIFICA:
Que la memòria “Application of image processing methodologies for fruit detection and analysis” presentada per Davínia Font Calafell per optar al grau de Doctor s’ha realitzat sota la seva supervisió.
Acknowledgements
First of all, I would like to thank Dr. Jordi Palacín for the tasks performed as the supervisor of this thesis. All the knowledge he shared with me, his encouragement, guidance, and persistence during the evolution of this PhD Thesis has been essential for my development as a researcher.
I would like to thank the University of Lleida, the UdL-IMPULS project (reference: X10020), the Government of Catalonia (Comisionat per a Universitats i Recerca, Departament d’Innovació, Universitats i Empresa) and the European Social Fund with references 2012FI_B 00301, 2013FI_B1 00010 and 2014FI_B2 00118 for funding this PhD Thesis.
Thanks to my family, especially to my grandparents, parents, siblings and partner: Benjamí, Magina, Josep, Teresa, Edgard, Jessica and Samuel for their immense support, patience and understanding. They have always transmitted great values and principles making me to fight with perseverance, and giving me the motivation I needed at every specific moment. They have always given me courage and support being my strength in difficult moments and the people with whom I wanted to share all the successes.
Thanks to all my department colleagues: Mercè, Tomàs, Marcel, Javier, and Dani for their help and friendship, they have been essential on the development of this PhD Thesis. Also thanks to my colleagues from CMU (Carnegie Mellon University) and especially to Dr. Stephen Nuske, who guided me during the research stays I performed in this institution.
Resum
En aquesta memòria es presenten diversos treballs d'investigació centrats en l’automatització d’operacions agrícoles mitjançant l’aplicació de diverses tècniques de processament d’imatge.
La indústria de l’agricultura està exigint solucions tecnològiques basades en l’automatització de les tasques agrícoles amb l’objectiu d’incrementar la producció i beneficis reduint al mateix temps el temps i els costos. Els avenços tecnològics en l’agricultura tenen un factor rellevant i fan possible la implementació de noves tècniques basades en les tecnologies de sensors i de processament d’imatges. Tot i això, encara hi ha molts reptes a resoldre.
Resumen
En esta memoria se presentan diversos trabajos de investigación centrados en la automatización de operaciones agrícolas mediante la aplicación de distintas técnicas de procesado de imágenes.
La industria de la agricultura está exigiendo soluciones tecnológicas centradas en la automatización de las tareas agrícolas con el fin de aumentar la producción y los beneficios reduciendo al mismo tiempo el tiempo y los costes. Los avances tecnológicos en la agricultura de precisión tienen un papel relevante y hacen posible la implementación de nuevas técnicas basadas en las tecnologías de sensores y en procesado de imágenes. Sin embargo, todavía hay muchos desafíos a resolver.
Summary
This memory introduces several research works developed to automate agricultural tasks by applying image processing techniques.
Agricultural industry is demanding technological solutions focused on automating agricultural tasks in order to increase the production and benefits while reducing time and costs. Technological advances in precision agriculture have an essential role and enable the implementation of new techniques based on sensor technologies and image processing systems. However, there are still many challenges and problems to be solved.
Contents
1. Introduction 13
1.1. Soil analysis ... 13
1.2. Seeds, seedling, breeding, growing and state of health ... 15
1.3. Detection of crops and yield estimation ... 16
1.4. Weed control and machinery ... 19
1.5. Positioning, navigation and safety ... 20
1.6. Microorganisms and pest control ... 20
1.7. Crop quality ... 21
1.8. References ... 23
2. Objectives 31 3. PhD Thesis structure 33 4. Image processing method applied to locate agricultural elements at pre-harvest stage: counting red grapes 37 4.1. Introduction ... 37
4.2. Contributions to the state of the art ... 38
4.3. References ... 39
4.4. Counting red grapes in vineyards by detecting specular spherical reflection peaks in RGB images obtained at night with artificial illumination. D. Font et al. / Computers and Electronic in Agriculture 108 (2014) 105–111 ... 41
1. Introduction ... 41
2. Related work ... 42
3. Materials ... 43
3.1. Vineyard facility ... 43
3.2. Image acquisition system ... 43
4. Counting red grapes ... 44
4.1. Manual counting for validation ... 44
Contents
ii
4.2.1. Automatic red grape segmentation ... 45
4.2.2. Image smoothing ... 46
4.2.3. Automatic red grape (specular reflection peak) counting ... 46
4.2.4. Optimization of the parameters of the morphological detector ... 46
5. Results ... 49
6. Conclusions ... 51
Acknowledgements ... 51
References ... 51
5. Image processing method applied to estimate size, distance and position of fruits at harvest stage: automatic fruit harvesting 53 5.1. Introduction ... 53
5.2. Contributions to the state of the art ... 54
5.3. References ... 55
5.4. A proposal for automatic fruit harvesting by combining a low cost stereovision camera and a robotic arm. D. Font et al. / Sensors 2014, 14, 11557-11579 ... 57
1. Introduction ... 58
2. Related Work ... 59
3. Materials ... 61
3.1. Stereovision Image Acquisition System ... 61
3.2. Vision Targets ... 62
3.3. Robotic Arm for Fruit Harvesting ... 63
3.4. Guidance of the Robotic Arm ... 65
4. Stereovision Fruit Detection Accuracy ... 66
4.1. Experimental Setup ... 66
4.2. Image Processing: Target Centroid, Inclination and Diameter Estimate... 67
4.3. Distance, Position and Diameter Estimate ... 68
4.4. Experimental Results ... 70
5. Automatic Harvesting ... 73
5.1. Initial Fruit Detection... 73
5.2. Rough Approach to a Fruit ... 74
Contents
5.4. Fruit Pickup ... 76
5.5. Fruit Pickup Performances ... 76
6. Conclusions and Future Work ... 80
Acknowledgements ... 81
Author Contributions ... 81
Conflicts of Interest ... 81
References ... 81
6. Image processing method applied as a fruit quality control tool at post-harvest stage: nectarine variety verification 85 6.1. Introduction ... 85
6.2. Contributions to the state of the art ... 86
6.3. References ... 87
6.4. An image processing method for in-line nectarine variety verification based on the comparison of skin feature histogram vectors. D. Font et al. / Computers and Electronics in Agriculture 102 (2014) 102-119 ... 89
1. Introduction ... 89
1.1. Definition of the problem ... 90
1.2. New contribution... 91
2. Related work ... 91
3. Materials and methods ... 92
3.1. Nectarine varieties ... 92
3.2. Fruit-packing line ... 92
3.3. Image processing techniques ... 93
3.4. Nectarine feature histogram vector ... 94
3.5. Nectarine variety dataset ... 96
3.6. Comparison of nectarine variety ... 96
4. Results ... 97
4.1. Automatic variety verification ... 97
4.1.1. Stage 1. Nectarine variety dataset ... 97
4.1.2. Stage 2. Variety classification threshold ... 97
4.1.3. Stage 3. Automatic variety classification ... 98
4.2. Manual variety verification ... 99
Contents
iv
Acknowledgements ... 102
References ... 103
7. Image processing method applied as a fruit quality monitoring tool at post-harvest stage: correlation between quality indices and visible spectra of the skin of the fruit 105
7.1. Introduction ... 105
7.2. Contributions to the state of the art ... 106
7.3. References ... 107
7.4. Assessment of the correlation between post-storage fruit quality parameters and visible spectra of the skin for ‘Golden Smoothee’ apple D. Font et al. / Submitted to Journal of Food Engineering, July 2014 ... 108
1. Introduction ... 109
2. Related work ... 109
2.1. Fruit quality estimation ... 109
2.2. Fruit damage estimation ... 110
2.3. Fruit grading estimation ... 111
3. Materials and methods ... 111
3.1. Fruit variety ... 111
3.2. Fruit quality parameters ... 112
3.2.1. Fruit diameter ... 112
3.2.2. Fruit weight ... 112
3.2.3. Fruit skin color ... 112
3.2.4. Fruit flesh firmness ... 113
3.2.5. Soluble solids content ... 113
3.2.6. Titratable acidity ... 113
3.3. Skin RGB spectra measurement ... 114
3.3.1. Image acquisition... 114
3.3.2. Automatic visible spectra analysis ... 115
4. Results and discussion ... 116
5. Conclusions ... 122
Acknowledgements ... 123
Contents
8. General discussion of the results 125
8.1. Image processing method applied to locate agricultural elements at pre-harvest stage: counting red grapes ... 125 8.2. Image processing method applied to estimate size, distance and
position of fruits at harvest stage: automatic fruit harvesting ... 127 8.3. Image processing method applied as a fruit quality control tool at post-harvest stage: nectarine variety verification ... 129 8.4. Image processing method applied as a fruit quality control tool at post-harvest stage: correlation between post-storage fruit quality
attributes and visible spectra of the skin of the fruit... 131 8.5. References ... 134
9. Conclusions 135
10. Other research activities 137
10.1. Contributions to publications... 137 10.2. Contributions to conferences ... 138 10.3. Scientific foreign exchange ... 139
List of Figures
Fig. 1.1. (a) ARP system; (b) Prototype soil strength sensor ...14
Fig. 1.2. Multisensory platform ...16
Fig. 1.3. (a) Weed control prototype; (b) LAI prediction by using LIDAR sensors mounted on a tractor ...20
Fig. 1.4. Ground-based ultrasonic system ...21
Fig. 1.5. Glove-based system prototype for measuring fruit attributes ...23
Fig. 3.1. PhD Thesis structure ...35
Fig. 4.1. Sample of specular reflection: (a) original vineyard image; (b) normalized grayscale image ...38
Fig. 5.1. Stereovision camera placed in the gripper of the robotic arm ...54
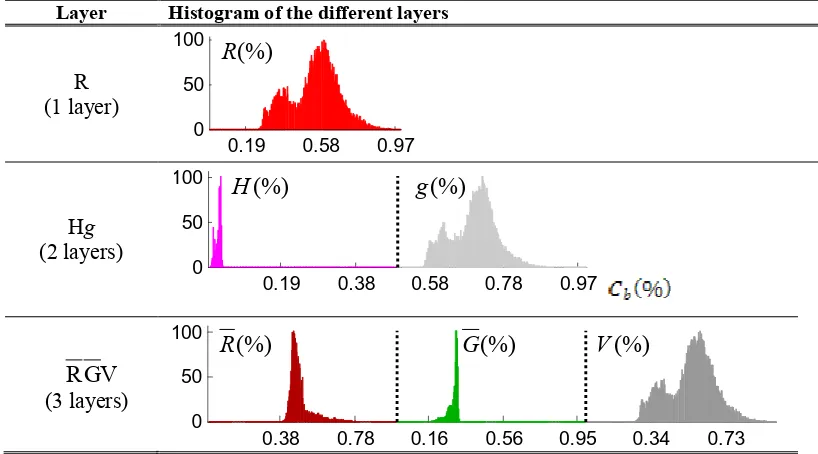
Fig. 6.1. Examples of nectarine skin histograms concatenating several intensity color layers from different color spaces ...86
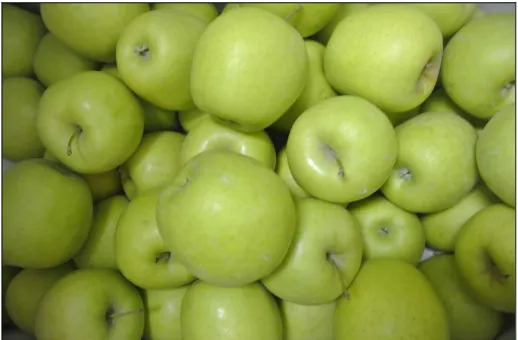
Fig. 7.1. Golden Delicious Smothee apple variety ...106
Counting red grapes in vineyards by detecting specular spherical reflection peaks in RGB images obtained at night with artificial illumination Fig. 1. Vineyard facility. ...43
Fig. 2. Manual labeling of red grapes with different degrees of occlusion in a sample vineyard image. ...44
Fig. 3. Sample of specular reflection: (a) detail of an original vineyard image; (b) colorized representation of the normalized grayscale image in order to evidence the hot spots originated by the specular spherical reflection on the grapes. ...45
Fig. 4. Example of grape segmentation: (a) vineyard image; (b) H color layer segmented; (c) morphologically filtered image; d) vineyard image with the background extracted. ...45
Fig. 5. Example of image filtering: (a) vineyard image; (b) filtered image (with the background extracted). ...46
Fig. 6. Three-dimensional representation of the morphological detector. ...47
Fig. 7. Example of a red grape counting procedure: (a) filtered vineyard image; (b) intensity peaks detected; (c) centroid of the intensity peaks plotted on the original image. ...47
List of Figures
viii
Fig. 9. False positive counting results in percentage values for different radii (from 10 to 50) and different points (from 5 to 35) defined on the external
circumference of the morphological detector. ... 48
Fig. 10. Example of automatic and manual red grape detection: (a) automatic detection (red cross) and manual labeling considering three occlusion groups: [0% occlusion], green circle; [0%-75% occlusion], red circle; and [75%-99% occlusion], yellow circle. (b) Automatic detection results (red cross) and false positives detected (yellow circles) ... 49
A proposal for automatic fruit harvesting by combining a low cost stereovision camera and a robotic arm Fig. 1. Minoru 3D USB Webcam. (a) External view; (b) Detail of the two cameras . 61 Fig. 2. Experimental setup for grid measurement ... 62
Fig. 3. Pushpin: (a) original image and (b) segmented image showing the centroid (red dot), inclination (magenta line) and diameter in pixels (green line) ... 62
Fig. 4. Apple: (a) original image and (b) segmented image showing the centroid (red dot), inclination (magenta line) and diameter in pixels (green line) ... 62
Fig. 5. Pear: (a) original image and (b) segmented image showing the centroid (red dot), inclination (magenta line) and diameter in pixels (green line) ... 63
Fig. 6. (a) Robotic arm design; (b) Detail of the gripper tool with the imaging device. ... 64
Fig. 7. Relative grid definition and targets used in the experimental setup ... 66
Fig. 8. Representation of the right (red point) and left camera (blue point) and their visible area ... 67
Fig. 9. Grid size in function of the distance between the camera and the target. ... 67
Fig. 10. Schematic representation of the parameters involved in a distance estimate with a stereovision system ... 68
Fig. 11. Example of fruit segmentation and location in a stereovision image ... 73
Fig. 12. Example of a rough approach to a fruit ... 74
Fig. 13. Example of a fine approach to a fruit ... 75
Fig. 14. Example of stereovision images obtained while performing a fine approach to a fruit: (a) at the beginning of the approach; and (b) at the end of the approach. ... 75
Fig. 15. Example of fruit pickup in laboratory conditions ... 76
An image processing method for in-line nectarine variety verification based on the comparison of skin feature histogram vectors Fig. 1. Aerial view of the distributions of orchards in Aitona, Lleida, Spain (coordinates: 287,486, 4,598,486; scale: 1:18.898) (SIMA, 2013). ... 90
List of Figures
Fig. 3. Skin and optimal harvest period (gray rectangle) for the nectarine varieties selected ...93
Fig. 4. Scheme of the fruit packing line ...93
Fig. 5. Example of normalized nectarine skin histograms (a) and its corresponding feature histogram vectors (b) when concatenating one, two or three color layers ...95
Fig. 6. Example of the alternative feature histogram vector creation. ...96
Fig. 7. Image of the visual information shown on the display during the manual experiment ...99
Assessment of the correlation between post-storage fruit quality
parameters and visible spectra of the skin for ‘Golden Smoothee’ apple
Fig. 1. ‘Golden Smoothee’ apples. ...112
Fig. 2. Detail of the experimental set-up made up of the illumination kit and the camera.. ...114
Fig. 3. Image of a ‘Golden Smoothee’ apple illuminated with the white light source ...115
Fig. 4. Average evolution of the (a) weight and (b) size parameters...119
Fig. 5. Average evolution of the: (a) L, (b) a, and (c) b color layers ...119
Fig. 6. Average evolution of the: (a) flesh firmness, (b) TA, and (c) SSC parameters ...119
List of Tables
Counting red grapes in vineyards by detecting specular spherical reflection peaks in RGB images obtained at night with artificial illumination
Table 1. Individual red grape counting results. The values in italics have been obtained automatically; the other values require manual operation. ...50
A proposal for automatic fruit harvesting by combining a low cost stereovision camera and a robotic arm
Table 1. Vision target sizes ...63
Table 2. Robotic arm dimensions ...64
Table 3. Ranges of the parameters α and theta θ of the joints ...65
Table 4. Fixed D-H parameters for the robotic arm ...66
Table 5. Camera calibration parameters ...69
Table 6. Error detection in terms of average (AV) and standard deviation (SD). ...71
Table 7. Distribution of the errors in the measurement grid in case of detecting an apple with a calibrated camera ...72
Table 8. Fruit detection: Threshold segmentation case ...77
Table 9. Fruit detection: LCM segmentation [7] case ...78
Table 10. Fruit pickup time-performances ...79
An image processing method for in-line nectarine variety verification based on the comparison of skin feature histogram vectors
Table 1. Best nectarine variety classification results: correlation comparison ...100
Table 2. Best nectarine variety classification results: cumulative subtraction comparison ...101
Table 3. Results of the manual classification experiment of the Nectarreve variety ...102
Assessment of the correlation between post-storage fruit quality
parameters and visible spectra of the skin for ‘Golden Smoothee’ apple
Table 1. Example of intermediate image analysis results for Fig. 4. ...116
Table 2. Comparative evolution of several apple parameters obtained with a contact-based measurement ...118
List of Tables
xii
Table 4. Correlations between non-contact parameters obtained by image processing and fruit quality parameters that require destructive measurements ... 121
Chapter 1
Introduction
A large number of the tasks conducted in the agricultural field are human-performed operations, highly time consuming and prone to produce stress and fatigue to their human operators due to the nature of the conditions under which they take place. Thanks to the technological advances that have appeared over the last years, such as image processing procedures and sensor-based technologies, a considerable number of novel techniques have been implemented allowing the automation of many of these tasks and, thus, leading to big economic and efficiency gains. However, there are still many challenges and problems to be solved.
These technological solutions cover all phases of the industrial process; pre-harvest, harvest and post-harvest. The needs to be solved identified by farmers are focused on the following topics: 1.1) Soil analysis, 1.2) Seeds, seedling, breeding, growing and state of health, 1.3) Location and detection of crops, and yield estimation, 1.4) Weed control and machinery, 1.5) Positioning, navigation and safety, 1.6) Microorganisms and pest control, and 1.7) Crop quality.
1.1. Soil analysis
Chapter 1. Introduction
14
[image:27.595.71.474.559.717.2]attributes within the electromagnetic ranges of 400 to 1,000 nm. In [2] a frequency-domain reflectometry sensor was used for soil salinity assessment of sandy mineral soils and bulk electrical conductivity. In [3] a time domain reflectometry system was applied to analyze soil moisture, electrical conductivity and temperature. In [4] image processing techniques applied to splashed particles were designed to evaluate the impact of water drop in order to characterize soil detachment. In [5] a low-cost capacitance-resistance probe was used to monitor soil volumetric water content and salinity. In [6], new devices based on an electrical penetrometer and a laser microrelief profile meter were designed to study the effects that the transit of the tractors cause on the fields. Variations in the dry bulk density, cone index of clayey soil and sinkage (rut depth) of the running gear were measured. In [7] an automatic resistivity profiler (ARP) sensor in combination with a GPS system (see Fig. 1.1-a) was used to evaluate spatial variability patterns of vegetative growth and yield in a vineyard based on electrical resistivity (ER) and ancillary topographic attributes. In addition, regression and cluster analysis were performed to evaluate soil resistivity data, landscape attributes and grapevine variables. The results showed that the ER obtained good correlations with trunk circumference spatial pattern and yield. In [8] a prototype soil strength sensor equipped with Real Time Kinematic- Global Positioning Systems technology (RTK-GPS) (see Fig. 1.1-b) was designed to measure soil cutting resistance at various depths of a field. The results showed that under the conditions established there was a quadratic relationship between the soil strength profile sensor cutting force and the soil cone index values.
Fig. 1.1. (a) ARP system [7]; (b) Prototype soil strength sensor [8].
Chapter 1. Introduction
1.2. Seeds, seedling, breeding, growing and state of
health
Chapter 1. Introduction
[image:29.595.88.485.84.270.2]16
Fig. 1.2. Multisensory platform [14].
1.3. Detection of crops and yield estimation
Tasks focused on the detection, location and counting of elements are being automated considering different scenarios and set-up possibilities in order to reduce costs [17] and to avoid errors produced by the fatigue and stress of human operators by the long working hours. Additionally, one of the biggest challenges in agricultural industry is to estimate yield with accuracy and to predict variations in its quality, which are dependable on environmental variables (soil characteristics, weather conditions, pests and plant diseases), farming factors (addition of products such as water, pesticide or fertilizer), and agricultural operations (pruning, thinning). The uncertainties about how these factors affect crop quality make the management of orchards very complex. For this reason, crop yield estimation is a topic of relevant interest in precision agriculture.
Chapter 1. Introduction
Chapter 1. Introduction
18
space. In [26] the number of individual grapes from vineyard images were estimated by using a radial symmetry transform [27]. The method consisted in identifying pixels with a high level of radial symmetry and in connecting the neighboring berries into clusters in order to predict yield. The results showed that the yield could be estimated with an error of 9.8%. More recently, in [28] the size and weight of grapes were accurately estimate with values of 0.97 and 0.96, respectively.
Chapter 1. Introduction
1.4. Weed control and machinery
Weed control is also an important step in the automation of agricultural tasks implying the design of effective machinery. The application of agrochemicals in orchards is very complex since canopies are spatially variable and specific doses may be required at different areas of the orchard. Machinery is being designed to spray at an adequate rate in order to use the adequate amount of agrochemicals. For example, in [32] an assisted sprayer equipped with two axial fans and a 3D sonic anemometer was designed and implemented to apply the exact quantity of agrochemicals needed. In [33] the use of a scanning Light Detection and Ranging (LIDAR) system during pesticide tasks to control drift in vineyard spraying was described. In [34] a prototype of six-row mechanical weed control cultivator for inter-row areas and band spraying for intra-row areas was implemented (see Fig. 1.3-a). The results showed a significant decrease in the herbicide application rate and consequently a reduction in the operating cost. In [35] the reduction of weed competition in wheat and barley was controlled using a harrow equipped with bi-spectral cameras, which detected crop leaf cover, weed cover and soil density. In [36] LIDAR sensors mounted on a tractor (see Fig. 1.3-b) were used to evaluate geometric and structural parameters of vines such as the height, the cross-sectional area, the canopy volume and the tree area index (TAI). These parameters were used to predict the leaf area index (LAI). The results showed that the TAI was the best estimation of the LAI achieving a strong correlation of 0.92. In [37] a sprayer prototype was designed and implemented to regulate the volume application rate to the canopy volume in orchards. The conclusions were that there were strong relationships between the intended and the sprayed flow rates (R2= 0.935) and between the canopy cross-sectional areas and the sprayed flow rates (R2= 0.926).
Chapter 1. Introduction
[image:33.595.92.444.85.254.2]20
Fig. 1.3. (a) Weed control prototype [34]; (b) LAI prediction by using LIDAR sensors mounted on a tractor [36].
1.5. Positioning, navigation and safety
The automation of agricultural applications that involve land vehicles requires knowing global and local positions of specific elements in an orchard. In addition, safety while navigating is also essential. The two most commonly used methods to estimate global and local coordinates are the GPS system and crop rows detection systems, respectively. Nowadays, researchers focused their efforts to integrate the inertial navigation system (INS) with GPS to enhance positioning and navigation information for agricultural machinery. In [40] a novel inertial sensor was developed to remove error components in order to enhance positioning and navigation for land vehicles by applying a fast orthogonal search modeling technique. In [41] a vehicle was guided inside greenhouses by means of a laser sensor. The vehicle integrated several tools for a wide range of applications such as a spray system for applying plant-protection product, a lifting platform to reach the top part of the plants to perform pruning and harvesting tasks, and a trailer to transport fruits, plants, and crop waste.
1.6. Microorganisms and pest control
Chapter 1. Introduction
[image:34.595.253.419.482.603.2]them, which is a time- and cost-consuming operation since it must be performed periodically through the field and so, its automation implies benefits in all aspects. In [42] an autonomous system based on a low-cost image sensor was responsible of monitoring pests by capturing and sending images of trap contents, which were distributed through the field, to a control station. The images were processed in the control station in order to calculate the number of insects. In [43] a development of an immunocapture real-time reverse transcription-polymerase chain reaction (RT-PCR) assay to detect the tobacco mosaic virus in the soil was presented. In [44] a system to detect root colonization by microorganism in potatoes was developed. A technique to excite material and produce fluorescence was applied for this purpose. In [45] an ultrasonic distance sensor in combination with a camera was used to estimate plant height in cereal crops and to determine the weed and crop coverage (see Fig. 1.4). The results showed a success of 92.8% when separating weed infested zones and non-infested zones. The acquisition of sounds through a bio-acoustic sensor was used to detect real palm weevil for pest control [46]. Finally, in [47], a non-destructive method based on the Raman spectroscopy in combination with a laser source in order to detect pesticide residues on apple skin surfaces was developed. The results showed that the system was able to detect pesticide residues up to 6.69 mg/kg in less than 4 s.
Fig. 1.4. Ground-based ultrasonic system [45].
1.7. Crop quality
Chapter 1. Introduction
22
interest in precision agriculture. For example, in [48] a system based on Vis/NIR spectroscopy and a polychromatic spectrometer was used in order to measure quality indices of ‘Royal Gala’ apples such as color, starch pattern index, soluble solids content (SSC), firmness, quantitative starch, and titratable acidity (TA). The results showed a good estimation of the quality parameters studied and a dependency between the SSC and soluble carbohydrates. In [49] 19 apple cultivars were analyzed to find correlations between parameters extracted from non-destructive measurements (Vis/NIR spectroscopy) and by destructive measurements (penetrometer). The results showed that the parameters obtained with destructive measurements were strong correlated with sensory textural parameters. Another proposal was to assess physicochemical properties of two apple varieties to assess correlations between biochemical markers and fruit sensory properties [50]. The results showed that the galacturonic acid had a positive correlation with mealiness but a negative one with crunchiness and firmness. Finally, the total neutral sugar content was correlated with apple texture properties. In [51] correlations between biospeckle activity (BA) and other quality-attributes parameters obtained with destructive methods (firmness, SSC, TA and starch content (SC)) were assessed in case of apple fruits. The results showed a strong correlation between BA and SC.
The assessment of crop health is based on estimating fruit damage. For example, in [52] NIR hyperspectral imaging techniques were used to identify damages underneath fruit skin achieving a success rate of 92%. Another proposal was to use Vis/NIR spectroscopy but to identify internal defects in fruits [53]. In this case, the method showed an accuracy of 97%. In [54] two parameters (signal to noise ratio and area change rate) extracted from the application of Vis/NIR spectroscopic techniques were evaluated to measure internal defects. The conclusion obtained was that there was a strong correlation between these variables.
Chapter 1. Introduction
[image:36.595.141.513.376.471.2]ripeness classification of oil palm fresh fruit bunches. In [57] a glove-based system was designed to measure fruit attributes and as a tool for fruit grading. The glove system incorporates several sensors such as touch pressure, imaging, inertial measurements localization and a Radio Frequency Identification (RFID) reader (Fig. 1.5). Alternatively, in [58] an approach based on the measurement of internal quality parameters (firmness and SSC) and skin color components was developed to grade three apples cultivars by evaluating two different methods; Vis/NIR spectroscopy and spectral scattering. The conclusions obtained were that the results from the Vis/NIR technique were better achieving grading successes of 97% in the case of firmness and 92% for the SSC quality index. In [59] another method for grading fruits automatically was presented. The method was based on computing skin histograms of the fruits processed to correlate the evolution of these values with the fruit ripeness. The results showed good correlation between these parameters.
Fig. 1.5. Glove-based system prototype for measuring fruit attributes [57].
1.8. References
[1] Gmur, S.; Vogt, D.; Zabowski, D.; Moskal, L.M. Hyperspectral Analysis of Soil Nitrogen, Carbon, Carbonate, and Organic Matter Using Regression Trees. Sensors 2012, 12, 10639–10658.
[2] Wilczek, A.; Szypłowska, A.; Skierucha, W.; Cieśla, J.; Pichler, V.; Janik, G. Determination of Soil Pore Water Salinity Using an FDR Sensor Working at Various Frequencies up to 500 MHz. Sensors 2012, 12, 10890–10905. [3] Skierucha, W.; Wilczek, A.; Szypłowska, A.; Sławiński, C.; Lamorski, K. A
Chapter 1. Introduction
24
Measurement of Soil Temperature and Electrical Conductivity. Sensors
2012, 12, 13545–13566.
[4] Ryżak, M.; Bieganowski, A. Using the Image Analysis Method for Describing Soil Detachment by a Single Water Drop Impact. Sensors 2012, 12, 11527–11543.
[5] Scudiero, E.; Berti, A.; Teatini, P.; Morari, F. Simultaneous Monitoring of Soil Water Content and Salinity with a Low-Cost Capacitance-Resistance Probe. Sensors 2012, 12, 17588–17607.
[6] Valera, D.L.; Gil, J.; Agüera, J. Design of a New Sensor for Determination of the Effects of Tractor Field Usage in Southern Spain: Soil Sinkage and Alterations in the Cone Index and Dry Bulk Density. Sensors 2012, 12, 13480–13490.
[7] Rossi, R.; Pollice, A.; Diago, M.-P.; Oliveira, M.; Millan, B.; Bitella, G.; Amato, M.; Tardaguila, J. Using an Automatic Resistivity Profiler Soil Sensor On-The-Go in Precision Viticulture. Sensors 2013, 13, 1121–1136 [8] Agüera, J.; Carballido, J.; Gil, J.; Gliever, C.J.; Perez-Ruiz, M. Design of a
Soil Cutting Resistance Sensor for Application in Site-Specific Tillage. Sensors 2013, 13, 5945–5957.
[9] Zhang, X.; Liu, F.; He, Y.; Li, X. Application of Hyperspectral Imaging and Chemometric Calibrations for Variety Discrimination of Maize Seeds. Sensors 2012, 12, 17234–17246.
[10] Navarro, P.J.; Fernández, C.; Weiss, J.; Egea-Cortines, M. Development of a Configurable Growth Chamber with a Computer Vision System to Study Circadian Rhythm in Plants. Sensors 2012, 12, 15356–15375.
[11] Kim, G.; Kim, G.H.; Ahn, C.-K.; Yoo, Y.; Cho, B.-K. Mid-Infrared Lifetime Imaging for Viability Evaluation of Lettuce Seeds Based on Time-Dependent Thermal Decay Characterization. Sensors 2013, 13, 2986–2996. [12] You, K.Y.; Mun, H.K.; You, L.L.; Salleh, J.; Abbas, Z. A Small and Slim
Chapter 1. Introduction
[13] Giselsson, T.M.; Midtiby, H.S.; Jørgensen, R.N. Seedling Discrimination with Shape Features Derived from a Distance Transform. Sensors 2013, 13, 5585–5602.
[14] Busemeyer, L.; Mentrup, D.; Möller, K.; Wunder, E.; Alheit, K.; Hahn, V.; Maurer, H.P.; Reif, J.C.; Würschum, T.; Müller, J.; Rahe, F.; Ruckelshausen, A. BreedVision - A Multi-Sensor Platform for Non-Destructive Field-Based Phenotyping in Plant Breeding. Sensors 2013, 13, 2830–2847.
[15] Yao, X.; Yao, X.; Jia, W.; Tian, Y.; Ni, J.; Cao, W.; Zhu, Y. Comparison and Intercalibration of Vegetation Indices from Different Sensors for Monitoring Above-Ground Plant Nitrogen Uptake in Winter Wheat. Sensors 2013, 13, 3109–3130.
[16] Fernandez-Jaramillo, A.A.; Duarte-Galvan, C.; Contreras-Medina, L.M.; Torres-Pacheco, I.; Romero-Troncoso, R.J.; Guevara-Gonzalez, R.G.; Millan-Almaraz, J.R. Instrumentation in Developing Chlorophyll Fluorescence Biosensing: A Review. Sensors 2012, 12, 11853–11869. [17] Peacock, W.L.; Vasquez, S.J.; Hashim-Buckey, J.M.; Klonsky, K.M.; De
Moura, R. L. Sample costs to establish and produce table grapes. Crimson Seedless. University of California, Cooperative Extension, GR-VS-07-2, 2007.
[18] Recio, J.A.; Hermosilla, T.; Ruiz, L.A.; Palomar, J. Automated extraction of tree and plot-based parameters in citrus orchards from aerial images. Computers and Electronics in Agriculture 2013, 90, 24–34.
[19] Stajnkoa, D.; Lakotaa, M.; Hocevar, M. Estimation of number and diameter of apple fruits in an orchard during the growing season by thermal imaging. Computers and Electronics in Agriculture 2004, 42, 31–42.
[20] Chinchuluun, R.; Lee, W.S. Citrus yield mapping system in natural outdoor scene using the watershed transform. ASAE, Paper No. 063010, 2006. [21] Wijethunga, P.; Samarasinghe, S.; Kulasiri, D.; Woodhead, I. Digital Image
Chapter 1. Introduction
26
[22] Linker, R.; Cohen, O.; Naor, A. Determination of the number of green apples in RGB images recorded in orchards. Computers and Electronics in Agriculture 2012, 81, 45–57.
[23] Payne, A.B.; Walsh, K.B.; Subedi, P.P.; Jarvis, D. Estimation of mango crop yield using image analysis – Segmentation method. Computers and Electronics in Agriculture 2013, 91, 57–64.
[24] Teixidó, M.; Font, D.; Pallejà, T.; Tresanchez, M.; Nogués, M.; Palacín, J. Definition of Linear Color Models in the RGB Vector Color Space to Detect Red Peaches in Orchard Images Taken under Natural Illumination. Sensors
2012, 12, 7701–7718.
[25] Teixidó, M.; Font, D.; Pallejà, T.; Tresanchez, M.; Nogués, M.; Palacín, J. An Embedded Real-Time Red Peach Detection System Based on an OV7670 Camera, ARM Cortex-M4 Processor and 3D Look-Up Tables. Sensors 2012, 12, 14129–14143.
[26] Nuske, S.; Achar, S.; Bates, T.; Narasimhan, S.; Singh, S. Yield Estimation in Vineyards by Visual Grape Detection. IEEE/RSJ International Conference on Intelligent Robots and Systems. San Francisco, CA, USA, 2011.
[27] Loy, G., Zelinsky, A. Fast Radial Symmetry for Detecting Points of Interest. IEEE Transactions on Pattern Analysis and Machine Intelligence 2003, 25, 959 – 973.
[28] Cubero, S.; Diago, M.P.; Blasco, J.; Tardáguila, J.; Millán, B.; Aleixos, N. A new method for pedicel/peduncle detection and size assessment of grapevine berries and other fruits by image analysis. Biosystems Engineering 2014, 117, 62-72.
[29] Lofton, J.; Tubana, B.S.; Kanke, Y.; Teboh, J.; Viator, H.; Dalen, M. Estimating Sugarcane Yield Potential Using an In-Season Determination of Normalized Difference Vegetative Index. Sensors 2012, 12, 7529–7547. [30] Dworak, V.; Selbeck, J.; Dammer, K.-H.; Hoffmann, M.; Zarezadeh, A.A.;
Bobda, C. Strategy for the Development of a Smart NDVI Camera System for Outdoor Plant Detection and Agricultural Embedded Systems. Sensors
Chapter 1. Introduction
[31] Diago, M.-P.; Correa, C.; Millán, B.; Barreiro, P.; Valero, C.; Tardaguila, J. Grapevine Yield and Leaf Area Estimation Using Supervised Classification Methodology on RGB Images Taken under Field Conditions. Sensors 2012, 12, 16988–17006.
[32] García-Ramos, F.J.; Vidal, M.; Boné, A.; Malón, H.; Aguirre, J. Analysis of the Air Flow Generated by an Air-Assisted Sprayer Equipped with Two Axial Fans Using a 3D Sonic Anemometer. Sensors 2012, 12, 7598–7613. [33] Gil, E.; Llorens, J.; Llop, J.; Fàbregas, X.; Gallart, M. Use of a Terrestrial
LIDAR Sensor for Drift Detection in Vineyard Spraying. Sensors 2013, 13, 516–534.
[34] Perez-Ruiz, M.; Carballido, J.; Agüera, J.; Rodríguez-Lizana, A. Development and Evaluation of a Combined Cultivator and Band Sprayer with a Row-Centering RTK-GPS Guidance System. Sensors 2013, 13, 3313–3330.
[35] Rueda-Ayala, V.; Weis, M.; Keller, M.; Andújar, D.; Gerhards, R. Development and Testing of a Decision Making Based Method to Adjust Automatically the Harrowing Intensity. Sensors 2013, 13, 6254–6271. [36] Arnó, J.; Escolà, A.; Vallès, J.M.; Llorens, J.; Sanz, R.; Masip, J.; Palacín, J.;
Rosell-Polo, J.R. Leaf area index estimation in vineyards using a ground-based LiDAR scanner. Precision Agriculture 2013, 14, 290–306.
[37] Escolà, A.; Rosell-Polo, J.R.; Planas, S.; Gil, E.; Pomar, J.; Camp, F.; Llorens, J.; Solanelles, F. Variable rate sprayer. Part 1 – Orchard prototype: Design, implementation and validation. Computers and Electronics in Agriculture 2013, 95, 122–135.
[38] Mehtaa, S.S.; Burks, T.F. Vision-based control of robotic manipulator for citrus harvesting. Computers and Electronics in Agriculture 2014, 102, 146-158.
[39] Ziona, B.; Mann M.; Levina, D.; Shilo, A.; Rubinstein, D.; Shmulevich, I. Harvest-order planning for a multiarm robotic harvester. Computers and Electronics in Agriculture 2014, 103, 75–81
Chapter 1. Introduction
28
Utilizing High Resolution Spectral Analysis. Sensors 2012, 12, 11638– 11660.
[41] Sánchez-Hermosilla, J.; González, R.; Rodríguez, F.; Donaire, J.G. Mechatronic Description of a Laser Autoguided Vehicle for Greenhouse Operations. Sensors 2013, 13, 769–784.
[42] López, O.; Rach, M.M.; Migallon, H.; Malumbres, M.P.; Bonastre, A.; Serrano, J.J. Monitoring Pest Insect Traps by Means of Low-Power Image Sensor Technologies. Sensors 2012, 12, 15801–15819.
[43] Yang, J.-G.; Wang, F.-L.; Chen, D.-X.; Shen, L.-L.; Qian, Y.-M.; Liang, Z.-Y.; Zhou, W.-C.; Yan, T.-H. Development of a One-Step Immunocapture Real-Time RT-PCR Assay for Detection of Tobacco Mosaic Virus in Soil. Sensors 2012, 12, 16685–16694.
[44] Krzyzanowska, D.; Obuchowski, M.; Bikowski, M.; Rychlowski, M.; Jafra, S. Colonization of Potato Rhizosphere by GFP-Tagged Bacillus subtilis MB73/2, Pseudomonas sp. P482 and Ochrobactrum sp. A44 Shown on Large Sections of Roots Using Enrichment Sample Preparation and Confocal Laser Scanning Microscopy. Sensors 2012, 12, 17608–17619.
[45] Andújar, D.; Weis, M.; Gerhards, R. An Ultrasonic System for Weed Detection in Cereal Crops. Sensors 2012, 12, 17343–17357.
[46] Rach, M.M.; Gomis, H.M.; Granado, O.L.; Malumbres, M.P.; Campoy, A.M.; Martín, J.J.S. On the Design of a Bioacoustic Sensor for the Early Detection of the Red Palm Weevil. Sensors 2013, 13, 1706–1729.
[47] Dhakal, S., Li, Y., Peng, Y., Chao, K., Qin, J., Guo, L., 2014. Prototype instrument development for non-destructive detection of pesticide residue in apple surface using Raman technology. Journal of Food Engineering 2014, 123, 94–103.
[48] McGlone, V.A.; Jordan, R.; Martinsen, P. Vis/NIR estimation at harvest of pre- and post-storage quality indices for ‘Royal Gala’ apple. Postharvest Biology and Technology 2002, 25, 135–144.
Chapter 1. Introduction
NIR spectroscopy of apples belonging to different cultivars. Food Quality and Preference 2003, 14, 473–484.
[50] Billy, L.; Mehinagic, E.; Royer, G.; Renard, C.; Arvisenet, G.; Prost, C.; Jourjon, F. Relationship between texture and pectin composition of two apple cultivars during storage. Postharvest Biology and Technology 2008, 47, 315–324.
[51] Zdunek, A. and Cybulska, J. Relation of Biospeckle Activity with Quality Attributes of Apples. Sensors 2011, 11, 6317-6327.
[52] Lee, W.; Kim, M.; Lee, H.; Delwiche, S.R.; Bae, H.; Kim, D.; Cho, B. Hyperspectral near-infrared imaging for the detection of physical damages of pear. Journal of Food Engineering 2014, 130, 1–7.
[53] Takizawa, K.; Nakano, K.; Ohashi, S.; Yoshizawa, H.; Wang, J.; Sasaki, Y. Development of nondestructive technique for detecting internal defects in Japanese radishes. Journal of Food Engineering 2014, 126, 43–47.
[54] Zhang, B.; Huang, W.; Li, J.; Zhao, C.; Fan, S.; Wu, J.; Liu, C. Principles, developments and applications of computer vision for external quality inspection of fruits and vegetables: A review. Food Research International
2014, 62, 326–343.
[55] Bramley, P., 2002. Regulation of carotenoid formation during tomato fruit ripening and development. Journal of Experimental Botany 53, 2107-2113. [56] Fadilah, N.; Mohamad-Saleh, J.; Abdul Halim, Z.; Ibrahim, H.; Syed Ali,
S.S. Intelligent Color Vision System for Ripeness Classification of Oil Palm Fresh Fruit Bunch. Sensors 2012, 12, 14179–14195.
[57] Aroca, R.V.; Gomes, R.B.; Dantas, R.R.; Calbo, A.G.; Gonçalves, L.M.G. A Wearable Mobile Sensor Platform to Assist Fruit Grading. Sensors 2013, 13, 6109–6140.
[58] Mendoza, F.; Lu, R.; Cen, H. Grading of apples based on firmness and soluble solids content using Vis/SWNIR spectroscopy and spectral scattering techniques. Journal of Food Engineering 2014, 125, 59–68.
Chapter 2
Objectives
The main objective of this thesis is the development of new systems based on image processing techniques focused on automating agricultural tasks in all the phases of the industrial process; pre-harvest, harvest and post-harvest.
It is intended that the developed systems can be used, in the future, in agricultural platforms as part of more complex applications with industrial interest that may contribute to the improvement of management techniques in orchards incrementing benefits and product quality while reducing time and costs.
The specific objectives of this PhD Thesis are:
- To develop new image processing methods in order to detect and count objects at a pre-harvest stage based on the identification of specular reflection peaks from spherical surfaces. The application proposed was an automatic method for counting red grapes from high-resolution images of vineyards taken under artificial lighting at night.
Chapter 2. Objectives
32
- To develop novel image processing methods based on the use of color information in order to verify objects and improve fruit quality at post-harvest stage. The application proposed was to develop an in-line automatic and individual nectarine variety verification in a fruit-packing line by comparing a feature histogram vector computed from the central part of the skin of the nectarines processed.
Chapter 3
PhD Thesis structure
The development of this PhD Thesis has been performed in the Research Line of Signal Processing and Robotics of the INSPIRES UdL group (Institut Politècnic d’Innovació i Recerca en Sostenibilitat, centre de recerca de la Universitat de Lleida) and under the UdL-IMPULS project.
This thesis proposes the use of image processing techniques that contribute to the development of new technologies to automate agricultural applications, leading to an improvement of management operations in all phases of the agricultural industry. Four different agricultural applications were developed and proposed as the basis of this work according to the needs or problems to be solved identified by farmers.
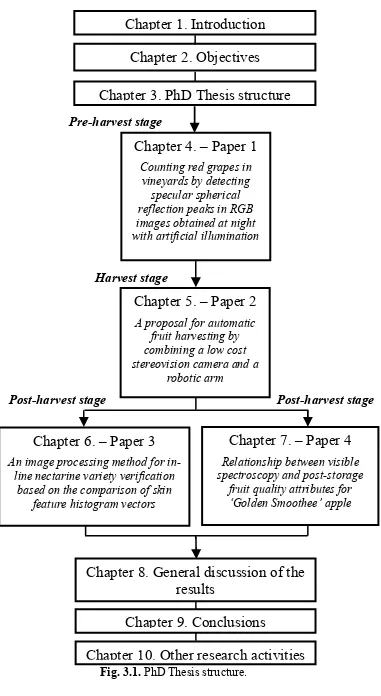
This PhD Thesis is structured in four chapters and four SCI papers; three of them were already published in SCI/Q1 journals and the last paper is currently under revision in a SCI/Q1 journal. Figure 3.1 shows the structure of the PhD Thesis. The referenced papers are:
- Font, D.; Pallejà, T.; Tresanchez, M.; Teixidó, M.; Martinez, D.; Moreno, J.; Palacín, J. Counting red grapes in vineyards by detecting specular spherical reflection peaks in RGB images obtained at night with artificial illumination. Computers and Electronics in Agriculture (journal indexed as Q1) 2014, 108, 105-111.
Chapter 3. PhD Thesis structure
34
combining a low cost stereovision camera and a robotic arm. Sensors
(journal indexed as Q1) 2014, 14, 11557-11579.
- Font, D.; Tresanchez, M.; Pallejà, T.; Teixidó, M.; Martinez, D.;
Moreno, J.; Palacín, J. An image processing method for in-line
nectarine variety verification based on the comparison of skin feature
histogram vectors. Computers and Electronics in Agriculture (journal
indexed as Q1) 2014, 102, 112–119.
- Font, D.; Teixidó, M.; Tresanchez, M.; Martínez, D.; Moreno J.; Graell
J.; Lara, I.; Palacín, J. Assessment of the correlation between
post-storage fruit quality parameters and visible spectra of the skin for
‘Golden Smoothee’ apple. Submitted to Journal of Food Engineering
(journal indexed as Q1), July 2014.
The chapters represent the different stages of the agricultural industrial
process; pre-harvest, harvest and post-harvest. The first paper, presented in
Chapter 4, is focused on counting red grapes in vineyards by detecting specular
spherical reflection peaks in RGB images obtained at night with artificial
illumination. The counting of agricultural element is essential for yield estimate at
pre-harvest stage. The proposal of the second paper, presented in Chapter 5, is the
development of an automatic fruit harvesting system by combining a low cost
stereovision camera and a robotic arm. This operation is crucial at harvest stage.
The third and fourth papers, presented in Chapter 6 and 7 respectively, are
focused on solving problems at post-harvest stage with the aim of enhancing fruit
quality, which can affect consumer acceptance. In Chapter 6 an image processing
method for in-line nectarine variety verification based on the comparison of skin
feature histogram vectors is presented, whereas in Chapter 7 the correlation
between post-storage fruit quality attributes and the visible spectra of the skin of
Chapter 3. PhD Thesis structure
Fig. 3.1. PhD Thesis structure.
Chapter 1. Introduction
Chapter 2. Objectives
Chapter 3. PhD Thesis structure
Chapter 6. – Paper 3
An image processing method for in-line nectarine variety verification
based on the comparison of skin feature histogram vectors
Chapter 9. Conclusions
Chapter 10. Other research activities
Chapter 8. General discussion of the
results
Chapter 7. – Paper 4
Relationship between visible spectroscopy and post-storage
fruit quality attributes for ‘Golden Smoothee’ apple
Post-harvest stage
Pre-harvest stage
Post-harvest stage
Chapter 4. – Paper 1
Counting red grapes in vineyards by detecting
specular spherical reflection peaks in RGB images obtained at night with artificial illumination
Chapter 5. – Paper 2
A proposal for automatic fruit harvesting by combining a low cost stereovision camera and a
Chapter 4
Image processing method applied to
locate agricultural elements at
pre-harvest stage: counting red grapes
4.1. Introduction
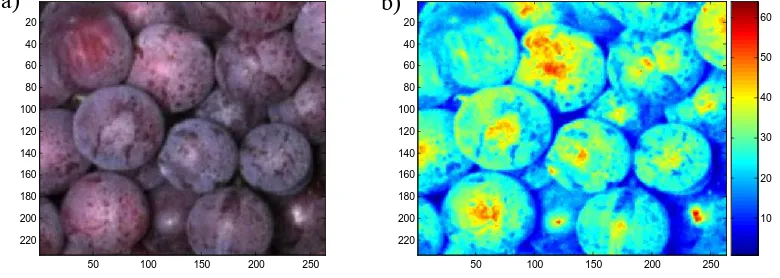
This chapter proposes an image processing method based on detecting
intensity peaks from spherical objects. The paper presented in this chapter
proposed the design of a new procedure used at pre-harvest stage in order to count
the number of grapes in vineyard images obtained at night under artificial
lighting. The new contribution of this paper was to use the artificial lighting to
detect the specular reflection peaks originated in the spherical surface of the
grapes. Fig. 4.1 shows the specular reflection peaks detection. Fig. 4.1-a shows a
detail of an original vineyard image whereas Fig. 4.1-b shows a representation of
the normalized grayscale image, where the hot spots originated by the specular
spherical reflection on the grapes are highlighted.
Yield prediction is a topic of special interest in precision agriculture because it
leads to an improvement of management operations in orchards. Currently yield
prediction is an inaccurate, time-consuming and expensive operation since it is
performed manually by counting the number of individual fruits. Tasks focused
on counting elements in agriculture are being automated due to the application of
Chapter 4. Image processing method applied to locate agricultural elements at pre-harvest stage: counting red grapes
38
to be more efficient, faster, and less prone to inconsistencies. However, there are
factors such as environmental conditions, crop properties, occlusions and lighting
that affect the automatic counting task.
50 100 150 200 250
20 40 60 80 100 120 140 160 180 200 220
50 100 150 200 250
[image:51.595.69.459.158.297.2]20 40 60 80 100 120 140 160 180 200 220 10 20 30 40 50 60
Fig 4.1. Sample of specular reflection: (a) original vineyard image; (b) normalized grayscale
image.
4.2. Contributions to the state of the art
Precision agriculture is a broad and promising area demanding technological
solutions with the aim of increasing production in orchards. One of the topics
addressed by precision agriculture is the counting of different agricultural
elements in images which can be very challenging depending on the scenario and
type of element.
Agricultural research has been focusing on developing algorithms to count
agricultural elements, mainly vegetables and fruits [1-7] in order to estimate the
production. The easiest scenario to automatically count fruits and vegetables in
situ is when they are isolated elements of considerable dimensions. The proposal
of [1] was to count kiwifruit using the CIELab color space by finding the peaks
originated on the surface of the elements. Two automatic algorithms were
proposed to identify the peaks on the surface of the fruit. The first used a gray
color image whereas the second was based on a transformed image used to
estimate the distance from each pixel belonging to the fruit to the nearest
background pixel. The results showed good accuracies for gold (90%) and green
(70%) varieties of kiwi. Alternatively, in [2] a counting method based on
identifying fruit pixels in images was proposed. The methodology used was to b)
Chapter 4. Image processing method applied to locate agricultural elements at pre-harvest stage: counting red grapes
connect fruit pixels into sets, then the contours of these sets were segmented and
finally, an apple model was created by using the definition of the contours. The
conclusion obtained was that the technique proposed was not robust to lighting
changes but it achieved a success rate from 85% up to 95%. In [3] mango fruit
from orchard images were counted. The technique applied was to segment the
pixels of the images into two groups, fruit and background, by means of color and
texture information. Then, the resultant blobs were identified to count the number
of fruits in the image. The automatic results were correlated with a manual
counting achieving a strong correlation of 0.91. More recently, in [4] another
mango counting approach was proposed. The mango counting procedure was
based on combining an altered color matching with a Hessian filtering applied to
images taken at night under controlled lighting. Alternatively, in [5] a method for
identifying and counting fruits from images acquired in cluttered greenhouses was
presented. The automatic method was based on applying bag-of-words model and
statistical approaches. The results showed a strong correlation, 94.6%, between
the automatic and manual counting data.
The automatic counting in the case of grapes is a challenging task due to the
difficulty of distinguishing the grapes from the background as a consequence of
occlusions and the similarities in color. In addition, the grapes belonging to
different clusters have different scales, and the changes in lighting can also affect
the visibility of the fruit since it produces reflections and shadows. For example,
in [6] a method for counting grapes based on the application of a radial symmetry
transform was used in order to estimate yield. The results showed a good yield
accuracy estimation with only an error of 9.8%. The proposal of [7] was to design
a counting method based on the computation of the correlation between the
Gaussian profile and the neighborhood of each pixel to obtain a correlation map,
which was segmented and filtered.
4.3. References
[1] Wijethunga, P.; Samarasinghe, S.; Kulasiri, D.; Woodhead, I. Digital Image
Chapter 4. Image processing method applied to locate agricultural elements at pre-harvest stage: counting red grapes
40
Conference Image and Vision Computing 2008, New Zealand, Christchurch,
pp. 1-6.
[2] Linker, R.; Cohen, O.; Naor, A. Determination of the number of green apples
in RGB images recorded in orchards. Computers and Electronics in
Agriculture 2012, 81, 45–57.
[3] Payne, A.B.; Walsh, K.B.; Subedi, P.P.; Jarvis, D. Estimation of mango crop
yield using image analysis – Segmentation method. Computers and
Electronics in Agriculture 2013, 91, 57–64.
[4] Payne, A.; Walsh, K.; Subedi, P.; Jarvis, D. Estimating mango crop yield
using image analysis using fruit at ‘stone hardening’ stage and night time
imaging. Computers and Electronics in Agriculture 2014, 100, 160–167.
[5] Song, Y.; Glasbey, C.A.; Horgan, G.W.; Polder, G.; Dieleman, J.A.; van der
Heijden, G.W.A.M. Automatic fruit recognition and counting from multiple
images. Biosystems Engineering 2014, 118, 203-215.
[6] Nuske, S.; Achar, S.; Bates, T.; Narasimhan, S.; Singh, S. Yield Estimation in
Vineyards by Visual Grape Detection. IEEE/RSJ International Conference on
Intelligent Robots and Systems 2011, San Francisco, CA, USA.
[7] Grossetête, M.; Berthoumieu, Y.; Da Costa, J.P.; Germain, C.; Lavialle, O.;
Grenier, G. Early estimation of vineyard field: site specific counting of
berries by using a smartphone. International Conference of Agricultural
Pages from 41 to 52 contain the following paper:
D. Font, T. Pallejà, M. Tresanchez, M. Teixidó, D. Martinez, J. Moreno, J. Palacín. “Counting red grapes in vineyards by detecting specular spherical reflection peaks in RGB images obtained at night with artificial illumination,”
Computers and Electronics in Agriculture 108 (2014) 105–111.
53
Chapter 5
Image processing method applied to
estimate size, distance and position of
fruits at harvest stage: automatic fruit
harvesting
5.1. Introduction
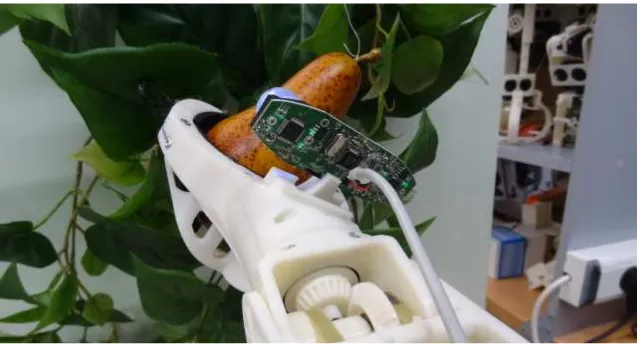
This chapter proposes the development of an automatic fruit harvesting system
by combining a low cost stereovision camera and a robotic arm. The stereovision
camera was placed in the gripper tool of the robotic arm and had two
functionalities: 1) to estimate the size, distance and position of the fruits and 2) to
guide the automatic pickup of specific targets. The robotic arm was used as a
mechanic device to perform the pickup of the fruits. Fig. 5.1 shows a fruit pickup
performed in laboratory conditions using a pear as a target.
Agricultural industry is investing on automating agricultural tasks and the
automation of harvesting operations is crucial at harvest stage. The development
of a harvesting system is a complicated task that requires the accomplishment of
smaller operations such as the automatic detection and localization of fruits, the
estimation of fruit parameters (size, relative location and orientation) [1-3], and
finally the control of the mechanic device by considering a non-stressing pickup
Chapter 5. Image processing method applied to estimate size, distance and position of fruits at harvest stage: automatic fruit harvesting
Fig. 5.1. Stereovision camera placed in the gripper of the robotic arm.
5.2. Contributions to the state of the art
The accurate detection of fruits in trees is an essential step for automating
harvest operations. This task can be approached with different strategies such as
the use of a monocular camera attached to a gripper tool [6] or the use of a
monocular camera and a stepper motor [7] in order to control a mechanical
pickup. In [6], the distance between the camera and the fruit was estimated by
measuring the dimensions of the fruit when locating the camera at different
positions with a known distance between the two objects. The next step was to
match the center of the fruit with the center of the image in order to align the
gripper tool with the fruit. In [7] a monocular camera in combination with a
stepper motor, which was used as a displacement device, were used to generate
depth maps with the aim of reconstructing 3D natural scenes.
Another alternative is the use of stereovision systems [8]. The main problem is
to correlate the same information in two different images taken from different
perspectives but over the same region or element. In most cases, this is solved by
identifying the targets on the images and then, computing their centroids to
compute the distance of the element. However, this methodology is dependent on
geometric camera nonlinearities that can be removed or decreased by performing
camera calibrations. The proposal of [9] was to implement a real-time stereovision
Chapter 5. Image processing method applied to estimate size, distance and position of fruits at harvest stage: automatic fruit harvesting
55 segment the object and then, to apply a connected component analysis and a blob
extraction technique with the final objective of estimating the distance and size of
the object. In [10], two different stereovision techniques applied to apple-picking
robots were compared. The first technique was based on attaching a target to the
apples (manual operation) and the second system consisted of computing the
centroid of the segmented fruit (automatic operation) in order to estimate the
distance. The results showed an error in the distance estimate of 0.63% and 3.54%
in the first and the second techniques, respectively.
Stereovision systems are also applied to control robotized systems such as
robotic arms. However, in the literature there are very few works focused on
applying stereovision systems to develop fruit harvest operations. Some of these
examples are described in [11, 12]. In [11] a stereovision system was
implemented as part of a robotized platform in order to locate fruits and to correct
the trajectory of the robotic arm when harvesting fruits. The approach was studied
in laboratory conditions with simulated scenarios. In [12] the combination of a
fixed camera and a camera placed in the gripper tool of the robotic arm was
proposed for automatic harvest of citrus. A vision-based estimation and control
system was developed for robotic fruit harvesting whereas keeping the stability
and performances of the closed-loop system.
5.3. References
[1] Teixidó, M.; Font, D.; Pallejà, T.; Tresanchez, M.; Nogués, M.; Palacín, J. An
Embedded Real-Time Red Peach Detection System Based on an OV7670
Camera, ARM Cortex-M4 Processor and 3D Look-Up Tables. Sensors 2012,
12, 14129–14143.
[2] Teixidó, M.; Font, D.; Pallejà, T.; Tresanchez, M.; Nogués, M.; Palacín, J.
Definition of Linear Color Models in the RGB Vector Color Space to Detect
Red Peaches in Orchard Images Taken under Natural Illumination. Sensors
![Fig. 1.1. (a) ARP system [7]; (b) Prototype soil strength sensor [8].](https://thumb-us.123doks.com/thumbv2/123dok_es/5217011.94886/27.595.71.474.559.717/fig-arp-b-prototype-soil-strength-sensor.webp)
![Fig. 1.2. Multisensory platform [14].](https://thumb-us.123doks.com/thumbv2/123dok_es/5217011.94886/29.595.88.485.84.270/fig-multisensory-platform.webp)
![Fig. 1.3. (a) Weed control prototype [34]; (b) LAI prediction by using LIDAR sensors mounted on a tractor [36]](https://thumb-us.123doks.com/thumbv2/123dok_es/5217011.94886/33.595.92.444.85.254/weed-control-prototype-prediction-lidar-sensors-mounted-tractor.webp)
![Fig. 1.4. Ground-based ultrasonic system [45].](https://thumb-us.123doks.com/thumbv2/123dok_es/5217011.94886/34.595.253.419.482.603/fig-ground-based-ultrasonic-system.webp)
![Fig. 1.5. Glove-based system prototype for measuring fruit attributes [57].](https://thumb-us.123doks.com/thumbv2/123dok_es/5217011.94886/36.595.141.513.376.471/fig-glove-based-prototype-measuring-fruit-attributes.webp)