ADVERTIMENT. La consulta d’aquesta tesi queda condicionada a l’acceptació de les següents
condicions d'ús: La difusió d’aquesta tesi per mitjà del servei TDX (www.tesisenxarxa.net) ha estat autoritzada pels titulars dels drets de propietat intel·lectual únicament per a usos privats emmarcats en activitats d’investigació i docència. No s’autoritza la seva reproducció amb finalitats de lucre ni la seva difusió i posada a disposició des d’un lloc aliè al servei TDX. No s’autoritza la presentació del seu contingut en una finestra o marc aliè a TDX (framing). Aquesta reserva de drets afecta tant al resum de presentació de la tesi com als seus continguts. En la utilització o cita de parts de la tesi és obligat indicar el nom de la persona autora.
ADVERTENCIA. La consulta de esta tesis queda condicionada a la aceptación de las siguientes
condiciones de uso: La difusión de esta tesis por medio del servicio TDR (www.tesisenred.net) ha sido autorizada por los titulares de los derechos de propiedad intelectual únicamente para usos privados enmarcados en actividades de investigación y docencia. No se autoriza su reproducción con finalidades de lucro ni su difusión y puesta a disposición desde un sitio ajeno al servicio TDR. No se autoriza la presentación de su contenido en una ventana o marco ajeno a TDR (framing). Esta reserva de derechos afecta tanto al resumen de presentación de la tesis como a sus contenidos. En la utilización o cita de partes de la tesis es obligado indicar el nombre de la persona autora.
WARNING. On having consulted this thesis you’re accepting the following use conditions:
PhD thesis
A hydrogeological approach in urban
underground infrastructures
by Alejandro Serrano Juan
Advisors
Enric Vazquez Suñé Estanislao Pujades Garnes
Institute of Environmental Assessment and Water Research (IDAEA), CSIC
« Per fer les coses bé cal: primer, l'amor, segon, la tècnica. »
Summary
The competition for space in urban areas due to an exponential growth of population makes underground engineering plays a crucial role in the development of cities. New urban planning concepts, technology advances and innovative construction capabilities condition the implementation of larger and more highly efficient infrastructures. These urban underground infrastructures deal with variables such as cost, duration, safety, and management; faces political, social, economic and environmental issues; and guarantees future sustainability, maintenance, and energy efficiency. To do so, all these concepts and variables must be kept in mind during the whole construction process: (I) project design, (II) project construction and (III) project exploitation. This thesis aims to demonstrate how the construction cycle deals with the various impacts produced by the interaction of underground constructions with groundwater at each stage of the process, with a view to providing improved processes.
the minimum legal requirement to characterize the ground: a pumping test. Therefore, there is a need to provide the constructors with a set of methods and tools to allow them to increase the quality of their hydrogeological analysis, which will allow early detection problems associated with the groundwater.
The interaction of underground constructions with groundwater generates impacts. These impacts can usually be minimized by using mitigation measures. The most common impacts caused by underground constructions are the groundwater barrier effect (impact on the groundwater) and the groundwater pressure distribution and limitation under the bottom slab (impact in the underground construction). In the literature there are many examples and designs to mitigate both groundwater barrier effect and groundwater pressure distribution and limitation under the bottom slab. However, to the author’s knowledge, there is no design that integrates both solutions. Since it is illogical to design a solution without considering all the factors involved in the problem, all mitigation measures depending on or affecting the groundwater head should consider the groundwater head variation caused by the affection of other mitigation measures. This thesis presents an innovative groundwater by-pass design that enables the groundwater to flow through the structure and provide a homogenous distribution of the water pressure under the bottom slab. The new integrated design was applied to the largest underground infrastructure of Barcelona: La Sagrera railway station. A hydrogeological model was implemented to test the original and the integrated designs in three different scenarios. This new solution mitigates the groundwater barrier effect and optimizes the bottom slab, considerably reducing the costs and increasing safety during the construction phase.
During the construction (stage II) a great amount of new data is generated. Monitoring is required when dewatering underground constructions in order to anticipate unexpected events and preserve nearby existing structures and/or buildings. The most accurate and spread monitoring method to measure displacements is levelling, a point-like surveying technique that typically allows for tens of discrete in-situ sub-millimetric measurements per squared kilometer. Another emerging technique for mapping soil deformation is the Interferometric Synthetic Aperture Radar (InSAR), which is based on SAR images acquired from orbiting satellites or by ground-based stations (GB-SAR). This remote sensing technique can provide better spatial point density than levelling, more extensive spatial coverage and cheaper acquisitions. Both satellite and ground-based SAR systems have been used and tested in a variety of analyses. However, nobody has applied this technology as a monitoring tool during construction works yet.
Resum
Degut al creixement exponencial de la població i tenint en compte que l’espai dins les àrees urbanes és finit és necessari la construcció d’infraestructures subterrànies. L'execució d'infraestructures més grans i eficients és possible gràcies als nous conceptes en planificació urbana i a l’avenç tecnològic en la construcció. No obstant això, variables com el cost, la durada, la seguretat i la gestió; els problemes polítics, socials, econòmics i ambientals; garantir la sostenibilitat futura, el manteniment i l'eficiència energètica, fan d'aquesta execució un problema complex. Per això, totes aquestes variables han d'estar presents durant totes les fases del procés constructiu: (I) fase de disseny, (II) fase de construcció, i (III) fase d’explotació. Les construccions subterrànies interactuen amb el medi subterrani, el resultat de la interacció són uns impactes en la construcció i en el medi ambient. Tots aquests impactes són avaluats al llarg del procés constructiu per tal de ser corregits o minimitzats. L’objectiu principal d’aquesta tesi és conèixer com s’avaluen els diferents impactes a cadascuna de les fases del procés constructiu per poder així proposar millores.
d'infraestructures subterrànies ja que la majoria de les construccions caracteritzen el terreny únicament amb una prova de bombament. Per tant, és necessari proporcionar als constructors un conjunt de mètodes i d'eines que permetin augmentar la qualitat dels seus anàlisis (com per exemple les proves de bombament), per augmentar així la detecció primerenca de problemes associats a les aigües subterrànies.
La interacció de les construccions subterrànies amb les aigües subterrànies genera impactes. Aquests impactes es poden minimitzar mitjançant l'ús de mesures de mitigació. Els impactes més comuns causats per construccions subterrànies són l'efecte barrera (impacte en les aigües subterrànies) i la distribució i limitació de subpressions sota la llosa de fons (impacte en la construcció subterrània). A la literatura hi ha molts dissenys que permeten mitigar l'efecte barrera i millorar la distribució de les subpressions sota la llosa de fons. No obstant això, no hi ha cap disseny que integri les dues solucions. És il·lògic dissenyar una mesura correctora sense tenir en compte tots els factors que intervenen en el problema. Aquesta tesi presenta un disseny innovador per bypassar les aigües subterrànies a través de l'estructura proporcionant una distribució homogènia de les subpressions sota la llosa de fons. El nou disseny s'ha aplicat en la infraestructura subterrània més gran de Barcelona: la futura estació de tren de la Sagrera. S'ha realitzat un model hidrogeològic per provar els nous dissenys en tres escenaris diferents. Aquesta nova solució minimitza l'efecte barrera de les aigües subterrànies i optimitza la llosa de fons, reduint considerablement els costos i augmentant la seguretat durant la fase de construcció.
Durant la construcció de les infraestructures (fase II) es generen una gran quantitat de dades. Quan una construcció rebaixa el nivell freàtic cal auscultar els nivells i la deformació del terreny per tal d'anticipar esdeveniments inesperats i preservar les estructures i / o edificis propers existents. El mètode actual més utilitzat per mesurar desplaçaments en el terreny és l'anivellament, una tècnica que permet avaluar in situ desenes de punts discrets amb una precisió submil·limètrica. Una tècnica emergent per mesurar la deformació del sòl és el Radar d'Obertura Sintètica Interferomètrica (InSAR), que es basa en imatges SAR adquirides des de satèl·lits en òrbita o bé des d'estacions al terra (GB-SAR). Aquesta tècnica de detecció remota proporciona una major cobertura espacial i més econòmica que els mètodes d'auscultació tradicionals. Tot i que la tecnologia SAR s'ha utilitzat i validat en una gran varietat d'anàlisis, ningú ha aplicat encara aquesta tecnologia com a eina d'auscultació durant la construcció d'infraestructures.
Resumen
La limitación de espacio en áreas urbanas junto al crecimiento exponencial de la población, hace necesaria la construcción de infraestructuras subterráneas. Nuevos conceptos en planificación urbana junto con los avances tecnológicos en la construcción hacen posible la ejecución de infraestructuras más grandes y de más eficiencia. No obstante, variables tales como el coste, la duración, la seguridad y la gestión; los problemas políticos, sociales, económicos y ambientales; y garantizar la sostenibilidad futura, el mantenimiento y la eficiencia energética, hacen de esta ejecución un problema complejo. Por ello, todas estas variables deben estar presentes durante todo el proceso constructivo: (I) diseño del proyecto, (II) construcción del proyecto y (III) explotación del proyecto. Esta tesis tiene como objetivo principal saber cómo el ciclo constructivo (diseño del proyecto, construcción y explotación de proyectos) procesa las problemáticas inducidas por la interacción de las nuevas infraestructuras subterráneas urbanas con las aguas subterráneas para luego mejorarlo.
proyectos de infraestructuras subterráneas ya que es común que la mayoría de las construcciones sólo se realice una prueba de bombeo para caracterizar el subsuelo. Por lo tanto, hay una necesidad de proporcionar un conjunto de métodos y de herramientas a los constructores para que puedan aumentar la calidad de su análisis (como pruebas de bombeo), para aumentar así la detección temprana de problemas asociados a las aguas subterráneas.
La interacción de las construcciones subterráneas con las aguas subterráneas genera impactos. Estos impactos generalmente pueden minimizarse mediante el uso de medidas correctoras. Los impactos más comunes causados por las construcciones subterráneas son el efecto barrera (impacto en las aguas subterráneas) y la distribución y limitación de subpresiones bajo la losa de fondo (impacto en la construcción subterránea). En la literatura hay muchos ejemplos de diseños para mitigar tanto el efecto barrera y como para mejorar la distribución de las subpresiones bajo la losa de fondo. Sin embargo, no hay ningún diseño que integre ambas soluciones. Es ilógico diseñar una medida correctora sin tener en cuenta todos los factores que intervienen en el problema. Esta tesis presenta un diseño innovador de by-pass para las aguas subterráneas que permite el flujo de agua subterránea a través de la estructura a la vez que proporciona una distribución homogénea de las subpresiones bajo la losa de fondo. El nuevo diseño se ha aplicado en la infraestructura subterránea más grande de Barcelona: la futura estación de tren de La Sagrera. Se ha realizado un modelo hidrogeológico para probar los nuevos diseños en tres escenarios diferentes. Esta nueva solución mitiga el efecto barrera de las aguas subterráneas y optimiza la losa de fondo, lo que reduce considerablemente los costes y aumenta la seguridad durante la fase de construcción.
Durante la construcción (fase II) se genera una gran cantidad de nuevos datos. Es necesario auscultar los niveles y la deformación del terreno cuando una construcción rebaja el freático con el fin de anticiparse a acontecimientos inesperados y a preservar las estructuras y / o edificios cercanos existentes. El método actual más usado para medir desplazamientos en el terreno es la nivelación, una técnica que permite evaluar in situ decenas de puntos discretos con una precisión sub-milimétrica. Una técnica emergente para medir la deformación del suelo es el Radar de Apertura Sintética Interferométrica (InSAR), que se basa en imágenes SAR adquiridas o bien desde satélites en órbita o bien desde estaciones en tierra (GB-SAR). Esta técnica de detección remota proporciona una mayor cobertura espacial y más barata que los métodos de auscultación tradicionales. Aunque la tecnología SAR se ha utilizado y validado en una gran variedad de análisis, nadie ha aplicado esta tecnología como una herramienta de auscultación durante la construcción de infraestructuras.
Acknowledgements
First and foremost, I want to thank my advisors, Enric Vázquez and Estanislao Pujades for their continuous support, for their guidance, their patience, for responding fast when I needed them, for pushing me to become better, for all that they have taught me. Thanks for bringing me the opportunity to enjoy my PhD.
Half of my thesis is the results of the collaboration with the Centre Tecnològic de Telecomunicacions de Catalunya (CTTC). Special thanks to Michele Crosetto and Oriol Monserrat, who had the patience to teach me all I know about SAR. Thank you time and your trust. Working with you has been a pleasure.
I would also acknowledge ADIF (Administration), INECO (Construction Management), AudingIntraesa-Ayesa-Cicsa (technical assistance) and Dragados-Acciona-Comsa-Acsa (construction companies) for their support throughout this thesis. Special thanks to Alejandro Lopez, Ingrid Pujol and Carlos Puig.
A mi familia…
Con un afecto especial quiero dar las gracias a mis padres y a mi hermana. Vuestro apoyo incondicional ha sido, y aún es, un faro que me muestra que puedo ser mejor cada día, tanto en lo profesional como en lo personal. Gracias!
Aquest temps no he caminat sol. He anat de la mà de la meva preciosa dona Anna, a qui estimo incondicionalment. Ella m’ha donat l’estabilitat emocional i l’amor necessari per fer d’aquests últims anys els millors de la meva vida. Gràcies bonica per ser com ets. Anna, aquesta tesi te la dedico a tu, perquè, a l’igual
List of Contents
1.1. MOTIVATION AND OBJECTIVES ... 1
1.2. THESIS OUTLINE ... 6
2.1. INTRODUCTION ... 9
2.2. METHODOLOGY ... 11
2.2.2. The Updating Approach ... 12
2.3. APPLICATION EXAMPLES ... 15
2.3.1. MIX 2.0 ... 15
2.3.2. Other examples ... 18
2.3.3. Reused software validation ... 20
2.4. SYSTEM REQUIREMENTS AND PROGRAM AVAILABILITY ... 21
2.5. SUMMARY AND CONCLUSIONS ... 21
3.1. INTRODUCTION ... 23
3.2. MATERIALSANDMETHODS ... 28
3.2.1. Geographical, geological, and hydrogeological description ... 28
3.2.2. Basic concepts: Groundwater barrier effect. ... 30
3.2.3. Problem statement ... 31
3.2.3.1. Groundwater By-pass ... 31
3.3. NEWINTEGRATEDDESIGN ... 33
3.3.1. Integrated Design description ... 33
3.3.1.1. Design 1: Artesian wells drilled inside the retaining walls ... 33
3.3.1.1. . Design 2: Artesian wells drilled outside the retaining walls ... 33
3.3.2. Numerical model ... 35
3.3.1. Scenario simulation ... 36
3.4. RESULTS ... 38
3.1. DISCUSSION AND CONCLUSIONS ... 41
4.1. INTRODUCTION ... 45
4.2. PROBLEMSTATEMENTANDGB-SAREXPERIMENTDESIGN ... 47
4.2.1. GB-SAR BASICS ... 47
4.2.2. LA SAGRERA STATION EXCAVATION AREA ... 49
4.2.2.1. General situation ... 49
4.2.2.2. Geological and hydrogeological settings ... 50
4.2.2.3. Construction characteristics ... 53
4.2.3. EXPERIMENT SETUP ... 53
4.2.3.1. Pumping test ... 54
4.2.3.2. GB-SAR location ... 54
4.2.3.1. GB-SAR measurements ... 55
4.2.3.2. Other measurements ... 56
4.2.3.3. Hydrogeological and hydromechanical numerical models ... 56
4.3. RESULTSANDDISCUSSION ... 56
5.1. INTRODUCTION ... 63
5.2. MATERIALSANDMETHODS ... 65
5.2.1. Geographical, geological and hydrogeological description ... 65
5.2.2. Construction characteristics ... 67
5.2.3. Levelling ... 67
5.2.4. InSAR ... 68
5.2.5. Calculation of the pumping settlements (numerical model and analytical equations) ... 68
5.3. RESULTS AND DISCUSSION ... 70
5.3.1. Levelling ... 70
5.3.2. InSAR ... 72
5.3.1. Levelling vs. InSAR ... 73
5.4. CONCLUSIONS ... 76
6.1. SUPPLEMENTARY MATERIAL CHAPTER 2 ... 81
6.2. SUPPLEMENTARY MATERIAL CHAPTER 3 ... 84
6.3. SUPPLEMENTARY MATERIAL CHAPTER 4 ... 87
6.4. SCIENTIFIC ARTICLES ... 107
6.5. BOOK CHAPTERS ... 110
6.6. PROCEEDINGS ... 111
6.7. SOFTWARE REGISTRATION ... 112
6.8. PROJECTS DEVELOPED AND RELATED WITH THE THESIS ... 114
6.8.1. Public Research Projects ... 114
List of Figures
FIGURE 1.MODIFICATION OF THE “MACLEAMY CURVE” WHICH ILLUSTRATES THE CONCEPT OF MAKING DESIGN DECISIONS EARLIER IN THE PROJECT WHEN OPPORTUNITY TO INFLUENCE POSITIVE OUTCOMES IS MAXIMIZED AND THE COST OF CHANGES MINIMIZED,
ESPECIALLY AS REGARDS THE DESIGNER AND DESIGN CONSULTANT ROLES. ... 5 FIGURE 2.DECISION FLOW DIAGRAM:PROGRAMMING STEPS. ... 14 FIGURE 3.COMPARISON BETWEEN THE OLD MIX INPUT FILE (TOP) AND THE NEW MIX V2013 INPUT DYNAMIC TABLE (DOWN). .. 17 FIGURE 4.COMPARISON BETWEEN THE OLD MIX OUTPUT FILE (WITH MORE THAN 6.000 LINES)(LEFT) AND THE NEW MIX V2013 OUTPUT GUI(PIE PLOTS, DATA REARRANGEMENT AND SCATTER PLOTS)(RIGHT). ... 18 FIGURE 5.FLOW DIAGRAM PATHS FOLLOWED BY EACH OF THE PRESENTED CASE STUDIES:EASYQUIM,EASYBAL,MIX AND BRINEMIX. ... 20 FIGURE 6.BOTTOM SLAB WATER PRESSURE DISTRIBUTION SCHEME.(1) STATES THE PROBLEM,(2) SHOWS A POSSIBLE SOLUTION. 24 FIGURE 7.GROUNDWATER BARRIER EFFECT SCHEME.(1) STATES THE PROBLEM,(2) SHOWS A POSSIBLE SOLUTION. ... 25 FIGURE 8GROUNDWATER BY-PASS DESIGNS.(1)REMOVAL OF CUT-OFF WALL,(2) INTAKE AND RECHARGE PIPES INSTALLED IN DRILLED
HOLE,(3) INTAKE AND RECHARGE THROUGH PERMEABLE CUT-OFF WALLS, AND (4) INTAKE AND RECHARGE WELLS.MODIFIED
FIGURE FROM AKAGI,2004.NOT TO SCALE. ... 26 FIGURE 9.THIS FIGURE SHOWS HOW THE BOTTOM SLAB WATER PRESSURE DISTRIBUTION AND THE GROUNDWATER BARRIER EFFECT
FIGURE 10.GEOGRAPHICAL LOCATION OF THE STUDY SITE. ... 28
FIGURE 11.DETAILED GEOLOGICAL PROFILE OF THE SITE.(1)PLAN VIEW OF THE GEOLOGICAL BASEMENT,(2)CROSS SECTION A-B, (3)CROSS SECTION C-D.EXCAVATION AREA, LIMITED BY DIAPHRAGM WALLS, IS SHOWN IN LIGHT BROWN COLOR.BOTH CROSS SECTIONS SHOW THE MAXIMUM EXCAVATION AND THE REQUIRED DEWATERING SYSTEM. ... 29
FIGURE 12. CROSS SECTION OF A THEORETICAL AQUIFER WITH A STRUCTURE REDUCING ITS NATURAL TRANSMISSIVITY. GROUNDWATER BARRIER EFFECT SCHEME.MODIFIED FROM PUJADES,2012. ... 30
FIGURE 13.ORIGINAL DESIGN SCHEME.(1)PLAN VIEW.(2)CROSS SECTION.BOTTOM SLAB ... 32
FIGURE 14.INTEGRATED DESIGNS SCHEME.(1)PLAN VIEW.(2)CROSS SECTION. ... 34
FIGURE 15.NUMERICAL MODEL MESH AND BOUNDARY CONDITIONS. ... 37
FIGURE 16.(1)DETAILED WATER TABLE LOCATION FOR EACH SCENARIO.(2)DESIGNS AND SCENARIO EVALUATION. ... 37
FIGURE 17.SIMULATION RESULTS:WATER HEADS (IN M.A.S.L.) FOR EACH SCENARIO AND DESIGN. ... 39
FIGURE 18.SIMULATION RESULTS:WATER PRESSURE (IN M.W.P.) FOR EACH SCENARIO AND DESIGN. ... 40
FIGURE 19.ILLUSTRATION OF HANS MELLER TO EMPHASIZE DIVERGENCE IN INTERPRETATIONS. ... 46
FIGURE 20.GROUND-BASED SAR IMAGES TREATMENT.THE PHYSICS AND THE MATHEMATICS. ... 48
FIGURE 21.GEOGRAPHICAL LOCATION OF THE STUDY SITE.THE YELLOW WELLS ARE THE ONES ACTIVATED DURING THE PUMPING TEST. ... 49
FIGURE 22.SOIL AND EXCAVATION PROFILE CORRESPONDING TO THE TRANSVERSE SECTION A6(SEE FIGURE 25 TO LOCATE THE SECTION) AT THE TIME OF THE EXPERIMENT. A6 IS ALSO THE TRANSVERSE SECTION OF THE HYDROMECHANICAL MODEL ©PLAXIS. ... 51
FIGURE 23.DETAILED GEOLOGICAL PROFILE OF THE SITE.(1)PLAN VIEW OF THE GEOLOGICAL BASEMENT,(2)CROSS SECTION A-B, (3)CROSS SECTION C-D.EXCAVATION AREA, LIMITED BY DIAPHRAGM WALLS, IS SHOWN IN LIGHT BROWN COLOR.BOTH CROSS SECTIONS SHOW THE MAXIMUM EXCAVATION AND THE REQUIRED DEWATERING SYSTEM. ... 52
FIGURE 24.SCHEME OF THE EXPERIMENT AND THE EXPECTED WALL DEFORMATION. ... 54
FIGURE 25. RADAR POSITION, GB-SAR ANALYSIS AREA, MANUAL ACQUISITION DATA TARGETS (BLUE CIRCLES, MON) AND INCLINOMETERS (YELLOW SQUARES), PUMPING WELL POSITIONS (RED CIRCLES) AND GB-SAR(BLACK DASHED LINES) AND ©PLAXIS(RED DASHED LINE) SECTION ANALYSIS. ... 55
FIGURE 26.SUMMARY OF THE EXPERIMENT DATES. INCREASES INSIDE THE ENCLOSURE, PUSHING THE WALL IN FRONT OF THE ... 57
FIGURE 27. HYDROMECHANICAL MODEL (©PLAXIS) RESULTS. CROSS SECTION: HORIZONTAL DISPLACEMENT INDUCED BY DEWATERING CALCULATED IN THE MODEL FOR SECTION A6.(1)SCHEME,(2) MODEL RESULTS. ... 58
FIGURE 28.RADAR OUTPUT: DISPLACEMENTS ESTIMATED BY THE GB-SAR.ALL PIXELS WITH DISCARDED DATA DUE TO THE LACK OF COHERENCE ARE SHOWN IN BLACK.THE RED DASHED LINE REPRESENTS THE MEASURED DIAPHRAGM WALL.NEGATIVE VALUES REPRESENT MOVEMENTS TOWARDS THE SENSOR. ... 59
FIGURE 29.PLAN VIEW: COMPUTED (GRAY BAND) AND MEASURED (RED ARROWS) HORIZONTAL DISPLACEMENTS FOR THE MOUNTAIN SIDE RETAINING WALL IN ALL SECTIONS CONSIDERED.(3)CROSS SECTION: LOCATIONS OF THE ANCHORS. ... 60
FIGURE 30.MULTI-PARAMETER CORRELATION: PUMPING RATES, DRAWDOWNS AND GB-SAR WALL HORIZONTAL DISPLACEMENTS. THE MEASUREMENTS ARE SHOWN IN CIRCLES.THE DASHED LINE REPRESENTS A DATA GAP.THE REST OF THE CROSS-SECTIONS ARE INCLUDED IN THE APPENDIX. ... 60 FIGURE 31.GEOGRAPHICAL LOCATION OF THE STUDY SITE AND DETAILED GEOLOGICAL PROFILE OF THE SITE.(1)PLAN VIEW OF THE
IS SHOWN IN LIGHT BROWN COLOR.BOTH CROSS SECTIONS SHOW THE MAXIMUM EXCAVATION AND THE REQUIRED DEWATERING
SYSTEM. ... 66
FIGURE 32.NUMERICAL MODEL MESH AND BOUNDARY CONDITIONS. ... 69
FIGURE 33.MONITORED POINTS BY LEVELLING.LEVELLING TIME SERIES GROUPED BY LOCATION. ... 71
FIGURE 34.INSAR DISPLACEMENT VELOCITY MAP (ABOVE).INSAR DISPLACEMENT TIME SERIES GROUPED BY LOCATION (BELOW). ... 74
FIGURE 35.INSAR(BLUE),LEVELLING (RED) AND NUMERICAL MODEL (ORANGE) RESULT COMPARISON. ... 75
FIGURE 36.DECISION FLOW DIAGRAM WITH SOME CODE COMMENTS RELATED TO THE APPENDIX. ... 83
FIGURE 37.PUMPING TEST WELLS AND PIEZOMETERS LOCATION. ... 85
FIGURE 38.FITTING CURVES OF THE NUMERICAL MODEL DURING THE PUMPING TEST. ... 86
FIGURE 39.GB-SAR, TRADITIONAL MONITORING DATA AND HYDROMECHANICAL MODEL RESULTS FOR ALL CROSS-SECTIONS. ... 88
List of Tables
TABLE 1.RESULTS SUMMARY FOR EACH SCENARIO AND DESIGN ... 42 TABLE 2.PARAMETERS OF THE HARDENING SOIL MODEL USED IN THE ©PLAXIS HYDROMECHANICAL MODEL. T IS THE SOIL UNIT
WEIGHT, C’ IS COHESION, ’ IS THE FRICTION ANGLE,E IS THE YOUNG’S MODULUS, IS POISSON’S RATIO, M IS THE POWER FOR
Introduction.
1.1. Motivation and objectives
The competition for space in urban areas due to an exponential population growth in cities means underground engineering plays a crucial role in the development of cities. Urban underground infrastructures are especially challenging because of the impacts generated by the interaction between underground infrastructures and groundwater, which can be maximized within high density populated areas (Pujades et al, 2012, Attard et al., 2016). The interaction between underground infrastructures and groundwater is two-fold: (1) groundwater may damage underground infrastructures or complicate their construction, and (2), underground infrastructures may impact aquifers.
On the other hand, underground infrastructures may affect the quantity and the quality of the available water resources. In the case of low permeability underground structures, groundwater barrier effect is usually the main concern (Vázquez-Suñe et al., 2004). The underground infrastructure can act as a natural flow barrier, reducing the effective transmissivity of the aquifer and leading ideally to a rise in the water table upgradient and a lowering on the downgradient side. These modifications of the water table can have negative consequences (Deveughèle et al., 2010; Font-Capo et al., 2015). Rising water levels may flood basements, promote soil salinization, affect flora by rotting the roots of plants, reduce the bearing capacity of shallow foundations, expand heavily compacted fills under foundation structures, cause settling of poorly compacted fills upon wetting, increase loads on retraining systems or basement walls of buildings, increase the need for drainage in temporary excavations, and propagate contaminants contained in the partially saturated zone (Marinos and Kavvadas, 1997; Tambara et al., 2003; Ricci et al., 2007; Paris et al., 2010). The lowering of heads on the downgradient side can cause seawater intrusion in coastal aquifers, ground subsidence, the drying of wells and springs and can kill off phreatophytes. Moreover, the difference of water pressure between both sides of the underground structure leads to asymmetric loading for which building foundations are seldom designed (Custodio and Carrera, 1989; Tambara et al., 2003).
In order to properly assess the potential impacts, it is important to characterize the site hydrogeologically (at geological, hydrochemical and hydrogeological level). Errors or inaccurate hydrogeological knowledge could mislead the final project or lead to unforeseen events. In fact, numerous accidents have occurred in recent years (for instance, the tunnel collapse in Barcelona - Spain, Van der Boom, 2011; or Köln - Germany, Van Baars, 2011). During the last few years, some regulations have appeared to control the impacts in both groundwater and infrastructures. In the case of Barcelona, the Municipal Environmental Ordinance of Barcelona (“Ordenança municipal del medi ambient de l’Ajuntament de Barcelona”) collects and summarizes the following local and state regulations1:
Metropolitan regulation for water discharge
Procedure H0309 - temporary water diversion. Catalan Water Agency.
1 Reglament metropolità d’abocament d’aigües.
Procediment H0309 - Derivació d’aigües amb caràcter temporal. Agència Catalana de l’Aigua.
Codi tècnic de l’edificació (CTE) - SE-C Cimentacions; 7.4 Gestió de l’aigua.
RD 1514/2009, de 2 d’octubre, pel qual es regula la protecció de les aigües subterrànies contra la contaminació i el deteriorament.
Llei 22/2011, de 28 de juliol, de residus i sòls contaminats.
RD 9/2005, de 14 de gener, pel qual s’estableix la relació d’activitats potencialment contaminants del sòl i els criteris i estàndards per a la declaración de sóls contaminants.
Technical Building Code (CTE) - SE-C Foundations; 7.4 Water Management.
Decree 1514/2009, of 2 October, which regulates the protection of groundwater against pollution and deterioration.
Law 22/2011 of 28 July on waste and contaminated soils.
Decree 9/2005 of 14 January, establishing the list of potentially soil polluting activities and the criteria and standards for the declaration of soil contaminants.
GISA: Specifications for technical assistance in the preparation of hydrogeological studies.
These regulations are only mandatory when the construction affects the water table and only require the performance of one pumping test to obtain aquifer parameters and to define the dewatering system. As a result, most of the underground constructions that interact with groundwater are performed with very poor knowledge on the hydrogeodynamics of the site.
The impacts on both aquifer and infrastructures must be limited, requiring construction designs that ensure safety compliance and preservation of the aquifer conditions. As a result, it is necessary to adopt corrective measures previous to, during, and/or after the construction that do not complicate the development of the construction and do not increase the total cost.
Urban underground infrastructures deal with variables such as cost, duration, safety, and management; faces political, social, economic and environmental issues; and guarantees future sustainability, maintenance, and energy efficiency. To do so, all these concepts and variables must be kept in mind during the whole construction process: (I) project design, (II) project construction and (III) project exploitation. The first stage "builds the project on paper", while the second and the third stages encompass the physical implementation of the project.
During the project design (stage I) previous data is collected, new data is generated, created (boreholes, field tests, chemical samples…) and processed, helping to understand the context and to design the infrastructure. The historical data can be used to design the first draft of the project. These data can be obtained from many different sources and can be structured and unstructured material in a wide variety of formats (text, numerical, multimedia, software, etc.). Since digital data collection, aggregation and integration have experienced an exponential increase (e.g. streaming in from a growing number of satellites and sensors, Internet, etc.), we are overrun by data.
The first draft of the project is used to define where and how additional new data must be generated (for instance, drilling new piezometers and/or wells, hydrochemical sampling or performing pumping tests). New data increases the data density in the underground construction area and allows defining the status quo of the groundwater (in terms of quantity and quality).
the minimum legal requirement to characterize the context: a pumping test. Even if the pumping test usually leads to reliable hydraulic parameters estimation, its reliability greatly depends on the quality of the pumping test and the analysis, and on the accuracy of the geological and hydrogeological knowledge (Criollo et al., 2015). Therefore, there is a need to provide constructors with a set of tools based on software platforms they can feel comfortable with and which will allow them to increase the quality of their hydrogeological analysis. This will then allow early detection problems associated to the groundwater.
The use of spreadsheets is very common in construction since they are useful to store, process and plot any type of data. There are many examples of spreadsheets developed to assist hydrogeological calculations (e.g. Akin et al 2002, Locock et al 2008, 2014, Elmore et al., 2007, Molano, 2014). However, it is sometimes difficult to adapt them to be useful in a specific analysis. In this sense, there is not an easy methodology yet to allow non-experts and non-software developers to adapt existing geological, hydrochemical and hydrogeological tools and to offer the possibility of extending its functionalities.
As mentioned above, underground infrastructures can be especially challenging when the construction is under the water table and in urban environments due to the impacts on both aquifer and construction areas which usually require adopting corrective measures previous to, during, and/or after the construction.
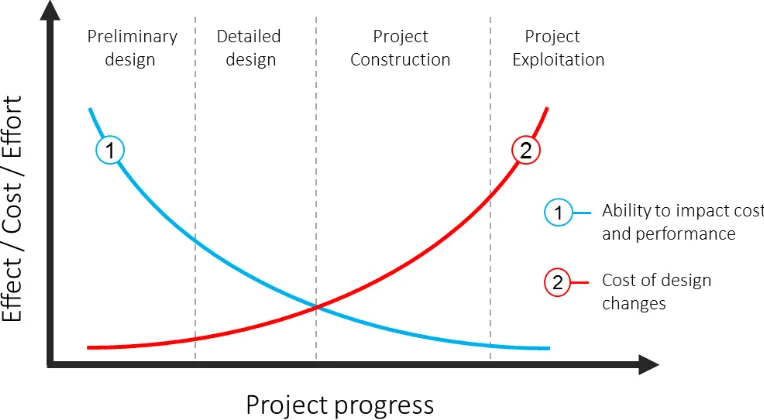
The construction safety, cost and efficiency can be influenced by the decisions adopted during the design stage of the Project. Research shows that decisions concerning the design of projects have a major impact on cost and can eliminate a considerable percentage of construction damages (MacLeamy, 2004; Pujades et al., 2014). The Figure 1 illustrates MacLeamy Curve which relates the level of effort required, cost and effect over the infrastructure project stages. The blue line indicates the ability to impact project cost and performance, which sharply decreases as the project progresses. The red line shows how the cost of making and executing design changes is low during preliminary design, but sharply increases during the project.
For huge or complicated underground infrastructures, hydrogeological numerical models have become a frequently used tool for diagnosis, management and prediction of water behavior and ground deformation. These models are useful to estimate the hydraulic parameters of the aquifer, to predict and quantify head variations and soil deformation and to design solutions to choose the best dewatering system (Merrick and Jewell, 2003, Bonomi and Belleni, 2003, Ricci et al., 2007 and Paris et al., 2010). Historical and new data are analyzed and set up in the numerical models together with the infrastructure design to forecast groundwater evolution prior the construction.
seems illogical to design hydrogeological mitigation measures without considering all the mitigation measures depending on and affecting the groundwater level.
Figure 1. Modification of the “MacLeamy Curve” which illustrates the concept of making design decisions earlier in the project when opportunity to influence positive outcomes is maximized and the cost of changes minimized, especially as regards the designer and design consultant roles.
During the construction (stage II) a great amount of new data is generated. This data comes from land surveys and automatic measurement tools and is used to validate the numerical models and to prevent and detect unexpected events. Traditional infrastructure project monitoring is based on land surveys and geotechnical instruments. The most common topographic techniques include levelling, total stations, Differential Global Positioning System (DGPS), and robotic total stations, and the geotechnical techniques include pendulums, inclinometers, extensometers, piezometers, gyros, and optical fiber-based techniques (Dunnicliff, 1988; Marchamalo et al., 2011). Some of these techniques, such as DGPS, robotic total stations and optical fiber-based methods, allow for automatic measurements and continuous monitoring. Although all of these techniques are widely accepted and used, they still allow only point-like measurements, requiring interpolation and extrapolation to achieve a complete measurement understanding.
weather conditions (storm, wind, rain, and sun). The SAR sensors can be installed in satellites or on the ground (GB-SAR). While satellite acquisitions cover areas of 100 km by 100 km over longer time periods, ranging from days to weeks (depending on the satellite), ground-based systems allow for continuous monitoring in smaller areas (usually approximately 1-2 km2) and shorter revising times on the order of minutes. SAR systems presents some limitations, such as the necessity of measuring displacements perpendicular to the Line-Of-Sight (LOS) and the requirement for pixel coherence over time. Nevertheless, the SAR systems provide more capabilities compared with other deformation measurement techniques due to its heightened sensitivity to small deformations, its long-range measurement capability (up to several kilometres) and its simultaneous measurement of a vast number of points.
Both satellite and ground-based SAR systems have been used and tested in a variety of analyses. However, nobody has applied this technology as a monitoring tool during construction works yet.
In the light of the foregoing, the general objective of this thesis is to demonstrate how the construction cycle deals with the various impacts produced by the interaction of underground constructions with groundwater at each stage of the process, with a view to providing improved processes. Thus, the specific objectives of this thesis are:
To provide constructors with a set of methods and tools to allow them to improve the quality of their hydrogeological analysis, allowing early detection of problems associated with groundwater.
To propose new methods for optimizing underground infrastructure designs by combining solutions through numerical models during the design stage.
To apply and develop new technologies and methods that have not been applied yet to monitor deformation in a construction environment during the construction stage. This thesis proposes the use of SAR (both ground-based and satellite sensors) to quantify deformation induced by dewatering and to improve the actual construction monitoring.
To do so, Adif (Administrator of Railway Infrastructures) provided the opportunity to test the developments of this thesis in the largest underground infrastructure of Barcelona (Spain): La Sagrera railway station.
1.2. Thesis outline
This thesis consists of five chapters. After the introductory chapter, the thesis continues with four chapters that were written as independent journal publications. Each chapter addresses one of the three specific objectives mentioned above.
software. The results of experience gained from updating several interdisciplinary case studies. The main insights of this approach have been illustrated by four examples: MIX (FORTRAN-based), BrineMIX (C++ based), EasyQuim and EasyBal (both spreadsheets based). The improved software has proven to be a better tool able to perform an enhanced analysis by considerably reducing the time-consuming input and output data files processing. All four examples are under the copyright protection of the Spanish Research Council (CSIC).
Chapter 2 is based on the paper: Serrano-Juan, A, Vázquez-Suñè, E., Alcaraz, M., Ayora, C., Velasco, V., Criollo, R. and Scheiber, L. How to improve and customize hydrogeological software. June 2016 - Hydrogeology Journal. Under review.
Also, the chapter is based on the following software registered by the Spanish National Research Council (CSIC): LAUNCH MIX (Reg. Num. CG3420733), EASYQUIM (Reg. Num. CG3420743), EASYBAL (Reg. Num. CG3420724), BRINEMIX (Reg. Num. CG3420764), all issued on March 31, 2015.
Chapter 3 provides an example of how the construction design can be optimized through numerical models analysis. This chapter presents an innovative groundwater by-pass design that enables the groundwater to flow through the structure and provide a homogenous distribution of the water pressure under the bottom slab. The new integrated design was applied to the largest underground infrastructure in Barcelona: La Sagrera railway station. A hydrogeological model was implemented to test the original and the integrated designs in three different scenarios. This new solution mitigates the groundwater barrier effect and optimizes the bottom slab, thus reducing the costs considerably and increasing safety during the construction stage.
Chapter 3 is based on the paper: Serrano-Juan, A., Vázquez-Suñè, E., Pujades, E., Velasco, V., Criollo, R., Jurado, A. Integration of groundwater by-pass facilities in the bottom slab design for large underground structures. May 2016 - Tunnelling and Underground Space Technology. Under review.
Chapter 4 is focused on the data acquisition during construction. This chapter aims to test the GB-SAR suitability to measure movements during construction. To do so, an experiment was performed in the future railway station of La Sagrera, Barcelona (Spain), in which GB-SAR was used to accurately quantify wall displacements induced by dewatering, and proved to be helpful in understanding structural deformations and identifying vulnerable areas. The results were compared to traditional monitoring data and numerical models to confirm the reliability of the GB-SAR measurements.
Chapter 4 is based on the paper: Serrano-Juan, A., Vázquez-Suñè, E., Monserrat, O., Crosetto, M., Hoffmann, C., Ledesma, A., Criollo, R., Pujades, E., Velasco, V., Garcia-Gil, A., Garcia-Alcaraz, M. GB-SAR interferometry displacement measurements during dewatering in construction works: the case of La Sagrera railway station in Barcelona, Spain. February 2016 - Engineering Geology. DOI: 10.1016/j.enggeo.2016.02.014.
measured by levelling and InSAR were not always consistent. InSAR measurements were more accurate with respect the soil deformation produced by the dewatering while levelling was really useful to determine the real impact of the construction on the nearby buildings.
Chapter 5 is based on the paper: Serrano-Juan, A., Pujades, E., Vázquez-Suñè, E., Crosetto, M. Levelling vs. Insar in urban underground construction monitoring: pros and cons. case of La Sagrera railway station (Barcelona, Spain). May 2016 - Engineering Geology. Under review.
Chapter 6 consists of a synthesis of the whole research. It contains the main conclusions by summarizing the answers to the three research-specific objectives addressed above. Furthermore, it provides an overall reflection on the conclusions, our contributions to the scientific and practical community are listed and recommendations for further research are provided.
How to improve and customize
hydrogeological software.
2.1. Introduction
Over the last few decades the rapid evolution of computer processing power has enabled the scientific community to solve different problems in the vast variety of geoscience fields such as mineralogy, petrology, geochemistry, geology, geophysics, hydrology, hydrogeology, among others. As a result, most scientists are aware of the importance of computer-aided analysis since geoscience algorithms manage many different variables, and this results in laborious calculations that are impossible to generate without a computer tool (Wang et al., 2012).
used until the 1990s. Most of them were devised to create individual programs to deal with specific tasks and short sets of data (at that time, data were limited and sometimes difficult to collect). The compilers generated the well-known “.exe”, which usually needed extra “.txt” files such as input, output or conditional data during the execution (Wang et al., 2013), resulting in a set of many different files containing the information for one analysis. Many geoscientists have developed tools based on these programming languages (e.g. Nath et al 2000, Akin et al 2002, Spada et al 2007, 2008, Agarwal et al 2008, 2010, Bea et al 2009, Prieto et al 2009, Toyokuni et al 2009, Alberti et al 2010, Jafargandomi et al 2013, etc.).
The development of new technologies in both computer architecture and programming languages continues apace, modifying the existing landscape. Current programming languages such as Matlab (MathWorks, Inc., 1984), Visual Basic (Microsoft, 1991) and Visual C (Microsoft, 1993) are known as visual languages, and are indeed more user friendly than their predecessors. Most of them integrate all the information required (input, output, sources, etc.) into a single file and enable the user to directly compute the whole analysis. Furthermore, greater computing power has corresponded to the increasing data. In the last few decades, digital data collection, aggregation and integration have experienced an exponential increase (e.g. streaming in from a growing number of satellites and sensors, Internet, etc.). Geoscientists are overrun by data and, at the same time, have access to ever-increasing computing power
Graphical User Interfaces (GUIs) are becoming common to assist rapid, rigorous and interactive analysis (Jones et al, 2014). Robin et al (1994) supported geoscience with graphical-user-interface Internet tools during the 90s. Since then, many examples of GUIs have been developed in geoscience (e.g. Sokos et al 2008, Mahabadi et al 2010, Phong et al 2012, etc.) in order to make the software more user-friendly (e.g. screen selection of the input, output arrangement for instant comprehension of the results…). Since new softwares are dynamic, visual and interactive, some old fashioned programming language-based software such as FORTRAN-based ones are becoming outdated owing to their complex analysis process (preparing input text files, analysing the output text files and displaying limited graphical options). However, despite the limitations of the aforementioned geoscientific software, they still are able to evaluate and solve successfully complex geoscience algorithms.
On the one hand, pre-existing software is being used to create new software systems rather than building new ones (Krueger, 1992). Research on technical issues such as repositories (Mili et al., 1997, 1998; Seacord, 1999; Guo and Luqi, 2000; Buregio et al., 2007), search-based tools (Lucredio et al., 2004) and domain-specific languages (Deursen et al., 2000) was the initial focus of the reuse community. However, as more experience became available for general software reuse (e.g. Endres, 1993; Griss, 1995; Joos, 1994; Frakes and Kang, 2005; Sherif et al., 2006; Lucredio et al., 2008, Bhandu et al 2013) and GIS reuse (e.g Gordillo et al., 1999; Câmara et al., 2000; Lisboa Filho et al., 2002; Buccella et al 2013), not many reusing methodologies have been developed by the hydrogeological community. There still a lack of a simple general approach to easily reuse old fashioned hydrogeological software.
interfaces are user-friendly and facilitate numerical and statistical computations, (2) data can be easily queried, analysed and visualized, (3) macro programming interface provides a good end-user guidance that helps the user in writing correct and more reliable programs (Cunha et al, 2014), (4) it saves time due to its low barrier since most researchers are already adept at manipulating spreadsheets, and (5) there are existing tools especially designed to fix potential errors Jannach et al, 2014) and inconsistent data storage (Cunha et al, 2014). Consequently, it comes as no surprise then that nowadays a great variety of new tools exist that facilitates a number of geocientific calculations (e.g. Zou et al 2004, Khan et al., 2006; Ayala et al., 2009; Ozcep, F., 2010; Choe et al., 2010; Aliane, N., 2010; Mayborn et al., 2011; Bonduá et al., 2012; Wang et al., 2010, 2012, 2012a, 2012b, 2012c, 2013, Jones et al 2014, etc). Specifically, in hydrogeology many spreadsheets have been developed in order to assist calculations in the analysis and interpretation of pumping tests, hydrogeochemical data, analytical and numerical solutions for groundwater flow and pollution problems, etc (e.g. Akin et al 2002, Locock et al 2008, 2014, Elmore et al., 2007, Molano, 2014), as well as benchmark analysis of existing tools (e.g. Torlapati et al., 2012).
Through this combination of spreadsheets and VBA, it is possible to reuse and update outdated programs and add new features and functionalities. This means that programs such as FORTRAN based ones can become user-friendly, dynamic and interactive. This combination also offers the possibility of adapting and personalizing the software by programming simple macros, which can run specific computing actions such as arranging input or output data to easily connect them to other software platforms, database management systems (DBMS) and GIS platforms (e.g. Velasco et al., 2014).
This chapter presents an approach to easily reuse, customize and extend old fashioned hydrogeological software. It is the result of the experiences collected from updating several case studies. The main insights of this approach have been illustrated by four examples: EasyQuim, EasyBal (both spreadsheets based), MIX (Carrera et al, 2004) (FORTRAN-based) and BrineMIX (PHREEQC - Parkhurst and Appelo, 1999) (C++ based). However, only the MIX will be largely discussed to allow the reader easily to follow a step by step process application of the presented approach. This chapter also wishes to answer the following research questions: Q1 is it possible to easily update any hydrogeological program following this approach? Q2 Is it possible that new updates lead to fewer errors during the analysis when compared to the original ones? Q3 Are end users more efficient when using an updated spreadsheet-based program than using the original one?
2.2. Methodology
2.2.1. General systems development
Similarly, the Systems Development Life Cycle (SDLC) is a term used to describe a process for planning, creating, testing, and deploying an information system, also commonly used in the computer programmer community. It consists of a set of phases in which each phase of the SDLC uses the results of the previous one. The SDLC comprises important phases that are essential for developers, such as planning, analysis, design, and implementation. A number of SDLC models have been created: waterfall, fountain, spiral, build and fix, rapid prototyping, incremental, and synchronize and stabilize. For example, the waterfall model shows a process, whereby developers have to follow these phases in order: (1) Requirements specification (Requirements analysis), (2) Software design, (3) Implementation and Integration (4) Testing (or Validation), (5) Deployment (or Installation) and (6) Maintenance (Kay, 2002). The object-oriented analysis (OOA) also states similar phases: (1) Analysis, (2) Design and (3) Coding.
In both Object-oriented analysis (OOA) and systems development life cycle (SDLC) the program creation can be rewriten as the following flow process:
ID GUI DT/RUN
Where ID is the IDentification of the problem (SDLC (1), OOA (1)), GUI means the Graphical User Interface (SDLC (2), OOA (2)), DT represents the required Data Treatment and RUN describes the solution computation (SDLC (3-5), OOA (3)). The maintenance phase of the SDLC has not been included.
The first step is the problem identification (ID) which helps to understand the problem and answer questions such as what is available and what is desired. It is only when the programmer truly understands the nature of the problem that it becomes possible to identify steps such as which information is necessary and available, how to display it, how to arrange it, how to request it and which options should be offered. After identification, the graphical user interface (GUI) should be designed. Through this interface, the program requests the input data, visualizes the output data and offers the possibility of setting up any option the program offers. Finally, all the requested data in the GUI could require more or less data treatment (DT) to achieve the proper format to be computed (RUN). Afterwards, the output data should be again displayed in the GUI, maintaining a continuous interaction between the GUI and the computation of the program.
2.2.2. The Updating Approach
This chapter presents an approach to easily reuse, customize and extend outdated software. This approach is the result of the experiences collected from updating several case studies. It has been built as a decision flow chart (following the UML standards) as every software is different and requires different kinds of update. This chapter follows Figure 2¡Error! No se encuentra el origen de la referencia. decision flow chart describing each step and discussing its different flow options. It is important to mention that all the presented codes have been developed to run in a MS Excel environment.
process, not only considering that required but also that which is available. (2) COMPUTATION. How is it computed? Which softwares are involved in the computation? Is it possible to recompile the existing code (access to the source code)? At this step, the developer should understand how the program works. Particularly, some aspects such as the complexity of the algorithm, the accessibility (i.e. open code access or not) or the possibility to combine various software, can define different software configurations. (3)
IMPROVEMENTS. Any changes needed? Possible improvements? The idea is not just to reuse and adapt
outdated software, but to add new features and functionalities that will improve the performance of the analysis (e.g allowing data storage, enhancing graphic outputs or connecting the results to other software platforms such as GIS). (4) COMMUNICATION. What do I know? What does the final user know? Finally, it is necessary to understand who will use the software, taking into account factors such as background knowledge (both in computer and science), language, etc. It is significant how to ask for or how to display information. The problem identification process requires longer as it will define the future graphical user interface, the input and output data treatment and how the solution will be computed.
An appropriate graphical user interface (GUIIN) should request and display the adequate data (Phong et al,
2012), while being aesthetically pleasing, comprehensible, simple and responsive. (5) INPUT DATA AND
OUTPUT DATA. Where is the input information coming from? In hydrogeology the information is commonly
available from maps (use of GIS), tables (use of matrix), independent numbers (use of cells or Input Boxes) or is a selection from an existing dataset (use of buttons, lists…). The process is similar with the output, where results of the analysis are commonly displayed in maps (GIS) or tables (matrix). (6) COMPUTATION and
IMPROVEMENTS. How to Setup the analysis? VBA offers a large set of options such as button clicks or events
(e.g. when adding information or modifying a cell content). (7) COMMUNICATION. Again, who is the final user? There are many different options to display information or to order and select it. The MS Excel environment can greatly improve the power of the analysis by considering whether results should be static (e.g. simple tables or maps) or dynamic (e.g. pivot tables and charts). Finally, it is necessary to adapt all the new program capabilities depending on the final user knowledge.
The input data (ID) are usually the available data, not necessarily those that are required. As these available data are not always provided in the correct order, (8) input data treatment (DTIN) is essential. Depending on
each program, filters, calculations, unit conversions and data rearrangement will sometimes be necessary to prepare the required input for analysis, whereas in other programs the input will be already in format. Non-Excel-based programs will need to (9) export the input data (EXIN) into different formats and call external
executables to perform the analysis, whereas Excel-based programs (e.g. solvers, macros) will (10) run (external – RUNEXT; internal – RUNINT) as a matter of course. By contrast, depending on the computational
core format, (11) output data will be imported (IMOUT) into the GUI or prepared to be computed by another
external program. As not all the output needs to be presented in GUI, the Output data (OD) can also be partially disregarded, rearranged in new tables and plotted. This (12) output data treatment (DTOUT) is usually
necessary to fulfil the (13) GUI (GUIOUT) output requirements. Occasionally, it will be interesting to export the
charts in the spreadsheets. Usually, data storing (input/output) will be necessary before it will be recalled by the GUI or exported into different formats.
Figure 2. Decision Flow Diagram: Programming steps.
Verplank et al (1985) and Marcus et al (1995) defined some general principles of Graphical User-Interface Design and its effectiveness in visual communication. There are also many reliable resources in the Internet such as jiscdigitalmedia British website.
Additionally, during the reusing process the time needed to develop each step was analysed. The analysis shows that the conceptual model design (identification of the problem, designing the GUI and evaluating which data treatment is necessary) requires longer time than coding. In this line, Buccella et al (2013) presents similar time distributions during their reusing development case study in GIS, which is also similar to the Rational Unified Process (RUP) (Kruchten, P., 2003) hump chart and the Unified Process (Jacobson et al., 1999). Even if the user experience can impact in a significant manner in the total time necessary to reuse any software, the time task distributions usually remain the same.
2.3. Application examples
Several application examples have been created and tested to develop the presented approach. However, only the MIX will be discussed at length to allow the reader to follow a step by step process application of the presented approach. This example will be useful to emphasis the improvements to its previous versions, e.g. automatic and instant graphical output interaction, automatic formula refill to avoid heavy documents, connection to non-Excel-based software such as FORTRAN or GIS, automatic graphical output generation and automatic data selection and its rearrangement.
The other three update examples, will be shortly describe to provide better understanding on how spreadsheet-based and C++ based software can be also reused, customized and extended by following the same approach. All of these examples have become new tools that have been registered by the Spanish National Research Council (CSIC): LAUNCH MIX (Reg. Num. CG3420733), EASYQUIM (Reg. Num. CG3420743), EASYBAL (Reg. Num. CG3420724), BRINEMIX (Reg. Num. CG3420764) all issued on March 31, 2015.
2.3.1. MIX 2.0
(ID). MIX (MIX, 2013) was created in 2003 by Carrera et al,2004 to assess a methodology to compute mixing ratios with uncertain end-members. (1) INPUT DATA AND OUTPUT DATA. The input file contains information about the water samples (which can be split into “Sources” or “Wells”), their end-member concentration values and its covariance. Additional information such as restrictions or initial conditions can also be set. (2)
COMPUTATION. Given that the software was developed in FORTRAN, it requires one input file and generates
read with some unnecessary information for the analysis. For standard analysis, only a data selection of these files should be displayed by tables and different kinds of charts.
In order to design the GUI, both spreadsheet and UserForm were chosen. This allows the user to predefine the magnitude of the problem in the UserForm and to set the input data in the spreadsheet as a matrix. (5) INPUT
DATA AND OUTPUT DATA. In this case, input data tables are set in different spreadsheets (concentrations,
standard deviations, initial solutions and restrictions) and are activated when the user navigates through the buttons of the UserForm. The input information can be directly set in the matrix or can be imported from a GIS (macros that allow the spatial selection and fill the matrix). This GUI also offers the possibility of interacting with Windows by opening some folders and existing files.
(6-7) COMPUTATION, IMPROVEMENTS and COMMUNICATION. After introducing the data, selecting those data that will be suitable for analysis and setting up the desired options, (8) input data treatment transforms all these data into a single text file, changing formats, data types and units, etc. This is the real input file that is (9) exported and then called by the “FORTRAN-based program MIX” out of the Excel environment (10) (ERUN). The “FORTRAN executable” is automatically called by Excel giving the user the impression that he or she is not working with two different software programs (e.g. using the Shell statement). See the appendix for further information regarding to the code.
COMMUNICATION. To (11) import the results, (12) output data treatment is required despite being difficult
to manage. Storing the input number of sources, wells and end-members in variables and using the functions to find key words enable us to select the information that is worth using. After the data treatment, two different plots are generated: pie charts to show the proportion of the water sources in each well and Scatter plots of measurements versus calculated values for each end-member. Moreover, other results such as contributions to the objective function and the eigenvalues are also presented in form of tables. If the user wishes to revise the two complete output files, these files are imported to two spreadsheets even if it also enables us to access the MIX windows folder where all files are stored.
Figure 3. Comparison between the old MIX input file (top) and the new MIX v2013 input dynamic table (down).
Figure 4. Comparison between the old MIX output file (with more than 6.000 lines) (left) and the new MIX v2013 output GUI (pie plots, data rearrangement and scatter plots) (right).
2.3.2. Other examples
EasyQuim is an example of how to energize a spreadsheet originally created to plot hydrochemical data analysis. The new version adds functionalities such as converting the main data spreadsheet into a database and creating a data selector, allowing the final user to decide which analyses are worth comparing. Additionally, new program connections such as the connection with GIS were set, allowing further temporal and spatial data analyses.
EasyBal (EasyBal, 2013) was designed in 1999 to evaluate water balance per unit of soil area as a function of precipitation, the potential evapotranspiration (or ETP), temperature and irrigation. Outputs are the deficit and the recharge of the aquifer. Older versions required up to six steps to introduce the input data into six different Excel sheets. All data analysis periods had to be between January 1970 and December 1997 and some calculations and adaptions were required if the user needed a different period. Each month only allowed for exactly 30 days instead of the real number of days. There is a need to solve the current data period restriction by allowing conditional sums that enable us to achieve automatic monthly and yearly totals. All functions should be reorganized to allow the autofill of the formula in a single line. These improvements enable the user to perform the analysis simultaneously and to obtain all the results so that they are clearly structured and organized in a single Excel sheet. Some extras should also be included in the new EasyBal version. On the one hand, the user can select the program language, English or Spanish. On the other hand, the ETP can be introduced as input data or can be automatically calculated (using the Hargreaves and Thornthwaite methods) and graphically compared with the input data, allowing the user to select the best option in the menu or graph.
EasyBal is an example of how to improve a current calculation spreadsheet. In this case, the performance involved reorganizing all data functions to achieve automatic formula refill, adding the language selector and the ETP graph selector. By changing some formulas, it was possible to accept any input data period and to automatically add up monthly and yearly totals.
In contrast to earlier examples, BrineMIX (BrineMIX, 2013) is a new program, not an update. In this case, BrineMIX seeks to create a GUI that automatically generates the input and reads the output of PHREEQC for a specific water mixing analysis. In the input only the chemical water samples, the mixing percentage and the mineral selection are set, whereas the output shows the chemical composition of the final water and its chemical precipitates. The purpose of this new program is to simplify a specific PHREEQC analysis for the user who does not usually work with it.
BrineMIX is an example of how to externalize part of a bigger software. PHREEQC can perform many different analyses but not all its possibilities are necessary for non-chemical users. BrineMIX was created to simplify some specific analyses through an Excel environment assisting these users to perform them.
Figure 5. Flow diagram paths followed by each of the presented case studies: EasyQuim, EasyBal, MIX and BrineMIX.
2.3.3. Reused software validation
When software reuse is based on science and engineering it is usually treated as an empirical discipline (Frakes and Kang, 2005). Metrics were developed to quantitatively and qualitatively measure the improvement of the software (Suri and Carg, 2009). Empirical studies, in both industry and academia, with the aim of assessing the relationship between software reuse and different quality and cost metrics have been reported in the literature. They are usually related to quality (such as error density, fault density, ratio of major errors to total faults, rework effort, module deltas, developers perception), to productivity (i.e. lines of code per effort) and to time-to-marked (i.e. development cycle time).
In order to answer how is this approach able to (1) easily update any hidrogeological program by following this approach, (2) to lead to fewer errors during the analysis, and (3) to perform better user efficiency by using an updated spreadsheet-based program, quantifiable and qualitatively metrics have been used. Quantifiable metrics rely on achieving the same or better results with less operational time when compared to the original one (metric of time), but the increase of the system reliability can be also measured (i.e. by replacing the error prune human processes by automation them or by displaying warning when values are out of range). Qualitatively metrics can be the addition of new functionalities, input/output data treatment or showing results in a proper format to use in another analysis or to be directly add into a report.
time in preparing all the files and also by strongly reducing the errors during the process (e.g. FORTRAN based programs are very sensitive to any typing error). All four case studies have been tested to evaluate the necessary time to compute a complete analysis between old and new versions. EasyBal and MIX safe at least three quarters of the time, while EasyQuim and BrineMIX safe half of it. The main improvements rely on dynamic data comparison, wide data range of values, addition of GUI and the automation of the input and output data treatment.
On the other hand, this approach has been used in educational, research and technical projects. EasyQuim and EasyBal are taught in different international master courses by institutions such as the Technical University of Catalonia (www.upc.edu) or by non-profit other such as the FCIHS (www.fcihs.org). Besides, their previous versions were widely used in the hydrogeological international community, especially in Latin American countries. Moreover, all four reused software have been applied in different technical (Scheiber et al 2013a, 2013b, 2013c, GHS, 2013) and research projects (Scheiber et al 2014a, 2014b, Velasco et al 2014), and Criollo et al. (2014) have applied this approach for reusing the MariaJ fortran-based program.
2.4. System requirements and program availability
Visual Basic for Applications (VBA) has been supported since the MS Excel 97 version in a Windows based environment. Although Windows and Macintosh (OS X) have a similar interface, the latter only supports VBA in its 2004 and 2011 versions, not in its 2008 version. The main limitation of using VBA in an OS X environment is that it relies on Application Programming Interface (API) calls, which only works in Windows.
VBA has evolved considerably since its inception and this is the main reason that some programs could cease working from version to version. This usually occurs when the code uses modern functions or graphics because the way to refer to them has slightly changed. Since MS Excel is the host application and depends on the user versions, the memory space length changes from the 32 to 64 bits versions. Although the difference affects some variable declarations, this problem can be sidestepped (See Appendix for further explanations).
The four software examples can be obtained by making a request to the author or by downloading it from the URL, http://www.h2ogeo.upc.es/software.
2.5. Summary and conclusions