Inter pr eter Char t Diagr am N-S
Marcia Mac Gaul, Patricia Aballay, Rodrigo Zamora, Marcelo Soria
Proyecto de Investigación C.I.U.N.Sa. Nº 1638,
Consejo de Investigación de la Univ. Nacional de Salta, Av. Bolivia 5.150, Salta, Argentina
Abstr ac. The team of researchers develops and implements technological resources focused on a methodological strategy that supports its use. Our investigation deals with the analysis beginner students’ competences attending the Analisis de Sistema career at the UNSa, in order to solve different computing problems such as the analysis of the design if the diagram N-S and the desktop test. This work describes the process undertaken by the educational software design called Diagramar. Its development and the searching activity are related to the adopted methodologies: the Extreme Programming and Investigation-Action. The pedagogical importance of Diagramar lies on finding an answer to students and teachers’ needs, providing a technological resource developed to fit these needs. It is mainly focused on the elaboration of the N-S diagrams. There are not many texts that provide an specification of algorithm and translate a methodological strategy able to support the staff of teachers from a continual investigation on its own practice.
mmacgaul@cidia.unsa.edu.ar
Keywor ds: algorithms - Diagrams N-S - Educational Software - XP Methodology - Methodology I-A
1. Intr oduction:
The team in charged of the project CIUNSa N° 1638, called “A Methodological Strategy: the Use of the TICs in the Massive University Entry”, is integrated by specialists in Information Technology, pedagogues, and teachers with a vast experience. One of their objectives is to develop and implement the technological resources designed on methodological strategy that supports its use. Besides it also aims at improving the teacher’ practice through reflexive processes.
2. Objectives:
The investigation aims at inquire into the beginner students’ competences in the Licenciatura en Análisis de Sistema at the UNSa, in order to solve computing problems. For this reason it is important to include an analysis problem stage, the algorithm design through the diagram N-2 and the corresponding desktop test. These stages are integrated in a spiral process of construction, until reaching a solution. The investigation had as objective to analyze this process in depth as a necessary step for the development of the educational software which makes possible the development of the phases mentioned previously, contributing to a high quality design of algorithms and allowing the student the edition of the documentation generated.
3. Method:
3.1 Investigation Stage:
During this stage the participants of the project gathered to debate about main topics, such as the investigation framework, from the qualitative contributions. The searching process set upon the Investigation-Action (I-A) as construction process and reconstruction of the enquired object. The idea was to strive to promoting sensitivity among the members of the group due to the complexity of the content, for this reason, this work was complemented in seminars about strategies and contributions of the qualitative investigation.
The sample was put in practice with thirteen students of Computing Elements, who were given a number in order to guarantee the reliability and validity of the applied elements. The team of investigation was composed of 10 researcher teachers.
Pr oblems’ valuation: The sample was exposed to the reading of 8 computing problems in order to be valued. The team of investigation built a scale based on two fundamental categories: comprehension and resolution; both related to the students’ learning process.
The modality consisted on providing the assignments one by one to all the students simultaneously. Each learner read the problem card and filled in the valuing paper. The time assigned for this activity was of three minutes for each problem approximately. Once all the students had finished the task, the paper was handed in and the process was repeated but with another problem.
Pr oblem Solving: The modality consisted of getting at random 2 from the 8 problems previously valued (labeled A and B) and to assign students a team to work on both problems.
assigned student had to rectify or ratify the previous problem valuation. For this reason a personal card was handed out having a space for the identification number, the problem and the valuation scale; a separated body in two zones: on the left to solve the problem and on the right for the registration of the student’s construction process. At the end of the page there is a place for the ratification or rectification of the previous problem valuation, once the solution was designed.
The investigation team did not interact with students. The learner verbalized the ideas by thinking aloud and/or took notes about the work that helped to interpret the reasoning process. After the problem solving, an interview was carried out in order to enquire students about the details that were explained about the process. This interview was recorded in a digital format. The focus was on the tools used in the problem solving activity and on the relevant information for the design of the future educational software.
3.2 Development stage:
Similar system sear ching: To know about other inter phases, some systems with similar objectives were looked for. We can highlight the Raptor system; however, this system is only useful for the creation of Flowing Diagrams, without having found software that allows the realization of Diagrams N-S.
A Methodology Selection
:
The methodology chosen was Extreme Programming (XP), which is the most important among the group of agile methodologies. This is based on the motto “accept the change”, pointing to the idea of adaptation. It is proposed a great integration with the client, making him feel part of the project.This methodology proposes shot development interactions to be able to integrate versions of the product. The programming in couples is allowed, exchanging roles periodically; in this way the computer programmers integrate their points of view.
As this methodology does not have a previous analysis and design stage, it as a vital part the development directed by the proofs. The rectification of the code is applied continuously to increase the quality and to reduce its redundancy.
The pr inciples of methodology accor ding to Kent Beck ar e developed her e: Simplicity: the design is simplify to fasten the development and to facilitate its maintenance.
Communication: different forms are carried out. For the computer programmers the simpler the code, the better it communicates. The code self documented is more reliable than the comments, because the last ones are soon out of tune when the code is modified. The comments should be focused only on what is not going to be changed. The emphasis should be put only on what is not going to vary, such as the objective of a class or a method’s functionality.
Feedback: As the client is integrated in the project, his opinion about the state of it is known in real time.
programmers is writing code. It is important to be valiant to rely on the programming in couples and to believe that it improves the code quality without having a negative effect over productivity.
Respect: the members of the team respect each other, because the can not make any changes due to the fact that the existent proofs may fail or make their partners’ work delay.
Development Tools: After studying some programming languages, it was decided to develop the system by using the Visual C# 2005 Express Edition, due to the fact that the language is very complete, composed of modules that facilitate the realization of Unity Tests and free access.
4. Outcomes:
Despite the fact that the principal outcome shown in this work is the software, it must be considered that its development was accompanied by a continuous work of investigation in which two methodologies were adopted: the XP and the I-A, the changes in the requirements were conducted by the outcomes obtained from the qualitative investigation carried out on the instruments applied in the investigation. The proof refers to the once more to the documents’ inspection in order to value the degree of concordance among the users’ expectations.
A description of the diagram is presented below.
4.1 Object Domain Model:
The model that emerged from the first interactions evolved thanks to the tests unity- which was also improved- it was influenced by many decisions taken about the design which tend to simplify the representation of the representation of the problem in class models domain. The problem was divided into four questions: 1) the simple and structured variable negotiation used in the diagram, 2) the handling of data, 3) the interpretation and execution of different types of expressions.
The class that had the functionality related to the two first questions is the Variable Handler. Getting profit from the fact that the diagram N-S exist in only one context for the variables, the variable handler stores in memory all the names and values from the variables involved in the diagram at the moment of execution.
4.2 Repr esentation of the Differ ent Str uctur es Used in a Diagr am
As another question to be solved it is important to bear in mind the design of a group of classes of control, called Basic Structures that include the behavior of the six types of expressions to be known: Entrance, Exit, Assignment, Alternative, Conditional and Unconditional course.
4.3 Differ ent Expr essions Pr ocessing
The class that is responsible of the third question to be solved is the Interpreter, that has grammar integrated games which allows to solve different kind of expressions to be known: Assignments that started or modified the variable values, Expressions of calculus like “Way out” or the resolution of the logical value of a Boolean expression typical in the condition of an Alternative.
4.4 User Inter phase and Tests of Acceptance:
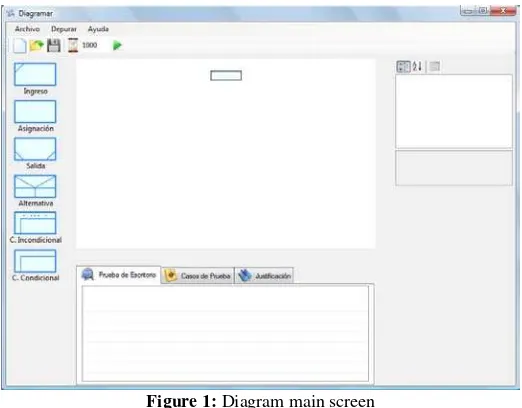
[image:5.595.167.428.441.645.2]The graphic interpreter is an application of desktop type that allows to create, edit and perform the N-S diagram and to visualize a desktop test that is obtained as a result of a diagram execution. It worked on the organization of different areas which compose the screen, defining the central area or Drawing Area, a left area containing the Gallery of Blocks that builds the diagram and the right area of Properties in which all the structures that compose the algorithm are specified. (See Fig. 1)
Figure 1: Diagram main screen
4.5 Distinction between
A distinction was made the Blocks and Structure classes, being the last one the umbrella of Conditional, Cycle, Meanwhile, Way Out and Assignment. The kind of block symbolizes a group of structures (e.g. an object of course in the Cycle class that contains a block as member)
4.6 Panel of Pr oper ties:
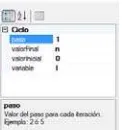
This is located on the right of the Drawing Area. Once the structure has been inserted in the drawing area (Diagram N-S) if you click any of the structures drawn you can visualize the attributes that each structure has (see Fig. 2), which must be edited in they way they should.
Fig 2. Elements from the unconditional cycle.
[image:6.595.268.329.318.383.2]4.7 In the Drawing Area we observe the diagram of block that is being created or edited. In fig. 3 the diagram corresponds to a solution for the problem “given a natural number K, it shows the two consecutive natural numbers A and B so K (A!,B!)”
Fig. 3 Example of a diagram edited by Diagramar
[image:6.595.184.411.459.594.2]Fig. 4 Execution of the diagram in Fig. 3
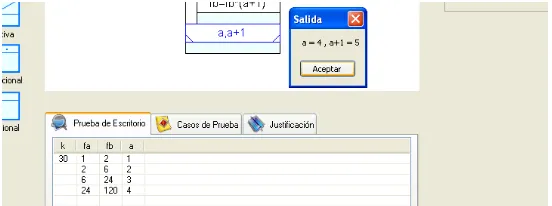
In successive versions three section were included in the inferior area, one to show the desktop test that the user can execute about the algorithm designed by the user or selected among a collection of diagram models solved and explained. The other areas are only the ones that document these models, providing recommended test cases and a justification of the aspects of design that were taken into account when the diagram was developed. These three sections are presented as flaps. (See Fig. 5)
Fig. 5 Desktop test corresponds to the execution of diagram in Fig. 4
Desktop Test: it provides the result of the last execution that has been carried out in the diagram. This allows having a register of the changes in the different variables defined. In our example, for the K=30 data entry from figure 5, the exit of values a=4 and (a+1)=5 are natural consecutives so that 30 (4!,5!)
Test Cases: it offers a series of recommendations in order to execute the test trying to put in practice different ways of execution.
[image:7.595.160.436.396.499.2]5. Some Conclusions:
The great pedagogical importance of the development of the educational software Diagramar does not only reside on the construction of the product; it responds to the students and teachers’ needs by providing the technological resources. It is mainly focused on the elaboration of diagrams N-S, poorly documented in the literature about the specification of algorithms and translates the methodological strategies that support the teacher staff by the continuous investigation of their own practice.
The students are benefited by the incorporation of the TICs that facilitate the construction of their learning process. For this reason, the investigation establishes that the most important aspect for the student is to verify the design of algorithms. That is why we believe that Diagramar allows the visualization step by step of the functional activity of the design, empowered by the document. In this sense, we can affirm that Diagramar is the real interpreter of the students’ logical productions.
The teachers who will use this software will do it with the objective of searching more deeply in the learning process of their students.
On the other hand, it is important to mention the adequate interaction between the development of methodologies and the investigation adopted. One example is the way in which the incorporation of the diagram model was solved. This change in the requirements came from the reflexive process oriented towards the construction of the software. It was considerate the incorporation of inferior sections containing the test and the justification of the diagrams, paying attention to the functionality. In this way, we believe that it was successfully explained the common requirement of students when they pronounced the following: “when I see a problem, I use Diagramar in order to solve the problem again”
Finally, other positive aspect is the investigation group cohesion, that provides, from another point of view, it is the construction of a methodological strategy and the use of a resources.
Refer ences
1. Mac Gaul, M. - del Olmo, P. - Rivera, A.: Software Educativo para diseño de Algoritmos: Del problema al diagrama N-S. Cuadernos FHYCS, 180--181 (2008)
2. Saltalamacchia, H.R. Del proyecto al análisis: aportes a una investigación cualitativa socialmente útil. Primer tomo. Ed. El Artesano (2005)