C
C
|
E
E
|
D
D
|
L
L
|
A
A
|
S
S
Centro de Estudios
Distributivos, Laborales y Sociales
Maestría en Economía Universidad Nacional de La Plata
Income Distribution, Institutions and Conflicts: An
Exploratory Analysis for Latin America and the
Caribbean
Leonardo Gasparini y Ezequiel Molina
Income Distribution,
Institutions and Conflicts
An exploratory analysis for Latin America and the Caribbean
*Leonardo Gasparini **
Ezequiel Molina
CEDLAS***
Universidad Nacional de La Plata
Keywords: income distribution, polarisation, cohesion, inequality, poverty, institutions,
instability, conflict, corruption, Latin America, Caribbean
JEL codes: I3, D3, D6
* This document is part of a project on Social Cohesion in Latin America and the Caribbean carried out by
CEDLAS and UNDP. The authors are very grateful to Gerardo Munck, Matías Horenstein, Enrique Ganuza, Sergio Olivieri, Stefano Petinatto, Patricio Meller and André Urani for valuable comments and suggestions. All the views expressed in the paper are the sole responsibility of the authors.
** E-mails: leonardo@depeco.econo.unlp.edu.ar and ezequiel.molina@gmail.com
*** CEDLAS is the Center for Distributional, Labor and Social Studies at Universidad Nacional de La
1. Introduction
It has long been argued that the income distribution of a country is associated to its institutional development and its degree of social cohesion and conflictivity. An economy where income is more equally distributed is probably characterised by better and more stable institutions, fewer conflicts and a stronger sense of social cohesion. However, although intuitive, the links are theoretically ambiguous and have not been well-established by the empirical literature. The difficulties are enormous: (i) there are not obvious empirical counterparts for concepts like institutions, social cohesion and conflicts; (ii) the theory stresses that causality may go in all directions, (iii) it is not clear which dimension of the income distribution (inequality, polarisation, poverty, mobility) is the most relevant, and (iv) the data at hand is insufficient to implement valid tests for causality. Despite these empirical limitations, the topic is sufficiently important to have attracted the attention of social scientists for decades. The academic community is continuously searching for new datasets and ideas that contribute to the understanding of the links between income distribution, institutions and conflicts.
The issue is particularly relevant for Latin America and the Caribbean (henceforth, LAC). This region has arguably the highest levels of inequality in the world, and it is also one of the regions with weaker institutions, and higher levels of conflictivity and violence. Moreover, the evidence suggests increasing income disparities in several LAC countries over the last two decades, raising questions on the implications for the socio-political instability.1
This document explores the relationship between income distribution, institutions and conflicts in Latin America and the Caribbean by using a new database of income distribution statistics computed from microdata of 54 household surveys from 21 LAC countries in the period 1989-2004.
The paper makes at least three contributions to the existing literature. On the one hand, it is based on a set of distributional measures computed from microdata using a consistent methodology across countries. The cross-country literature has been increasing at a fast pace since the 1990s, fuelled by the availability of household survey data. However, several of these studies include a large number of country/year observations without being cautious over the comparability issues. Although naturally not fully consistent, the database used for this paper has been constructed taking the comparability problems seriously into account.
Second, we analyse the interactions between several measures of institutions and conflict with three different dimensions of the income distribution: inequality, polarisation and poverty. Institutions and conflict may interact in different ways with
1 See IADB (1998), Morley (2000), Ganuza
et al. (2001), Bourguignon and Morrison (2003) and
these three characteristics. In fact, the paper provides some preliminary evidence that in the LAC context institutional development has been associated to lower poverty, but not significantly lower inequality and polarisation. Instead, conflicts seem more related to inequality and polarisation than to income poverty.
Some authors have recently argued for the use of polarisation as a key variable when studying conflict and social tension. A population is polarised if there are few groups of important size in which their members feel some degree of identification with members of their own group, and feel alienated from members of other groups. The research on polarisation is mainly motivated by the conjecture that the differences among homogeneous groups cause social tension and instability. To our knowledge this is the first study in LAC that includes polarisation measures, along with inequality and poverty indicators, as potential covariates of institutional and conflict variables.
Most of the empirical research is ideally aimed at detecting causal relationships among variables. Is the income distribution affecting the development of certain institutions, and provoking social tension, conflicts and violence? Or the causality goes in the
opposite direction, e.g. certain institutions preclude changes in the income distribution?
Are there some factors affecting the income distribution and the political institutions at the same time, and then creating a correlation without causality between them? As commented above, these questions are very difficult to answer, and we do not attempt to do it in this paper, due to the unavailability of the data needed for that task. We do show the structure of correlations among variables, and try to lay down consistent interpretations of the results based on the theory.
We divide the empirical research into two stages. First we explore the relationship between measures of the income distribution and institutions, and then we investigate the links between these variables and measures of conflict, instability and corruption.
The rest of the document is organised as follows. In section 2 we survey the literature on the links between income distribution, institutions, conflict and corruption. Section 3 discusses alternative measures of different dimensions of the income distribution. We present the database from which we draw the statistics, and summarise the main patterns. In section 4 we survey an increasing number of studies containing data on institutions, conflicts and corruption, and show basic statistics for the region. In sections 5 and 6, which are the core of the paper, we show and discuss the results of empirically analysing the relationship between income distribution, institutions, conflicts and corruption in Latin America and the Caribbean. We close in section 7 with some brief concluding remarks.
2. The literature
institutions as a black box, and hence a literature on institutions, identified nowadays as the New Institutional Economics, started to develop. All of this provided the necessary inputs for the theories linking income distribution with institutions and conflict to emerge.
In this paper we are particularly interested in those contributions that empirically assess these links. That literature, which has been growing at a fast pace, faces the problem of causal inference, in particular due to the need of relying on cross-country statistical
analysis.2 Although researchers are using state-of-the-art techniques to disentangle the
links between income distribution, institutions and conflict, the issue of causality remains pretty much unsolved.
Ritzen, Easterly and Woolcock (REW) (2000 and 2005) put forward the hypothesis that social cohesion (in their paper measured by income inequality, share of middle class and ethnic fractionalisation) determines institutional quality, which in turn is a key determinant for economic growth. In a similar vein Keefer and Knack (2002) conjecture that social polarisation (measured as income inequality, land inequality and ethnic fragmentation) affects growth through the institutional channel. They argue that the rule of law is endogenous to social polarisation: a more polarised economy would cause investors to perceive the rule of law not as a solid institution, and flee away from the
country, affecting economic growth. Glaeser (2005) finds that a balanced income
distribution is highly correlated with high quality institutions, but is very cautious not to speak of causality given the identification problems commented above.
After reviewing the negative correlation between income inequality and institutional quality, Chong and Gradstein (2004, 2005) put forward the idea of bidirectional causality. While it could be true that better institutions cause a reduction in income inequality, they propose a model where it also could happen that economic conditions,
as an increase in income inequality, cause institutions to deteriorate.3 Making use of
state-of-the-art econometrics, such as GMM techniques and VAR, they find supporting evidence for the double-causality theory. They conclude that the link that goes from income inequality to institutions is stronger than the one that goes the other way.
The view that economic conditions, such as the shape of the income distribution, may affect institutional quality is not new. Engerman and Sokoloff (1997, 2002, 2005) argue that initial factor endowments, such as the distribution of wealth, human capital and political power, play a key role in accounting for the dissimilar degree of institutional development among former colonies. Boix (2003) also argues that higher income inequality induces a lower probability of democratisation.
2 A typical bias appears when omitting a variable correlated with the treatment variable that also affects
the dependent variable. Other frequently-found problems are the self-selection, the post-treatment and the non-independence biases. For an in-depth analysis of these issues see Przeworski (2005).
3 See also Cervellati
So far we have reviewed papers dealing with the link between income distribution and institutions. Now we focus on the relationship with conflict and instability. One of the classic references for this topic is Alesina and Perotti (1996). This paper argues that income inequality generates social discontent that translates into political conflict and instability. They find empirical evidence validating the hypothesis in a sample of 70 countries for the period 1960-85. Then, they argue that political instability reduces investment, which in turn harms the growth process. Sachs (1990) studies how high income inequality in Latin America stimulates social disorder and political conflict. He argues that social discontent prevent leaders from applying good policies and turn them into populist ones.
Regarding the link between corruption, institutions and income distribution, the literature is vast and growing. The theoretical underpinnings for this link are drawn from the ideas of Krueger (1974). She asserts that corruption could create inefficiencies that are beneficial to some groups of people and harm others. The idea later develop by other scholars is that corruption may help the rich stay rich and prevent the poor from escaping poverty, increasing the level of inequality in the income distribution. Corruption distorts institutions of governance, and through the institutional channel affects the income distribution.
One of the main empirical references is Li et al. (2000). They find that the relationship
between corruption and income distribution is not linear, but has an inverted U shape.
Gupta et al. (2002) find that corruption increases income inequality and poverty through
various channels. They argue that by biasing the tax system in favour of the rich and powerful, not targeting social programs, lowering social spending, and providing an unequal access to education, corruption increases income inequality and poverty. They test this hypothesis using cross-country regressions for the period 1980-1997. In order to asses causality they instrumentate the variables, and argue that corruption is the cause of both income inequality and poverty.
In a recent paper for the US states Dincer and Gunalp (2005) also find that corruption increases income inequality. One of the advantages of this study is the use of information from only one country, which ameliorates the problem of data comparison across countries.
3. Measures of income distribution
The term income distribution refers to a list specifying the income level of each
individual in the economy. Several dimensions can be defined from an income distribution: poverty, inequality and polarisation are among the most relevant ones. Poverty basically refers to the proportion of people below a threshold income level known as poverty line; inequality refers to proportional differences in income levels across the population, while polarisation is related to groups internally homogeneous that antagonize each other.
In this paper we measure poverty as the proportion of individuals with household per capita income below a threshold level. We take the international standard of USD2 a
day at PPP values as the poverty line.4 The USD-2-a-day line is used, along with the
USD-1-a-day line, to monitor the Millennium Development Goals in middle-income countries, like most of the LAC ones. Although the USD-1 or 2-a-day lines have been criticised, their simplicity and the lack of reasonable and easy-to-implement alternatives have made them the standard for international poverty comparisons.
The economic unfairness of a society has always been associated to income inequality. The concept of inequality is closely linked to the principle of Dalton-Pigou: a transfer from an individual with higher income to another individual with lower income
generates a more equal distribution.5 The literature on the measurement of inequality is
vast. In this paper although we report a set of indices to characterise inequality in the region, we focus on the Gini coefficient when turning to the empirical analysis of the interactions between inequality, institutions and conflict.
The notion of polarisation refers to homogeneous clusters that antagonize with each other. The difference with inequality can be explained with an example. Suppose a country with six persons labelled as A, B, C, D, E, F with incomes equal to $ 1, 2, 3, 4, 5 and 6, respectively. Suppose now two transfers of one peso: the first one from C to A, and the second one from F to D. The two transfers are equalizing (from richer to poorer persons), so all inequality indices complying with the Dalton-Pigou criterion will fall, or at least not increase. The inequality analysis assesses the new situation as “better” than the initial one. In particular, it is expected that the new distribution leads to a more stable society.
4 See Ravallion
et al. (1991), Chen and Ravallion (2001) and SEDLAC (2005).
Histograms of the income distribution
Before and after an inequality-decreasing but polarisation-increasing transfer
Before transfers After transfers
0 1 2 3
1 2 3 4 5 6
Income levels
Nu
m
b
er
of
in
div
idu
als
0 1 2 3
1 2 3 4 5 6
Income levels
N
u
m
b
er
of
indiv
id
u
a
ls
Less unequal More polarised
Notice, however, that in this example the new income distribution has three persons with $ 2 (A, B and C), and three persons with $5 (D, E and F). The population in this country is divided into two clearly differentiated groups that are internally perfectly homogeneous. Although less unequal, this society has become polarised. In the new situation people may identify themselves as part of clearly defined groups which are significantly different from the rest. This polarisation may derive in greater social tension than in the initial distribution, and then in more social and political instability. The polarisation measures depend on the degree of equality within each group (identification) and the degree of differences across groups (alienation). In this paper we present several measures of income polarisation, but for simplicity we concentrate in the indicator recently developed by Duclos, Esteban and Ray (2004) when analyzing the interactions with institutions and conflicts.
The previous example is designed to illustrate a case where polarisation goes in opposite direction to inequality. However, it is likely that in most cases polarisation and inequality go in the same direction. Thus, the analysis of polarisation should be viewed as complementary to that of inequality. Both polarisation and inequality are different although related dimensions of the same distribution.
Social cohesion and the development of a strong institutional framework surely depend on both economic and non-economic variables. Even in a quite economically homogeneous society tensions may emerge because of, for instance, religious or racial differences. Similarly, a very economically-polarised and unequal society may exhibit high social cohesion and strong institutions if the sharing of some values, ideas and views is strong. Even if the income distribution remains stable in a given period of time,
internal tensions may decrease under certain circumstances (e.g. under a war with other
country) and increase in others. This study focuses only on economic inequality,
polarisation and poverty. We expect these measures to be positively correlated with situations of instability, lack of social cohesion, social tensions, and violence.
This study deals with the income distribution. Income is usually taken as a proxy for
or access to basic services. In this document we follow the tradition of studying the income distribution as a proxy for the distribution of living standards.
We study static measures of the income distribution i.e. those computed from
cross-section data from household surveys. Following the above example, suppose that for seasonal reasons individuals A, B and C earn $2 per month in the first half of the year and $ 5 per month in the second half, while individuals D, E and F earn $5 in the first semester, and $2 in the second one. In each semester, the income distribution is unequal and polarised; however, on average the yearly income distribution is egalitarian and not polarised. Unfortunately, household surveys do not follow individual over long periods of time to allow computing a more dynamic picture of the income distribution. The inequality studies exploiting the few short panels in the region suggest that although the levels of income inequality are lower than when using cross-sections, the basic patterns persist. In particular, the region continues exhibiting very high levels of inequality. Our conjecture, then, is that the income distribution picture emerging from our study would not be very different from the one obtained with panel data.
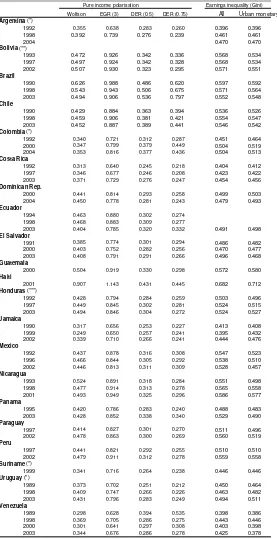
The income distribution statistics of this paper are based on microdata from a large set of household surveys carried out by the National Statistical Offices of the LAC countries in the period 1989-2004. The database used for this study is a sample of a larger database put together by CEDLAS and the World Bank: the Socioeconomic Database for Latin America and the Caribbean (SEDLAC). The sample includes information for Argentina, Bolivia, Brazil, Colombia, Costa Rica, Chile, Dominican Republic, Ecuador, El Salvador, Guatemala, Haiti, Honduras, Jamaica, Mexico, Nicaragua, Panama, Paraguay, Peru, Suriname, Uruguay and Venezuela (see table 3.1). The sample covers all countries in mainland Latin America and four of the largest countries in the Caribbean – Dominican Republic, Haiti, Jamaica and Suriname. In each period the sample of countries represents more than 92% of LAC total population.
Whenever possible we select three years in each country to characterize the two main periods in the last 15 years: the growth period of the early and mid 1990s when several structural reforms were implemented, and the stagnation and crisis period of the late 1990s and early 2000s. Unfortunately, there is not enough information to characterize the recent recovery of the LAC economies that started around 2003.
In what follows we briefly comment on the main patterns of the income distribution in
the region.6 As commented above LAC is characterised by high levels of polarisation
and inequality compared to the rest of the world. Poverty is also relatively high, although lower than in Africa and most of Asia. Table 3.2 presents a set of polarisation, inequality and poverty measures computed over the distribution of household per capita income, while table 3.3 shows statistics for the distribution of earnings.
There is a considerable degree of dispersion among the countries in the region in the three distributional dimensions (Figure 3.1). A set of nations have relatively low (for LAC standards) levels of inequality, polarisation and poverty: Uruguay, Costa Rica and to a lesser extent Argentina belong to that group. Chile enjoys low poverty despite relatively high levels of income inequality and polarisation. To a lesser extent that is also the case of Brazil, Panama and Colombia. Some countries are characterised by high inequality and poverty: Haiti and Bolivia are the two main examples.
Correlation among polarisation indices is high (Table 3.4). These indicators are also highly correlated to inequality measures, in particular to the Gini coefficient. Countries with high inequality tend to have also a highly polarised income distribution. Due to this fact, in the analysis that follows we find similar interactions between institutions/conflicts and either polarisation or inequality. The correlations with poverty are instead much weaker. In the case of the polarisation indicators, the correlations with the poverty headcount ratio are positive but not significant at the 5% confidence level. The poverty measures that take the income distribution among the poor into account (e.g. FGT(2)) are more closely linked to polarisation and inequality indices.
Although LAC countries share many structural characteristics, have experienced similar shocks, and most of them have carried out similar economic policies during the 1990s, the distributional performances have been strikingly heterogeneous (see Figure 3.2). Polarisation and inequality decreased in Mexico, Brazil, El Salvador, Nicaragua and also slightly in Chile. In contrast, the income distributions in Argentina, Uruguay, Colombia, Venezuela, Costa Rica, Bolivia, Panama and Peru became more polarised and unequal. In some cases the changes have been small and even negligible, but in others changes have been sizeable. That is the case of Argentina, Colombia and Venezuela, where poverty also went significantly up. Instead, income poverty was reduced in Chile, Brazil, urban Bolivia and some Central American countries.
Summarizing, on average changes have been small: polarisation and inequality slightly increased, while poverty went moderately down in the region. However, as stated above, the behaviour of the averages is not a good representation of the great diversity of experiences within the region.
6 A detailed analysis of polarisation and inequality statistics can be found in a companion paper
4. Measures of institutions and conflicts
In the last decades there has been a renewed interest among economists in understanding the working of institutions. The economists’ policy prescriptions were usually based in models that treated institutions as a black box, and as a consequence did not take the form of government, the country’s history or their culture and habits into account.
In this paper we follow North’s (1990) definition: “Institutions are the humanly devised constrains that structure human interaction. They are made up of formal constrains (e.g.,
rules, laws, constitutions), informal constrains (e.g., norms of behaviour, conventions,
self-imposed codes of conduct), and their enforcement characteristics”. Ideally, we would like to have separate and objective measures of formal and informal institutions, although, naturally, measuring informal constraints is an extremely hard task.
In this paper we use two types of measures: indices of broad-base institutions, and measures of specific political institutions. The first type of indices combines information on formal institutions with measures of the actual functioning of certain institutions and rules. For instance, indices do not just look at what a Constitution says about property rights, but try to assess the actual respect for the private property. Naturally, this introduces some subjectivity into the measures, since the assessment of the working of institutions cannot be made on fully objective grounds. However, disregarding informal institutions for the sake of objectivity may not be a good solution. For instance, although many Latin American constitutions are inspired by the US or European constitutions, the actual functioning of the formal institutions is certainly very different.
The measurement of specific political institutions, instead, can be done in a relatively objective way. Once we agree on the formula to compute the index, the measures are easily reproduced by any researcher.
OECD countries have developed stronger institutions than LAC countries (Figures 4.1
and 4.2).7 For instance, for the RLI the average OECD value is higher than the
maximum in LAC (Chile). In fact, Chile seems an outlier in the LAC context. If we take that country out of the sample, the contrast is even more impressive. OECD countries are also more homogeneous than LAC nations regarding institutions. The coefficient of variation for the VAI is 0.04 for OECD, and 0.31 for LAC.
Now we focus on LAC, and add the Government Effectiveness Index (GEI) into the analysis. This indicator measures the quality of public service provision, the quality of the bureaucracy, the competence of civil servants, the independence of the civil service from political pressures, and the credibility of the government’s commitment to policies.
Figure 4.3 documents the large institutional volatility in the region. Over the last decade LAC countries have experienced an increase in the lack of respect for the rule of law, but the participation of the citizens in the selection of government continued to grow.
The second panel in figure 4.3 focus on the VAI and breaks down LAC in three regions:
South America, Central America and the Caribbean.8 South America has become the
worst region in terms of Voice and Accountability after the problems of representation that various countries (Ecuador, Peru, Colombia, Bolivia, Venezuela and Argentina) have suffered during this period.
Figure 4.4 illustrates other broad-base institutions indices: the Political Constraint Index, the Legal Structure Index and the Democracy Index. Chile ranks as one of the countries with the best institutional quality in LAC, while Haiti ranks as the worst.
The rest of the section is aimed at presenting statistics on conflict and corruption.Table
4.3 shows the Political Stability and Absence of Violence Index (PSAVI), and the Control of Corruption Index (CCI) for LAC countries. The PSAVI (also labelled as the General Conflict Index) combines several indicators which measure perceptions of the likelihood that the government in power will be destabilized or overthrown by possibly unconstitutional and/or violent means, including domestic violence and terrorism. The CCI is a measure of perceptions of corruption, defined as the exercise of public power for private gain.
The level of conflictivity is substantially higher in LAC, when compared to OECD countries (figure 4.5). A majority of LAC countries has negative values for the Political Stability and Absence of Violence index, while in the OECD just one country, Turkey, out of 29 is in that situation. Again, the dispersion in this index is significantly higher for LAC countries (0.64 vs. 0.09 in the OECD).
7 For comparison purposes we take Mexico out of the OECD group since it also belongs to LAC.
8 By concentrating in the VAI more countries could be included in the graph (compared to the first panel
During the last decade (1996-2004) there has been an increase in the level of conflict in the region (figure 4.6). This was mainly driven by the political conflicts that unravelled in many South American countries during this period. Central America is the only region that experienced a positive change in this index when looking at the whole decade. Since 2000 the level of conflict seems to have risen across all Latin America.
Figure 4.7 illustrates the country values of the Labour Standard Index (LS) (also known as Labour Conflict Index). This index is a composed measure of the worker’s freedom to organize themselves, negotiate collectively and to be declared in strike. It covers a variety of rights violated, but does not measure the frequency of its violation neither the quantity of workers affected by such violations. Venezuela, that lags behind in most of the institutional and general conflict indicators, is one of the countries with the lowest levels of labour conflict.
Corruption is also perceived as a more serious problem in LAC countries than in the OECD. Figure 4.8 shows enormous differences between the two regions. With the exceptions of Chile, Costa Rica, Uruguay and Suriname, all LAC countries have negative values in the CCI.
5. Income distribution and institutions
As discussed in previous sections, there are several arguments suggesting a link between the income distribution and the development of certain institutions. In this section we provide some empirical evidence on these links.
The literature points out that the income distribution may interact with both the broad base institutions of a country and its specific political institutions. More equal or less polarised economies with lower poverty rates are expected to be found in more democratic countries with better institutions. The second link is more subtle as it refers to specific formal institutions that regulate the political process of a country. At that level, the links with the income distribution are more complex and weaker, and hence more difficult to document in the data. For this reason, this section is mainly focused on the relationship between the income distribution and the broad-based institutions. We start by comparing LAC with the industrialised countries, and then focus the analysis on Latin America and the Caribbean.
5.1. Comparing LAC to the advanced countries
In this section we compare LAC to a sample of industrialised countries. In that group
we include most European countries plus Australia, Canada, Israel, Taiwan and the US.9
For simplicity, we call that group Advanced Countries (AC).
9 In Europe the sample includes Belgium, Czeck Republic, Denmark, Finland, France, Germany,
Table 5.1 shows the (non-weighted) mean of the main indicators of income distribution and broad-based institutions in LAC and AC countries in the late 1990s. As income distribution measures we include the DER index of polarisation and the Gini coefficient
of inequality.10 We include six measures of broad-base institutions discussed in section
4: the Rule of Law index, the Voice and Accountability index, the Legal Structure index, the Government Effectiveness index, the Democracy index, and the Political
Constraint index. Naturally, these measures are significantly correlated.11 However, the
correlation is not perfect, so we include them all to check the results for robustness.
The last column in table 5.1 records the difference in each variable between AC and LAC and indicates with a star whether that gap is statistically significant. LAC countries are more polarised and unequal than the advanced countries. The differences are not only statistically significant but economically large. A difference of 10 points in the DER or 20 points in the Gini are signs of dramatic differences in the income distributions between these two groups.
The gaps are also significant in term of institutions. In all six measures considered the differences in favour of the advanced countries are positive and large. The strong process toward democratisation in Latin America in the last three decades has reduced
the gap in some variables (e.g. the Democracy index and the Political Constraint index),
although significant differences still persist.
Income distribution and broad-based institutions measures are negatively correlated in the country data (table 5.2). Countries with high levels of income polarisation are more likely to be institutionally weak. The correlations seem statistically strong over the whole period (early 1990s to early 2000s) and in each sub period. When controlling for the level of per capita GDP (in PPP terms) most of the correlations remain significant, although the values become smaller. This evidence indicates (still at a very preliminary level) that although the level of development can account for much of the relationship between income polarisation and institutions, the link between these two variables may go beyond that.
Figure 5.1 suggests that the correlations may be driven mainly by the differences between the two groups (LAC and AC). In all the scatterplots the cloud of observations for LAC is clearly differentiated from the AC set of points. To take that into account we run regressions of distributional measures on institutional indicators, controlling for (log) per capita GDP and a dummy for LAC. The results in table 5.3 indicate that the relationship between polarisation/inequality and broad-based institutions remains negative and significant.
So far, the empirical analysis suggests a link between the shape of the income distribution and the strength of its institutions. The results however do not point out to a
10 We do not include poverty since poverty measures based on international standards are not usually
available for developed countries.
particular dimension of the income distribution or to a particular characteristic of the institutional framework. Results for income polarisation and inequality are basically the same. The low number of observations and the high correlation between indicators make difficult to distinguish the potential different effects of the two dimensions of the income distribution.
The same applies for most of the institutional indicators. The Rule of Law index, The Voice and Accountability index, the Legal Structure index, and the Government Effectiveness index are all closely related to the income distribution. The relationship seems somewhat weaker in the case of the Democracy index and the Political Constraint index. As discussed above, LAC countries have strongly moved forward toward institutionalised democracies, and in that respect they are not very different from the AC societies. However, they are still lagging behind in terms of the effective functioning and respect for the institutions governing their interactions.
5.2. Distribution and institutions within LAC
In this section we restrict the analysis to our sample of Latin American countries. That allows us to focus the study in the region, to reduce comparability problems, and to add poverty into the analysis. LAC can be divided into three regions: (i) Southern South
America (SSA) that includes Argentina, Brazil, Chile, Paraguay and Uruguay,12 (ii) the
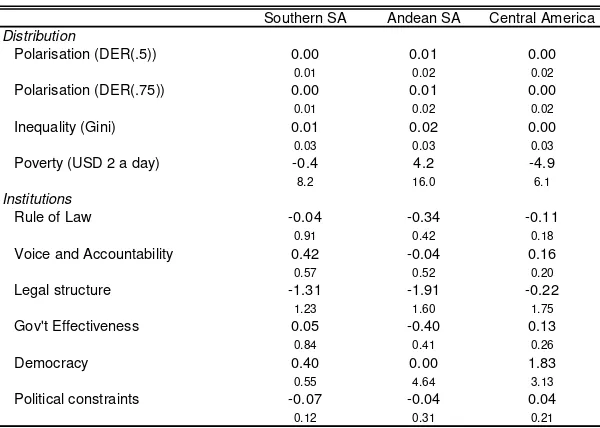
Andean South America (ASA), including Bolivia, Peru, Ecuador, Colombia and Venezuela, and (iii) Central America (CA) that includes countries in that region plus Mexico and the Caribbean countries. Table 5.4 shows that the regions are not significantly different in terms of mean inequality and polarisation. In contrast, given that the level of GDP is significantly higher in SSA, poverty is also lower in that region compared to the rest of Latin America. All institutional indices are also significantly higher in SSA. The result of the comparison between CA and ASA depends on the indicator.
Table 5.5 shows changes in the distributional and institutional indicators over the 1990s and early 2000s. There was not much action in the distribution when regional means are considered. On average, only the Andean countries became more polarised and unequal. However, as discussed in section 3 the quiet mean is in some cases the consequence of substantial changes in different directions within a region. This is for instance the case in SSA, where while polarisation increased in Argentina and Uruguay, it went down in Brazil and Chile (at least when measured by the DER 0.5). On average, poverty did not significantly changed in Southern South America, it went up in the Andean region and decreased a bit in Central America.
On average changes in institutional variables were small. The results are not robust, as patterns in regional means change sign from one indicator to another. Only the Andean region appears to have suffered a clear process of weakening institutions.
At the country level there seems to exist a close link between the income distribution and the institutional strength. The correlations in table 5.6 and the scatterplot in figure 5.2 and 5.3 suggest that more polarised/unequal/poor countries are on average also those with weaker institutions. The correlations seem particularly strong with the Rule of Law index, the Voice and Accountability indicator, and the Government Effectiveness index. Poverty is also significantly negatively correlated to the Democracy index. Most of the correlations remain significant when controlling for per capita GDP, although the values are substantially reduced.
Box 1: The Chilean particularism
Chile is omitted in the scatterplot of figure 5.2 and in the correlations because it has particularly very high levels in the institutional indicators and in the polarisation/inequality indicators. This extreme combination goes against the negative relationship between these two variables that seems to be present in the rest of LAC. Two reasons can be argued to treat Chile as a special case. First, that country has experienced a very fast increase in the institutional indicators that contrast with the rest of the region. Chile was not significantly different from the rest of LAC three decades ago. The fast change in institutional strength captured by the statistics may affect growth (and hence poverty) relatively fast, but modify the income distribution slowly. The second reason has to do with a measurement problem that is exclusive of Chile. The household survey (CASEN) is adjusted to match National Accounts: in particular capital income is greatly expanded, inflating the measures of inequality and polarisation (but only slightly affecting poverty indicators). Although Chile is surely a very polarised/unequal country, the recorded level is likely overestimated compared to the rest of LAC, and then moves Chile away from the regression line in figure 5.2.
There seems to be some relationship between the level of different dimensions of the income distribution and the level of some broad-based institutions indicators. The links become weaker or even vanish when considering changes over the last decade. The topic is relevant: have changes in the income distribution experienced by LAC countries since the early 1990s been associated to changes in their institutional situations? Figure 5.4 and table 5.7 do not offer strong evidence for this hypothesis. Although in most cases the correlations have the expected sign (negative) they are non-significant.
fixed effects. In contrast, the coefficients remain significant when using poverty as the left-hand-side variable.
Table 5.8 shows the regression when controlling for per capita GDP (at PPP). We also run regressions with several other controls: social spending, spending in education and health, indices of reforms, indices of trade liberalisation, and terms of trade. The basic results remain unchanged. We do not include all the controls together because of low degrees of freedom.
Summing up, poverty is the only distributional dimension for which the negative link with institutions holds when considering changes. This result makes sense. An improvement in the institutional environment may be quickly translated into a better business climate and better conditions for investments, which in turn may foster economic growth, which implies lower poverty given a stable income distribution. While some Latin American countries seemed to have experienced this virtuous process (Chile and some Central American countries are the main examples), some others have suffered a similar process but with the opposite sign: Argentina, Colombia, Paraguay and Venezuela are the main examples. Although the income distribution may quickly translate horizontally, reducing or increasing poverty, the shape of the distribution is much more difficult to transform. To say it in a more colloquial way: an improvement in the institutional setting may serve to increase the size of the cake relatively fast, but it takes time to change the way it is divided among the population. Both the income distribution and the broad-based institutions change slowly over time, so it is reasonable that we cannot capture a clear pattern of association in a short period of time with noisy measures.
Box 2: Malapportionment
As stated above, the relationship between the income distribution and the specific political institutions is more subtle and hence more difficult to analyze empirically. In this box we comment the results of studying the case of malapportionment. The literature has recently stressed legislative malapportionment as a measure of inequality
in representation.13 Malapportionment means a discrepancy between the shares of
legislative seats and the shares of population held by electoral districts, and implies a
failure in the golden rule “one person-one vote”. A score of x% in the malapportionment
index (MI) means that x% of seats are allocated to districts that would not receive those
seats in case of perfect apportionment. Samuels and Snyder (2001) show that the MI is significantly higher in LAC than in the rest of the world, even when controlling for
other institutional variables.In our sample the MI index is 0.08 for LAC and 0.03 in the
advanced countries (the difference is statistically significant at 1%).
The linear correlation between the DER measure of income polarisation and the MI index is positive and significant (0.61) when using the extended sample of LAC and AC countries. The relationship holds when controlling for GDP and when including a dummy for LAC in a regression. When restricting the analysis to the sample of LAC countries the positive relationship between malapportionment and polarisation/inequality/poverty remains. Countries that violate the golden rule “one person-one vote” are those where the political process tend to favour pivotal voters, which could translate into a more unequal/polarised distribution, and given a level of national income, also into higher poverty.
6. Income distribution, conflict and corruption
In this section we turn to the relationship between conflict and income distribution. As discussed above the available data does not allow disentangling causal relationships. However, in most of the discussions in this section we implicitly tend to view conflicts as caused, among other factors, by different dimensions of the income distribution. We also briefly examine in this section the potential relationship between the income distribution and corruption.
In order to capture the level of conflict in the society we use the Political Stability and Absence of Conflict Index (PSAVI) (also named General Conflict indicator). This indicator, introduced in section 4, is measured in units ranging from -2.5 to 2.5, with higher values corresponding to a system which is least likely destabilised or overthrown, and where conflict plays a minor role. We also use the Labour Standard Index (LSI) discussed in section 4. This index is measured in units ranging from 0 to 76.5, with higher values corresponding to less respect for the worker’s rights. We expect to find high values of the LSI in highly polarised/unequal societies. To measure corruption we use the Control of Corruption Index (CCI). This index is measured in units ranging from -2.5 to 2.5, with higher values corresponding to less corruption.
6.1. LAC and the advanced countries
As discussed in section 4 LAC and AC countries are substantially different in terms of conflicts and corruption. Table 6.1 shows the average values for the PSAVI and the CCI. The differences in means between the two groups in both variables are clearly significant. In table 6.2 we show simple and partial correlations between income distribution, and conflict/corruption variables. Countries where polarisation and
inequality are high tend to be those with high levels of conflict and corruption.14 Even
when we control for GDP per capita the correlations remain significant. Figure 6.1
14 Notice that the variables measure the
suggests that observations from LAC and from AC countries are far from each other. The advanced countries are almost all located at the bottom right of the figure, indicating low levels of both conflict and polarisation. It is remarkable how homogeneous these countries are compared to LAC. When running a regression with a LAC dummy both income distribution indicators remain significant.
Corruption is also correlated to income distribution (table 6.2). Figure 6.1 shows a somewhat different pattern than for the case of the General Conflict Index. Now the advanced countries are more dispersed and the LAC countries are more homogeneous. Despite the fact that the advanced countries have low levels of polarisation, some of them still have serious problems of corruption.
6.2 Distribution, conflict and corruption within LAC
In this section we restrict the analysis to our sample of LAC countries. Table 6.4 illustrates that, as with the institutional variables, there are significant differences across regions within LAC. Southern South America has lower levels of conflict (measured by both the PSAVI and the LSI) and corruption than the rest of LAC. Table 6.5 shows changes in the conflict and corruption indicators over the 1990s and early 2000s. On average, changes in the General Conflict Index were small for the SSA, but considerable in the ASA and CA. This does not mean that for all the countries in the
SSA region there has been no change, but instead that some countries (e.g. Chile) have
experienced improvements while others (e.g. Argentina) have suffered an increase in
the level of conflictivity. The Andean region appears to have experienced a process of escalating conflict and instability, which translated into a loss of almost 1/3 of a point in the General Conflict Index. Central America, on the other hand, moved up 0.35 points in the scale.
Regarding the Control of Corruption Index, on average the SSA region is the one that improved the most, with again different paths across the countries of that region. The ASA experienced a similar pattern with a positive overall mean.
The correlations in table 6.6 and the scatterplots in figure 6.2 and 6.3 suggest that more polarised/unequal/poor countries are on average also those with higher levels of conflicts (both general and labour conflict). The correlations with the General Conflict
index remain significant when controlling for per capita GDP.15 In fact, the values are
almost unchanged when including controls. The correlations with the measures of control of corruption have the expected sign (negative), although the relationships do not seem strong, in particular when we control for other variables.
15 Colombia is omitted in the scatterplot of figure 6.3 and in the correlations because it has very high
Table 6.7 and figure 6.4 show that some of the links become weaker or even vanish when considering changes over the last decade. However correlations between changes in the General Conflict Index and changes in inequality and poverty remain significant.
Table 6.8 shows the results of panel regressions where we control for fixed effects. Changes in polarisation, inequality and poverty seem to be related to changes in conflict. This piece of evidence is consistent with the idea that increasing levels of polarisation, inequality and poverty generate a hostile atmosphere within the society that could imply higher levels of social conflict and political instability. The relationship with corruption, instead, is not clear.
In what follows we include a set of institutional controls to the analysis. It has long been argued that institutions are key features to understand social conflicts. This was the main argument in Thomas Hobbes’s famous Leviathan where he asserts that without a powerful State conflict between people were unavoidable. Nowadays a vast majority of
the academic field agrees that a State needs to set the “rule of the game” as clear as
possible in order to avoid conflict and instability.
Table 6.9 illustrates the high correlations between institutions and conflict in the LAC context. Countries which succeed in developing an environment in which fair and predictable rules form the basis for economic and social interactions are those with less conflict and corruption. One interesting finding is that the variable that measures the degree of institutionalized democracy is not significantly correlated with the control of corruption. This could be due to the fact that institutionalized democracy is related to some institutional process, like for example voting, but it does not take into account the informal constrains that shape the way democracy actually works. Democracy in LAC is today much more common than what it used to be, and without any doubt this was an enormous step forward for the region. But having to vote every now and then, having a constitution that protect freedom and private property, and having a constitutional separation of powers does not mean that democracy is working as it should.
The regression results for the General Conflict index when institutions are included in the analysis are shown in table 6.10. In the right hand side we include income distribution measures, along with institutional indicators and other controls (basically GDP per capita, although we tried with several variables).
The results suggest that both polarisation and inequality are closely related to situations of conflict. The measures of these distributional dimensions are always significant when controlling for different institutional measures. That is not the case with the poverty headcount ratio: coefficients have the expected signs but seem to be non-significant.
The income distribution coefficients are non-significant for the Control of Corruption Index. The Rule of Law and Government Effectiveness Index are the only significant institutional variables in the regressions. This means that the quality of the bureaucracy, the competence of civil servants, the independence of the civil service from political pressures, and the credibility of the government’s commitment to policies (GEI) are correlated with the degree of corruption even after controlling for the level of economic development and the level of income distribution.
Box 3: Trust and political views: evidence from the World Values Survey
The shape of the income distribution surely interacts with the views and values of a society. In this box we briefly analyse this issue by using the World Value Survey (henceforth, WVS). This survey is a worldwide investigation of basic values and beliefs
carried out in more than 80 countries.16 We use data for 77 countries taken mostly from
the 1999–2000 round of the survey.17 Table B.1 shows mean values for LAC, the Rest
of the World (RW), and a set of Advanced countries (AC).
The concept of social cohesion is related to that of trust. Social cohesion implies the
sharing of common values and the respect for each other. The first row in Table B.1 records the mean across countries of the share of individuals that respond that in their countries “most people can be trusted”. The difference between LAC and the rest of the world is noticeable. On average, only 17%t of people in LAC answer this question positively, in contrast to 30% in RW and 37% in AC.
The share of people that strongly agrees with the statement that “democracy is the best
form of government” is higher in LAC than in the rest of the world, and similar than in the advanced countries. Compared to this group more people in LAC believe that “the country is run by a few big interests” and that “the entire way our society is organized must be radically changed by revolutionary action”. However, there are large differences in the acceptance of these two propositions. While on average 70% of the population believes that governments are “captured” by a few groups, only 9% seems to approve revolutionary actions.
16 The WVS has given rise to more than 300 publications, in 16 languages. The project is being carried
out by an international network of social scientists. Coordination and distribution of data are based at the Institute for Social Research of the University of Michigan.
17 The countries in the sample are: Albania, Algeria, Azerbaijan, Argentina, Australia, Austria, Armenia,
Income inequality and trust are negatively correlated in the country data (table B.2). When controlling for the level of per capita GDP, and for the percentage of unskilled people in each country the correlation remains significant. There is a weak negative correlation between income inequality and the support to democracy as the best form of government. Finally, higher levels of income inequality seem to be related to the acceptance of radical actions.
Figure B.1 shows the scatterplots of these relationships. It is interesting to notice that given their levels of inequality, LAC countries are in general more prone to accept democracy and to avoid revolutionary changes. Table B.3 shows that income inequality is associated to less confidence in democracy and more acceptance of radical changes, even after controlling for the level of economic development and a LAC dummy.
The signs of these dummies confirm the higher acceptance of democracy in LAC (controlling for the level of GDP and inequality). That characteristic could be due to the process of learning that these countries had gone through years of painful dictatorial regimes.
7. Concluding remarks
This document explores the relationship between income distribution, institutions and conflicts in Latin America and the Caribbean by using a new database of income distribution statistics. As it is well known in the cross-country literature, the evidence is mostly limited to correlations between variables, rather than causal relationships. Nonetheless, we put forward a set of hypothesis consistent with the empirical results of the paper.
Countries that are institutionally weak are more likely to have high levels of income disparities. This result is robust to different measures of polarisation and inequality, and holds even when controlling for GDP and other variables.
In contrast, we could not find a robust association between changes in the income distribution and changes in various broad-based institutions in LAC over the last decade.
Poverty is the only variable for which the negative link with institutions holds when considering changes since the early 1990s. We argue that improvements in the institutional environment quickly foster investments and economic growth, which in turn contribute to lowering poverty, but better institutions cannot be easily translated into equalizing changes in the income distribution.
In summary, the paper suggests that institutions and conflict interact in different ways with the various characteristics of the income distribution. There is some evidence that in the LAC context institutional development has been associated to lower poverty, but not significantly lower inequality and polarisation. Instead, conflicts seem more related to inequality and polarisation than to income poverty.
Income disparities are associated to a lower sense of trust, less confidence in democracy and more acceptance of radical changes. Since inequities are relatively high in Latin America and the Caribbean, the region seems more prone to situations of political instability, social tension and conflict. However, on the other hand, when controlling for inequality LAC countries seem to have a higher acceptance of democracy, a fact that could be due to the process of learning that these countries had gone through years of painful dictatorial regimes.
Some LAC countries (e.g. Chile and some Central American economies) seem to have
followed a virtuous path of stronger institutions, sustainable growth, and lower poverty. However, very few countries have managed to reduce income polarisation/inequality. In that scenario, situations of conflict, social tension and instability are always latent.
Another group of LAC countries have suffered a cycle of institutional and economic
setbacks (e.g. Argentina and Venezuela). The combination of weaker institutions with
larger inequalities quickly translated into situations of social tension and conflict.
References
Alesina and Perotti. (1996) "Income Distribution, Political Instability, And Investment," European Economic Review, v40(6,Jun), 1203-1228.
Alesina, A. Devleeschauwer, A. Easterly, W. and Kurlat S. "Fractionalization" - Journal of Economic Growth, vol. 8, no. 2, June 2003, pp. 155-194.
Atkinson, A. and Bourguignon, F. (2000). Income distribution and economics.
Handbook of Income Distribution. Elsevier Science B.V. Pg. 1-5, 41-50.
Boix, C. (2003): Democracy and Redistribution. Cambridge University Press, Cambridge.
Bourguignon, F. and Morrison, C. (2002). Inequality among world citizens: 1820-1992.
American Economic Review 92 (4), 727-743.
Cervellati, Piergiuseppe, Sunde (2005) Hobbes to Rousseau: Inequality, Institutions, and Development IZA Discussion Paper No. 1450
Chong, A. and M.Gradstein (2005) “Inequality and Institutions” IADB
Chong, A. and M.Gradstein (2004) “Inequality and institutions,” CEPR Discussion Paper. 4739.
Cowell, F. (2000). Measuring inequality. LSE Handbooks in Economic Series, Prentice
Hall/Harvester Wheatsheaf.
Database of Political Institutions: Changes and Variable Definitions Philip Keefer Development Research Group - The World Bank Issued: March 2002
Deaton, A. (1997). The analysis of household surveys. Microeconomic analysis for
development policy. Washington D.C.: The World Bank.
Dincer, C. and Gunalp, (2005). "Corruption, Income Inequality, and Growth: Evidence from U.S. States"
Duclos, JY, Esteban, J. and Ray, D (2003). Polarization: Concepts, Measurements, Estimation, CIPRÉE, Canada.
Engerman, S. L. and K. L. Sokoloff (2002), "Factor endowments, inequality, and paths of development among New World economies," NBER WP 9259.
Engerman, S. L. and K. L. Sokoloff (2005) “Colonialism, Inequality, and Long-Run Paths of Development” NBER Working Paper No. W11057
Engerman, S., and K. Sokoloff (1997), “Factor endowments, institutions, and differential paths of growth among New World economies: A view from economic historians of the United States,” In: Haber, S., Economic Growth and Latin American Economic Historiography. (MIT Press, Cambridge, MA)
Ganuza, E., Paes de Barros, R., Taylor, L. and Vos, R. (2001). Liberalización, desigualdad y pobreza: América Latina y el Caribe en los 90. Eudeba, PNUD, CEPAL.
Gasparini, L., Horenstein, M. and Olivieri, S. (2005). Economic polarisation in Latin America and the Caribbean. Mimeo, CEDLAS-UNDP.
Glaeser (2005), “Inequality” Oxford Handbook of Political Economy.
Gupta, Sanjeev, Davoodi, and Alonso-Terme (2002). “Does Corruption Affect Income inequality and Poverty?” Economics of Governance 3: 23-45.
Gwartney, James and Robert Lawson (2005). Economic Freedom of the World: 2005 Annual Report. Vancouver: The Fraser Institute.
Henisz, W. J. (2002). "The Institutional Environment for Infrastructure Investment." Industrial and Corporate Change 11(2): Forthcoming.
IADB (1998). América Latina frente a la desigualdad. Banco Interamericano de
Desarrollo, Washington, D.C.
Jensen, Jane (1998) Mapping Social Cohesion: The State of Canadian Research.
Canadian Policy Research Network 1998-11-27.
Kaufmann, Daniel Aart Kraay and Pablo Zoido-Lobaton (1999a). "Aggregating Governance Indicators". World Bank Policy Research Department Working Paper No. 2195.
Kaufmann, Daniel, Aart Kraay and Pablo Zoido-Lobaton (1999a). "Governance Matters". World Bank Policy Research Department Working Paper No. 2196. Kaufmann, Daniel, Aart Kraay and Massimo Mastruzzi (2003). "Governance Matters
III: Governance Indicators for 1996-2002". WBER, Volume 12, N.12
Kaufmann, Daniel Aart Kraay and Massimo Mastruzzi (2005). "Governance Matters IV: Governance Indicators for 1996-2004". Draft, May 2005
Keefer and Knack (2002) “Polarization, Politics and Property Rights: Links between Inequality and Growth” Public Choice.
Krueger, Anne O. 1974. "The Political Economy of the Rent-Seeking Society." American
Economic Review 64:291-303.
Lambert, P. (2001). The distribution and redistribution of income. Manchester
University Press.
Li, Hongyi, Lixin Colin Xu, and Heng-Fu Zou (2000). “Corruption, Income Distribution, and Growth.” Economics and Politics 12: 155-82.
Morley, S. (2000). La distribución del ingreso en América latina y el Caribe. Fondo de
Cultura Económica.
North, Douglass C. 1990. Institutions, Institutional Change and Economic Performance Cambridge University Press.
Polity IV Project :Integrated Network for Societal Conflict Research (INSCR) Program Center for International Development and Conflict Management (CIDCM) University of Maryland, College Park 20742 www.cidcm.umd.edu/inscr/polity © 2002
Przeworski (2005) “Is the Science of Comparative Politics Possible?” Oxford Handbook of Comparative Politics. (2005).
Sachs, J.D., 1990. Social conflict and populist policies in Latin America. In: Brunetta, R., Dell’Aringa, C. (Eds.), Labor Relations and Economic Performance. NYU Press, New York.
Samuels, D., Snyder, R., 2001. The value of a vote: malapportionment in comparative perspective. British Journal of Political Science 31 (4), 651–671.
Seddon, Gaviria, Panizza and Stein (2002) “Particularism around the World” Inter-American Development Bank (IADB)
United Nations Development Programme (UNDP) (2004)Democracy in Latin America: Towards a Citizens’ Democracy.
Annex
Indicators of institutions, conflict and corruption
18CCI: Control of Corruption Index. The index is a measure of perceptions of corruption,
defined as the exercise of public power for private gain. It is measured in units ranging from about -2.5 to 2.5, with higher values corresponding to less corruption. Source: Kaufmann, Kraay and Mastruzzi (2005) and Kaufmann, Kraay and Zoido-Lobaton (1999).
DI: Democracy Index. The index is a measure of the degree of institutionalized
democracy as opposed to institutionalize autocracy based on conceived democracy as three essential, interdependent elements. One is the presence of institutions and procedures through which citizens can express effective preferences about alternative policies and leaders. The second is the existence of institutionalized constraints on the exercise of power by the executive. The third is the guarantee of civil liberties to all citizens in their daily lives and in acts of political participation. The index is measured in units ranging from -10 to 10, with higher values corresponding to a system with a more consolidate democracy. Source: Polity IV Project.
DNW: Days Not Work index. This index measures the number of days not worked as a
result of strikes and lockouts. This is usually measured in terms of the sum of the actual working days during which work would normally have been carried out by each worker involved had there been no stoppage. Source: ILO (International Labour Organization) Yearbook of Labour Statistics (2005).
ECI: Executive Constraints Index. The index is a measure of the extent of
institutionalized constraints on the decision-making powers of chief executives, whether individuals or collectives. Source: Polity IV Project.
ECIWB: Executive Constraints Index. This index refers to the extent of
institutionalized constraints on the decision-making powers of chief executives. Source: World Bank (Database of Political Institutions) (2002).
EDI: Electoral Democracy Index. This index is an aggregation of four indicators: right
to vote, clean elections, free election and elected public officials. Source: Democracy in Latin America: Towards a Citizens’ Democracy. United Nations Development Programme (UNDP) (2004).
EF: Ethnic Fractionalization’s index. This index measure how fractionalize is a given
country in terms of its different ethnic groups. Source: Alesina, Devleeschauwer, Easterly and Kurlat (2003).
FREEDOM: Complains Presented Before the Union Freedom Committee. This index
measures the number of complains presented before the union freedom committee. This is a cumulative index, which means that if, for example, in Bolivia the first complain in the decade occurs in 1990 and then another in 1991, the index for 1990 will be one and for 1991 will be two, reflecting both complains. Source: ILO (International Labour Organization) Yearbook of Labour Statistics. (2005).
FTI: Freedom to Trade Internationally index. This index is a measure of the possibility
to engage in international trade in a country. It consists in an aggregation of indexes which try to capture the taxes on international trade, regulatory trade barriers, differences between official exchange rate and black market rate, international capital market controls, etc. Source: Gwartney and Lawson (2005).
GDP: Gross Domestic Product Per Capita (PPP). Source: Internationally Monetary
Fund (IMF).
GEI: Government Effectiveness Index. The index is a measure of the quality of public
service provision, the quality of the bureaucracy, the competence of civil servants, the independence of the civil service from political pressures, and the credibility of the government’s commitment to policies. It is measured in units ranging from -2.5 to 2.5, with higher values corresponding to a more effective government. Source: Kaufmann, Kraay and Mastruzzi (2005) and Kaufmann, Kraay and Zoido-Lobaton (1999).
IED: Index of Electoral Disproportionality. This index is a measure of the deviation of
party’s seat shares from their vote shares. The measure of disproportionality, for the lower house or single chamber of parliament, is the least-squares index (LSq), which is calculated by squaring the vote-seat share difference for each party, adding all these figures, dividing the total by two, and finally taking the square root of the resulting value. Lower numbers can be interpreted as a sign that parties receive a number of seats that is closely proportional to their number of votes, while higher numbers indicate that the relationship between parties' votes and seats is more disproportional. Source: United Nations Development Programme (UNDP) (2004). Democracy in Latin America: Towards a Citizens’ Democracy.
IENP: Index of Effective Number of Parties (based on percentage of votes). The
IER: Index of Economic Reforms. The index of economic reforms consists of five
components: trade reform, tax reform, financial liberalization of privatization, and liberalization of external capital transaction. This index tries to capture the complex wave of economics reform that went on in Latin America & Caribbean during the past decade. The scale goes from 0.000 to 1.000, the higher the score indicating a greater degree of market orientation in the economic reforms. Sources: Morley, Machado and Pettinato (1999), Lora (2001) and CEPAL (2003).
LCM: Lower-Chamber Malapportionment. This index measures the degree in which
one vote is equally weight across a given country. It tries to capture the idea that one of the cornerstones of democracy involves that every vote should count exactly the same independent of who is casting the vote. The index, which is computed using Snyder and Samuels' formula, reflects how far are the countries from the “ideal” democracy where the rule “every vote should we weighted equally” is respected. Source: Snyder and Samuels (2001).
LF: Language Fractionalization’s index. This index measure how fractionalize is a
given country in terms of language. Source: Alesina, Devleeschauwer, Easterly and Kurlat (2003).
LS: Labour Standards index. The index is a composed measure of the worker’s freedom
to organize themselves, negotiate collectively and to be declared in strike. This index covers a variety of rights violated, but does not measure the frequency of its violation neither the quantity of workers affected by such violations. The index is measured in units ranging from 0 to 76.5, with higher values corresponding to less respect for the worker’s rights. Source: Mosley and Uno (2002).
LSI: Legal Structure and security of property rights index. This index is a measure of
the functioning’s of the legal system in a country. Consist in an aggregation of indexes which try to capture the degree of judicial independence, the court’s impartibility, the military interference in rule of law and in the political process, etc. It is measured in units ranging from 0 to 10, with higher values corresponding to a system with a better working of the legal system. Source: Gwartney and Lawson (2005).
PCI: Political Constraints Index. This index estimates the feasibility of policy change
(the extent to which a change in the preferences of any one actor may lead to a change in government policy). The index is measured in units ranging from 0 to 1, with higher values corresponding to a system where policy changes are more feasible. Source: Henisz, W. J. (2006).
PEE: Public Expenditures in Education. Expenditures in education as a percentage of
the gross domestic product. Source: CEPAL. (2002)
PEH: Public Expenditures in Health. Expenditures in health as a percentage of the gross