Environmental variability and its relationship to site index
in Mediterranean maritine pine
A. Bravo-Oviedo
1,2*, S. Roig
1,3, F. Bravo
1,4, G. Montero
1,2and M. del-Rio
1,2 1 Sustainable Forest Management Research Institute. www.research4forestry.org2 Departamento de Selvicultura y Gestión de Sistemas Forestales. CIFOR-INIA. Ctra. A Coruña, km 7,5. 28040 Madrid. Spain
3 Departamento de Silvopascicultura. ETS Ingenieros de Montes. Universidad Politécnica. Ciudad Universitaria, s/n. 28040 Madrid. Spain
4 Sustainable Forest Management Group. University of Valladolid. Avda. Madrid, 44. 34004 Palencia. Spain
Abstract
Environmental variability and site productivity relationships, estimated by means of soil-site equations, are considered a milestone in decision making of forest management. The adequacy of silvicultural systems is related to tree response to environmental conditions. The objectives of this paper are to study climatic and edaphic variability in Mediterranean Maritime pine (Pinus pinaster) forests in Spain, and the practical use of such variability in determining forest productivity by means of site index estimation. Principal component analysis was used to describe environmental conditions and patterns. Site index predictive models were fitted using partial least squares and parsimoniously by ordinary least square. Climatic variables along with parent material defined an ecological regionalization from warm and humid to cold and dry sites. Results showed that temperature and precipitation in autumn and winter, along with longitudinal gradient define extreme site qualities. The best qualities are located in warm and humid sites whereas the poorest ones are found in cold and dry regions. Site index values are poorly explained by soil properties. However, clay content in the f irst mineral horizon improved the soil-site model considerably. Climate is the main driver of productivity of Mediterranean Maritime pine in a broad scale. Site index differences within a homogenous climatic region are associated to soil properties.
Key words: Mediterranean region; Pinus pinaster;site index; soil-site.
Resumen
Variabilidad ambiental de las masas de pino negral y su relación con el índice de sitio
La relación entre variabilidad ambiental y la productividad de estación, estimada mediante el índice de sitio, es clave en la toma de decisiones en la gestión forestal sostenible, ya que su conocimiento permite adecuar la prácti-ca selvícola a la respuesta de la masa a dicha variabilidad ambiental. Los objetivos de este trabajo son estudiar la variabilidad climática y edáf ica de Pinus pinasteren su distribución mediterránea en España y el uso práctico de dicha variabilidad en la determinación de la productividad de la estación mediante la estimación del índice de si-tio. Para la descripción de la variabilidad ambiental se realizó un análisis de componentes principales y para la pre-dicción del índice de sitio se optó por una regresión por mínimos cuadrados parciales, y de forma más parsimo-niosa, mediante mínimos cuadrados ordinarios. Las variables climáticas, junto al material parental def inieron regiones que comprendían estaciones que van de cálidas y húmedas hasta frías y secas. Los resultados mostraron cómo la temperatura media anual, la precipitación en otoño e invierno, junto con un gradiente longitudinal def ine calidades de estación extremas. Las mejores calidades se encuentran en estaciones cálidas y húmedas mientras que las peores están en estaciones frías y secas. Las variables edáf icas explican poca variación del índice de sitio, aun-que la inclusión del contenido en arcilla mejora notablemente el modelo. El clima es el precursor de la calidad de estación mientras que diferencias en el índice de sitio en zonas climáticamente homogéneas se asocian a variables edáf icas.
Palabras clave: índice de sitio; material parental; Pinus pinaster;región mediterránea.
Introduction
Mediterranean environmental conditions, such as water stress, limit forest growth. However, there is a high environmental variability in the Mediterranean region and mesic forest ecosystems such as those found in Central Europe can also exist (Scarascia-Mugnozza
et al., 2000). The great variability in climate, soil and physiographic conditions leads to a great variability of tree species, growth response and productivity, as
it is the case of Maritime pine (Pinus pinaster Ait.). In
this species the environmental variability has derived into two groups in the Iberian Peninsula with great differences in growth performance; the Atlantic Mari-time pine (AMP), which is more productive and found mainly in areas with an Atlantic climate, and the Medi-terranean Maritime pine (MMP), which grows under pure and mesic Mediterranean climate conditions with an irregular precipitation regime and diverse soil origin which, along with stand isolation, has lead to geogra-phic differentiation of tree attributes such as tree height,
stem straightness or productivity (Alía et al., 1997;
Río et al., 2004; Bravo-Oviedo et al., 2007).
Stand forest dynamics is related to site properties and the application of silvicultural systems must be based on the knowledge of current environmental conditions. These properties are often considered to be the foundations of silviculture (Toumey and Korstain, 1947). Autoecology, or the study of environ-mental factors and their effects on plants (SAF, 2008), has a long tradition in forestry studies in Spain. The f irst study on applied autoecology in Spain was
conducted for Pinus pinaster within an important
research program started in the early sixties. These studies f irst aimed to establish the autoecology of
species of genus Pinus, as they were systematically
used in restoration programs. Regarding
Medi-terranean Pinus pinaster(MMP) this study was carried
out according to six natural regions (Nicolás and Gandullo, 1967) and the authors f inally presented 5 ecotypes according to physical-soil properties. Re-cently, several works have increased the knowledge on tree-environment relation on forestry application for
other species (Díaz-Maroto et al., 2007;
Sánchez-Palomares et al., 2007, 2008; Alonso et al.,2010).
Sustainable Forest Management must consider the environmental variability as an important factor in forest stand dynamics. The study of cause-effect rela-tionships is essential in furthering scientific knowledge and understanding of biological processes. However,
standard management requires simple tools to aid deci-sion-making. One example of these are models which include indirect measures, like those used for evalua-ting forest quality and yield through site index (Curt
et al., 2001).
Forest site quality studies have the aim of describing, classifying and predicting the potential of a site to sustain biomass productivity. Forest site evaluation in even-aged forests is usually expressed as a function of intrinsic stand properties, such as tree height and age
(Hägglund, 1981),i.e.site index. Forest site index,
des-cribed as the dominant height attained at a reference age, is an indirect and partial measure of site quality. It is devoted to the tree bole production of aboveground biomass and it is related to mean annual volume incre-ment, which is a basic unit of forest management. Con-sequently, a careful selection of appropriate dominant trees must be made. In some cases such trees are rare
or even absent,e.g.marginal agricultural lands subjected
to forestation, high graded or very sparse stands, etc. Where this situation exists, forest productivity can be
assessed in one of two ways (Curt et al., 2001): the first
is known as the synoptic approach and correlates site index to site attribute classes, such as regional classifi-cation according to a composite of ecological features
(Wang and Klinka, 1996; Curt et al., 2001; Romanyà
and Vallejo, 2004). The second method is analytical and consists of measuring site variables and relating
site index to them (Chen et al., 2002; Klinka and Chen,
2003). The latter method is known as a soil-site study and has been widely used in forest productivity studies
(Carmean, 1975; Monserud et al., 1990; Hollingsworth
et al., 1996; Dunbar et al., 2002; Fontes et al., 2003; Nigh, 2006).
In the course of a study on dominant height growth
for MMP (Bravo-Oviedo et al., 2007), some regional
and local differences in growth performance were detected using base-age invariant (BAI) equations,
along with ecological regions defined by Costa et al.
(2005). BAI is considered to be superior to base age specif ic equations, like previous existing curves for the species (Pita, 1968), in terms of site index model applicability and statistical validity (Krumland and Eng, 2004). The use of BAI species-specific equations
may indicate relationships among site conditions,i.e.
climate and soil, and forest growth. Thus, a revision of soil-site relationships is needed for the species in order to estimate forest productivity.
and its relationship to site index in the distribution area of Mediterranean maritime pine in Spain. The specific objectives were to a) analyze the environmental varia-bility and define homogeneous environmental regions, b) analyze the relationship between environmental variability and productivity values, estimated by means of site index, c) to develop a model for site index pre-diction from environmental variables. We hypothesized that climatic and edaphic variability explains differen-ces in site productivity.
Material and methods
Stand selection and Site Index
This study deals with most of the distribution of Mediterranean Maritime pine in Spain, which accounts for around 724,000 ha in Spain (DGCN, 1998). Within the institutional framework of the Sustainable Forest Management Research Institute (SFMRI; www. research4forestry.org), 191 plots were selected in the study area (Fig. 1). Ninety three of them belong to the CIFOR-INIA network of experimental plots installed
in 1964 to study the growth and yield of Pinus pinaster,
in which measurements have been taken periodically until 2004. In addition, 20 complementary plots were established in 2004 for stem analysis in order to
com-plete the data from the first source. Finally, 78 plots belonging to the network installed by the University
of Valladolid to study Pinus pinaster growth dynamics
in the Iberian Mountain Range were incorporated into our database. In each plot, dominant height was calcu-lated according to the mean value of the 100 thickest stems per hectare and the age was determined from cores of a sample (4 to 15) of dominant trees. Site index values were calculated according to the dominant
height model developed by Bravo-Oviedo et al.(2007)
using dominant height at the age of 70 years. We used a general model which is common to all regions, be-cause we intend to find environmental variables that drive forest productive irrespective to regions. Ave-rage site index is 14.8 m (standard deviation 4.3 m), maximum site index is 26.1 m and the minimum is 4.7 m.
Environmental attributes
Climatic and physiographic data
Climatic data for every plot were retrieved from the GENPT and COMPLET programs (Fernández-Cancio and Manrique, 2001; Manrique and Fernández-Cancio, 2005). Monthly climatic values for each plot were cal-culated according to regression models or mean values
from the ancillary nearest climatic stations. The program requirements are: longitude, latitude and altitude. The reference period 1961-1990 was used to calculate ave-rage climatic conditions for each plot. Physiographic data were obtained from a digital terrain model with a
pixel size of 25×25 m. Climate-related variables such
as drought length, intensity of drought, evapotranspi-ration, physiological drought, surplus, deficit, annual hydric index and surface drainage were also calculated (Table 1).
Soil data
Soil data were obtained in a subsample of 65 plots in the SFMRI database, according to elevation and soil parental material. A sample of every soil horizon was extracted for analysis in the laboratory. The soil attri-butes measured were: water-pH, conductivity, organic matter (oxidizable organic carbon via Walkley-Black’s method), total organic matter according to loss-on-ignition method, carbonates and active calcium (using
Table 1.Description of physiographic, climatic and climate-realted variables
Variables typea Units Mean Std. Dev. Min. Max. Physiographic
Longitude (XUTM) m (zone 30) 503,317 126,534 187,386.0 702,502.0
Latitude (YUTM) m (zone 30) 4,479,273 106,935 4,226,960.0 4,631,322.0
Elevation (ELV) m 1,021 224.8 377.0 1437.0
Slope (SLP) % 16.7 12.4 0 63.7
Aspect (ASP) º 70.9 111.9 0.0 356.8
Insolation1(INS) 1 0.2 0.4 1.3
Climatic
Annual rainfall (P) mm 576 81 420.0 792.0
Spring rainfall (SGP) mm 164.9 18.2 118.6 204.5
Summer rainfall (SMP) mm 79.7 17.7 50.8 121.1
Autumn rainfall (AUP) mm 175.5 36.3 121.0 297.5
Winter rainfall (WP) mm 156.5 47.6 82.7 307.1
Mean annual Temperature (T) °C 11.4 1.6 8.9 15.9
Lowest Monthly mean temperature (TMF) °C 3.3 1.4 0.6 7.2
Highest Monthly mean temperature (TMC) °C 21.4 1.8 18.0 26.1
Mean value of minima temperature in the coldest month (TMMF) °C –1.3 1.5 –4.6 2.2
Mean value of maxima temperature in the warmest month (TMMC) °C 29.7 1.8 26.5 35.4
Climate-related
Drought lenght2(DSQ) Months 2.6 0.7 1.6 4.5
Intensity of drought3(ISQ) 0.1 0.1 0.0 0.3
Annual Evapotanspiration (ET) mm 678.6 53.5 597.9 851.3
Winter ET mm 30.7 6.9 17.2 46.8
Spring ET mm 137.3 11.3 112.4 169.4
Summer ET mm 358.4 26.7 315.3 449.7
Autumn ET mm 153.2 12.8 135.3 187.2
Potential Evapotranspiration (PET) mm 444.7 33.3 358.7 538.0
Annual physiological drought4(APD) mm 234.0 72.1 78.3 426.3
Surplus5(SUP) mm 224.9 81.7 70.6 413.0
Deficit6(DEF) mm 326.9 62 225.7 500.6
Annual Hydric Index7(AHI) 4.3 11.2 –17.6 34.7
Drainage8(D) mm 131.9 93.1 0.0 380.1
aIn parenthesis acronym used in the analysis. 1According to Gandullo (1974). 2Number of months where precipitation curve is
under temperature curve in the Walter-Lieth climodiagram. 3Quotient between dry area (temperature curve is above precipitation
curve) and humid area (temperature curve is under precipitation curve) in the Walter-Lieth climodiagram. 4Sum of monthly
va-lues where evapotranspiration is higher than potential evapotranspiration. 5Sum of monthly values where precipitation is higher
Bernard’s calcimeter), phosphorus (according to Olsen’s Method), exchangeable calcium, magnesium, potasium and sodium (according to the ammonium acetate me-thod), Cation-Exchange Capacity (determined according to Bascomb’s procedure), and nitrogen (according to Kjeldahl’s method). Physical properties and variables for nutrient availability were averaged for the whole
pit. The topmost organic horizon A00was discarded in
the sampling because of little differentiation of needles that would not have any influence in past growth of the
stand, the rest of A horizons (A0, A1and A2), if
pre-sented, were bulked together to form the first horizon sample. Nutrient variables, bulk density calculated according to the method proposed by Honeysett and Ratkowsky (1989) and the depth and percentage of roots were also recorded. Table 2 presents a description of soil attributes.
Statistical analysis
Multivariate analysis was performed in three ways: descriptive, explanatory and predictive. The first one was used to describe the environmental variability and to identify the most influential variables and homo-geneous regions; the explanatory analysis was carried out to identify and select the environmental variables that better explain the site index variation. Finally, the predictive approach was done to develop a site index model depending on environmental variables.
Descriptive multivariate techniques identify the tendencies and latent variables influencing the relation-ship of the explanatory variables under analysis and they serve to identify observations that share the same region in a multivariate space. Factor analysis, according to the principal component extraction method (PCA), was used to identify likely environmental gradients. The analysis was performed firstly using climatic and physiographic variables (191 plots) and secondly adding soil data (65 plots). Those variables which were found to have a measure of sampling adequacy (Kaiser’s
MSA) below 0.5 were rejected (Hair et al., 1999) and the
analysis repeated until variables had an adequate Kaiser’s MSA (above 0.7). Principal components analysis will serve as a tool to delineate environmental classes or groups in order to define homogenous climatic regions that will be coded and treated as synoptic variables. Synoptic variables were introduced into a one-way ana-lysis of variance to test differences in site index through climatic classes. Normality and independence of
resi-duals within each group were also tested. Tukey-Kramer’s test for unequal sample size was applied to compare group means (SAS, 2004).
As a second method, we used partial least squares regression, PLS (Abdi, 2003) to find a model capable of explaining site index from a large set of potential variables. The PLS regression is a powerful analysis tool and one of the least restrictive options in multiva-riate analysis. This technique is appropmultiva-riate when the number of predictors is equal or higher than the num-ber of observations or when there exists high
correla-tion among predictors (Carrascal et al.,2009), which
is the most common case in ecological based studies. It can be used as an exploratory analysis tool to select suitable predictor variables and to identify outliers be-fore applying classical linear regression. It can be also used as a predictive analysis when predictors are many and collinear (Tobias, 1995). We applied the former case to analyse the relationship between site index and the matrix of environmental variables that loaded most heavily in the factor analysis for the sub-sampling containing soil and climate information.
Multiple regression analysis was used to obtain par-simonious predictive models. This technique applies on large databases and it is usually performed with stepwise regression as selection method. Stepwise se-lection method often depends on the pool of variables that are included in the first stage, to the extent that by dropping one variable in the first stage the result could be different. Besides, the use of a sequential variable selection method may not be biologically sound (Fontes
et al., 2003a) and there might exist a big uncertainty that the truly best model is not produced (Myers, 1990). Consequently, a direct selection of candidate variables was performed on the basis of the results found in the PLS analysis.
Visual inspection of Q-Q plots and formal statisti-cal tests were performed for normality assumption. Multicollinearity was assessed using the condition number index (Myers, 1990). Homogeneity of va-riance was evaluated according to visual inspection of ordinary and studentized residuals over predicted values.
is f itting to the remaining n-1data (Vanclay, 1994). Finally, model performance was evaluated according
to biological sense and statistical properties (Soares et
al., 1995). The statistical validity of the model was
eva-luated computing bias and precision values (Huang et
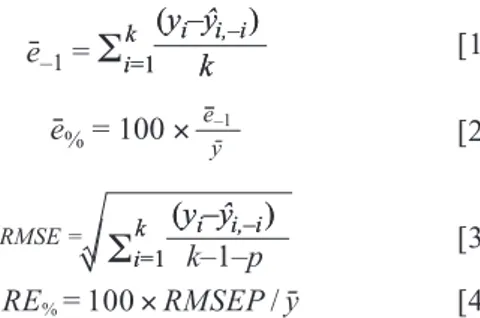
al., 2003). The selected prediction statistics for bias
was the mean residual without current observation [e¯–1,
eq. 1] and its percentage error [e¯%, eq. 2]. The mean
squared error of prediction without current observation [RMSEP, eq. 3] ant the relative error in prediction [RE%, eq. 4] was computed to evaluate the precision of the multiple linear model.
Table 2.Average soil attributes description
Variables type Units Mean Std. Dev. Min. Max.
Physical properties for the whole pit
Fine fraction (%F) % 60.3 26.7 16.9 100
Coarse fraction (%C) % 39.7 26.7 0 83.1
Sand % 65 21.2 20.5 93.3
Clay % 11.5 10.8 2 49.7
Silt % 23.5 14.2 1.6 61.9
CCC 0.2 0.4 0 2.5
CIL 0.1 0.1 0 0.5
Permeability 4 1.3 1 5
Chemical properties for the whole pit
Water Holding Capacity (WHC) mm 104.3 74.7 12.8 367.8
Equivalent humidity (EH) mm 16.7 7.6 7 35.4
pH 6.6 0.9 5.1 8.7
Organic matter (OM) % 1.3 1.3 0.1 8.5
Total organic matter (TOM) % 1.8 1.7 0.2 11.3
Calcium (Ca++) ppm 1,071.7 1,231.3 100.1 5,496
Sodium (Na+) ppm 22.5 16.3 2.4 64.2
Potasium (K+) ppm 84.7 99.1 15.9 498.9
Phosporus (P) ppm 0.8 2.7 0 14.6
Magnesium (Mg++) ppm 253.3 561.7 14.1 3,201.4
Nitrogen (N) % 0.1 0 0 0.3
Carbonates (CB) % 4.1 8.8 0 38.5
Active carbonates (ACB) % 0.4 1.1 0 6.3
Conductivity (CVY) mmhos cm–1 0.1 0.1 0 0.4
Cationic Exchange Capacity (CEC) meq 10 g–1 10.8 5.8 3.9 32
Base sum (S) meq 100 g–1 7.8 9.8 1 43.6
Saturation Rate (TSAT) % 57.6 38.8 6.9 186.3
Chemical and physical properties for the first horizon
Water Holding Capacity (WHC1h) mm 97.2 66.9 11.4 383
Organic matter (OM1h) % oxidable 1.9 2 0.1 10.5
Calcium (Ca1h) meq 100 g–1 5.6 7.1 0.5 27.6
Sodium (Na1h) meq 100 g–1 0.1 0.1 0 0.6
Potassium (K1h) meq 100 g–1 0.3 0.4 0 2
Magnesium (Mg1h) meq 100 g–1 2.3 5.1 0.1 26.4
Nitrogen (N1h) % 0.1 0.1 0 0.4
Carbonates (CB1h) meq 100 g–1 3.7 9.2 0 46.4
Cationic Exchange Capacity (CEC1h) meq 100 g–1 11.6 6.8 4.1 30.6
Saturation Rate (TSAT1h) % 56.9 42.3 6.8 198.4
Carbon-Nitrogen rate (CN1h) % 30.6 16 3.3 73.5
Bulk density (BD1h) g cm–3 1.4 0.4 0.6 2.3
Depth (D1h) cm 25.2 10.7 10 70
Roots (R1h) % 84.7 15.8 10 100
[1]
[2]
[3]
RE%= 100×RMSEP/y¯ [4]
where yiis the ithsite index observation, yˆi,–iprediction
without current ithobservation, k is the number of
observations and pis the number of parameters.
Results
Descriptive analysis
Principal components analysis
The variance explained by the two first climatic fac-tors in PCA is 82% (Table 3). Climatic factor analysis
showed that the temperature regime, drought length, elevation and evapotranspiration accounted for the maximum amount of variance in the first factor (58%). The second factor can be labelled as precipitation regime, as long as annual precipitation, seasonal rainfall in autumn and winter, water surplus and annual hydric index loaded most in this factor.
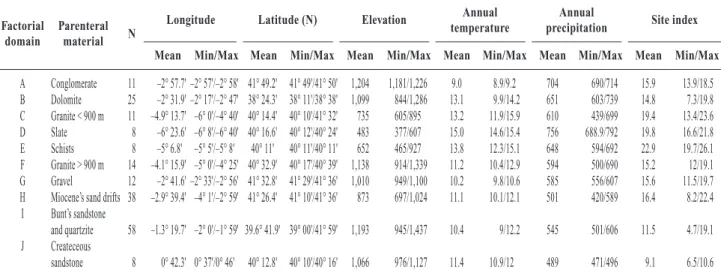
The inclusion of site index in the analysis as supple-mentary variable did not show any discernable pattern in the PCA. However, the incorporation of rock type and elevation in the climatic PCA, showed a pattern of aggregation. Figure 2 depicts regions with common rock type origin when axis 1 and 2 of climatic PCA are displayed, while Table 4 shows the main physiographic, climatic variables and parental material type, as well as site index values of each group. Those groups were incorporated into a one-way analysis of variance to de-tect statistical differences in mean site index. Groups were only entered into the analysis if at least 5 observa-tions were available.
The first region (A in Fig. 2) holds acidic conglome-rate rock under humid and cold conditions. The plots belonging to this region are included in Soria-Burgos Mountains and are located in the northern part of the study area.
Dolomite origin stands are located in two latitude bands and differ in temperature values. The warmest band (mean annual temperature of 13.1°C, Table 4) is located in Segura-Alcaraz area (Factorial region B). The second group is formed by three sampled stands located in the colder Iberian Mountains. This last group is underrepresented in our study and it was not used in the following analysis.
The acidic warm sites, which include slate and schist origin, are located next to each other in the western part of the study area (D and E group, respectively). Granite origin is separated into two open subgroups according to temperature and elevation. The stands below 900 m of altitude (group C) grow within the Tiétar river basin (the same area where stands on schist origin grow, group E) with mean annual temperature above 12°C and annual rainfall above 640 mm. The stands growing on granite over 900 m of altitude (group F) are located within the Tagus river basin and the mean temperature is under 12°C.
Soils developed on gravels (G group) and sand drifts origin (H group) are located in the same Castilian Plateau. However, gravels are found in the eastern part of the region, whereas sand drifts are spread within the whole region following an elevation gradient.
RMSE =
Σ
k i=1(yi–yˆi,–i)
k i=1
(yi–yˆi,–i)
k–1–p
e¯% = 100 × e¯–1
y¯
e–1 =
Σ
ki=1(yi–yˆi,–i)
¯ ki=1 k
(yi–yˆi,–i)
k
Table 3.PCA’s factor loadings for climate attributes
Variable Factor 1 Factor 2 Factor 3 Factor 4
YUTM –0.28 –0.20 0.87 0.27
ELV –0.87 –0.03 –0.40 –0.11
DSQ 0.86 0.19 0.07 –0.20
P 0.13 0.98 –0.13 –0.01
T 0.95 0.17 –0.22 –0.11
TMF 0.94 0.21 –0.19 –0.10
TMC 0.85 0.18 –0.41 –0.20
TMMF 0.90 0.23 –0.18 –0.12
TMMC 0.87 0.15 –0.29 –0.16
WP 0.47 0.85 –0.02 –0.08
AUP 0.35 0.87 –0.12 –0.09
Winter ET 0.91 0.21 –0.05 –0.07
Spring ET 0.97 0.04 0.09 –0.01
Summer ET 0.86 0.19 –0.38 –0.15
Autumn ET 0.89 0.30 –0.24 –0.08
ET 0.95 0.18 –0.20 –0.10
PET –0.19 –0.10 0.21 0.95
APD 0.79 0.18 –0.25 –0.51
SUP 0.22 0.96 –0.09 –0.10
AHI –0.29 0.95 –0.01 0.00
ISQ 0.84 –0.15 0.02 –0.26
Eigenvalue 11.72 4.78 1.69 1.52
% Variance 0.58 0.24 0.08 0.08
Cumulative %
variance explained 0.58 0.82 0.90 0.98
Stands located on Buntsandstein’s sandstone and quartizite bedrock are embedded in a broad factorial domain (Group I). Finally, the stands located in creta-ceous’ sandstone (J region) in the eastern part of the study area are characterized by cold temperature and low precipitation.
When climatic and edaphic variables are analysed together in the PCA, 91% of variance is explained by four axes (Table 5). The f irst factor is related to the temperature regime and elevation, the second to soil reaction, the third to nutrient status and the fourth to soil texture type, whereas precipitation is relegated to
Climatic PCA and parental material
–2.5 –2 –1.5 –1 –0.5 0 0.5 1 1.5 2 2.5
–2.5 –2 –1.5 –1 –0.5 0 0.5 1 1.5 2 2.5 3
Factor 2 (precipita
tion surroga
te)
Factor 1 (temperature surrogate)
×××
× ×
× × × ×
× ×× × ××× × × × ×× ×
× ×× × ×× × ×
××××× × ×
+ ++ + ++
+ +
D C
E B
F
J I
H G
A
Conglomerate × Dolomite Granite Slates Schists × Gravels
Sand drifts Bunt’s sandstone and quartzites + Createceous sandstone
Figure 2.Principal component analysis and groups defined using parental material information.
Table 4.Main climatic and physiographic features and site index values found in the regions defined in PCA
Factorial Parenteral Longitude Latitude (N) Elevation
Annual Annual
Site index domain material N
temperature precipitation
Mean Min/Max Mean Min/Max Mean Min/Max Mean Min/Max Mean Min/Max Mean Min/Max
A Conglomerate 11 –2° 57.7' –2° 57'/–2° 58' 41° 49.2' 41° 49'/41° 50' 1,204 1,181/1,226 9.0 8.9/9.2 704 690/714 15.9 13.9/18.5 B Dolomite 25 –2° 31.9' –2° 17'/–2° 47' 38° 24.3' 38° 11'/38° 38' 1,099 844/1,286 13.1 9.9/14.2 651 603/739 14.8 7.3/19.8 C Granite < 900 m 11 –4.9° 13.7' –6° 0'/–4° 40' 40° 14.4' 40° 10'/41° 32' 735 605/895 13.2 11.9/15.9 610 439/699 19.4 13.4/23.6 D Slate 8 –6° 23.6' –6° 8'/–6° 40' 40° 16.6' 40° 12'/40° 24' 483 377/607 15.0 14.6/15.4 756 688.9/792 19.8 16.6/21.8 E Schists 8 –5° 6.8' –5° 5'/–5° 8' 40° 11' 40° 11'/40° 11' 652 465/927 13.8 12.3/15.1 648 594/692 22.9 19.7/26.1 F Granite > 900 m 14 –4.1° 15.9' –5° 0'/–4° 25' 40° 32.9' 40° 17'/40° 39' 1,138 914/1,339 11.2 10.4/12.9 594 500/690 15.2 12/19.1 G Gravel 12 –2° 41.6' –2° 33'/–2° 56' 41° 32.8' 41° 29'/41° 36' 1,010 949/1,100 10.2 9.8/10.6 585 556/607 15.6 11.5/19.7 H Miocene’s sand drifts 38 –2.9° 39.4' –4° 1'/–2° 59' 41° 26.4' 41° 10'/41° 36' 873 697/1,024 11.1 10.1/12.1 501 420/589 16.4 8.2/22.4
I Bunt’s sandstone
and quartzite 58 –1.3° 19.7' –2° 0'/–1° 59' 39.6° 41.9' 39° 00'/41° 59' 1,193 945/1,437 10.4 9/12.2 545 501/606 11.5 4.7/19.1 J Createceous
the fifth axis. Again, when plotting factorial axis using site index as a supplementary variable no clear distinc-tion is detected in the pattern of dispersion. Dolomite
stands are clearly grouped together according to the second axis. Little information is gained with this ana-lysis comparing when only climatic variables are consi-Table 5.PCA’s factor loadings for climate and soil attributes
Variable Factor 1 Factor 2 Factor 3 Factor 4 Factor 5
Elevation –0.74 0.26 0.33 0.10 0.16
Annual rainfall 0.19 0.24 0.36 0.15 0.85
Summer rainfall –0.72 –0.31 0.13 –0.09 –0.32
Autumn rainfall 0.47 0.24 0.28 0.14 0.77
Winter rainfall 0.49 0.28 0.19 0.13 0.78
Mean annual temperature 0.96 0.14 0.10 0.10 0.12
Lowest monthly mean temperature 0.94 0.21 0.06 0.07 0.10
Highest monthly mean temperature 0.85 0.17 0.27 0.17 0.17
Mean value of minima temperature in the coldest month 0.86 0.35 0.04 0.04 0.16
Mean value of maxima temperatrue in the warmest month 0.90 0.08 0.16 0.16 0.18
Drought length 0.88 0.23 –0.12 0.07 0.20
Intensiy of drought 0.85 0.18 –0.22 0.03 –0.12
Annual evapotranspiration 0.96 0.10 0.10 0.10 0.14
Spring evapotranspiration 0.95 –0.02 –0.15 –0.01 –0.01
Summer evapotranspiration 0.86 0.09 0.24 0.15 0.22
Autumn evapotranspiration 0.88 0.22 0.09 0.18 0.22
Winter evapotranspiration 0.85 0.28 –0.02 0.00 0.01
Annual physiological drought 0.78 0.19 0.31 –0.14 0.18
Surplus 0.30 0.29 0.27 0.15 0.85
Fine fraction 0.17 –0.01 –0.61 –0.23 0.00
Sand –0.11 –0.13 –0.36 –0.85 –0.14
Clay 0.09 0.40 0.02 0.87 0.05
CCC 0.06 0.38 0.09 0.77 0.13
Permeability –0.07 –0.22 –0.09 –0.93 –0.05
Equivalent humidity 0.12 0.24 0.37 0.85 0.13
Organic matter 0.06 0.26 0.91 0.08 0.12
Total organic matter 0.04 0.32 0.90 0.09 0.11
pH 0.25 0.81 –0.04 0.01 0.10
Calcium 0.12 0.79 0.29 0.42 0.04
Potasium 0.21 0.74 0.25 0.34 0.20
Conductivity 0.21 0.80 0.25 0.23 0.20
Carbonates 0.22 0.70 0.01 0.34 0.21
Active carbonates 0.16 0.63 0.01 0.40 0.22
Nitrogen 0.16 0.41 0.76 0.27 0.13
Magnesium 0.21 0.78 0.11 0.04 0.09
Cationic exchange capacity 0.23 0.73 0.35 0.29 0.01
Saturation rate 0.11 0.79 0.24 0.34 0.01
Base sum 1sthorizon 0.13 0.83 0.41 0.25 0.15
Saturation rate 1sthorizon –0.02 0.67 0.39 0.36 0.15
Bulk density 1sthorizon 0.05 –0.14 –0.85 –0.08 –0.25
Organic matter 1sthorizon 0.03 0.16 0.91 –0.03 0.13
Calcium 1sthorizon 0.04 0.66 0.47 0.36 0.13
Magnesium 1sthorizon 0.20 0.78 0.21 0.03 0.11
Cationic exchange capacity 1sthorizon 0.25 0.67 0.53 0.14 0.10
Nitrogen 1sthorizon 0.13 0.30 0.82 0.04 0.15
Clay horizon B 0.07 0.33 –0.08 0.88 0.01
Eigenvalue 12.45 9.68 7.18 6.01 3.55
% Variance explained 0.32 0.25 0.18 0.15 0.09
dered. Thus, we put aside soil profile information in the formation of environmental groups to evaluate differen-ces among mean site index, but taking into account that this information will be useful for predicting purposes.
One-way analysis of variance
The overall analysis of variance of climatic regions led to the rejection of the null hypothesis of equal site index values among regions. Figure 3 shows the multi-ple mean comparison results of the analysis of variance using defined groups.
The higher site indices are found in humid and warm sites (C, D, E, located in the western area) with the ex-ception of stands growing on dolomites (B), which show statistically significant lower site indices (Fig. 3). Another group is formed by a broad set of stands that follows an altitudinal gradient (dashed line in Fig. 2). These can be considered of medium productivity on average. They include several parental materials such as conglomerate (A), dolomite (B), granite over 900 m of altitude (F), gravels (G) and sand drifts (H).
Finally, stands with the lowest productivity are lo-cated at the coldest sites in the Iberian Mountain Range on Bunt sandstone and quartzite (I) and cretaceous sandstone (J), in the east of the study area. According to these results, stands may be ordered from those with the highest productivity in the western part of the study area to the lowest productivity in the eastern part.
Explanatory analysis: Partial Least Squares
Regression
One of the aims of PLS is to identify the number of
components that account as much Yvariation as X
va-riation. Figure 4 shows the variance explained (y-axis) against the number of components (x-axis) for the response variables and for predictors. The point where both curves crosses indicate the number of components beyond which there is little information gained by in-creasing the number of selected components. The site index variation explained by the model is 56.2% using 41.5% of the original information from the predictors’ matrix. The first component is associated to elevation,
0.0 5.0 10.0 15.0 20.0 25.0 30.0
SI (m)
Cret.
sandstone (J) Bunt’
s sandstone and quartzites (I)
Granite (F)Dolomite (B) Gravels (G) Conglomera
te (A) Sand drifts (H)
Slate (D)
Granite (< 900 m) (C) Schists (E)
Figure 3.One-way analysis of variance of climatic groups according to parental material information, where black bars indicate warm and humid sites, grey bars are climate inter-mediate sites and white bars are cold and dry sites. The letter in brackets indicates the same code used in Figure 2.
0.00 0.10 0.20 0.30 0.40 0.50 0.60 0.70 0.80 0.90 1.00
0 2 4 6 8 10 12 14 16 18 20 22 24 26 28
Number of components
R
2
value
R2 of Y R2 of X
mean annual temperature, drought length and the sum of rainfall in winter and autumn (Fig. 5). Component 1 only uses 10.5% of information from predictors but it is able to predict 53.1% of site index variability. The second component can be associated to annual water availability (annual rainfall), soil water storage (sand and fine percentage, water holding capacity), and clay content. Nutrient status represented by carbon nitrogen ration and magnesium content in the first horizon have some influence in site index variation The gain of explanation of site index variability is very poor (3%) comparing the large percentage of predictor variability gained (31%).
Predictive analysis: multiple linear regression
A multiple linear regression was f itted to data in order to achieve a parsimonious model that helps in making decisions to classify stands according to site index classes, in the case of absence of dominant trees. In the course of the preceding PCA analysis, we have seen how site index values follow a positive longitu-dinal gradient from east to west. Longitude is highly correlated with elevation (correlation coefficient 0.76). Temperature and seasonal precipitation are another important factor in site index variation as indicated by PLS analysis. Soil properties account little for site index variation but, comparatively, they increased the predictor variability in the analysis. The variables that loaded most in the second component are related to soil water storage or impediment for root depth such as fine percentage, water holding capacity or clay con-tent. Consequently, we tested to fit linear models that
include some of the following variables: elevation, temperature, precipitation, fine percentage, clay con-tent in the B horizon and carbon nitrogen ratio.
The best fit was achieved using two equations. The first equation explained 55.2% of site index variation. Predictors were seasonal precipitation in winter and autumn, squared elevation and squared temperature. When soil clay content was included as predictor, tem-perature was not signif icant and this lead to its ex-clusion in a second equation that explained 56.6% of site index variation (Table 6). This exchange between clay and temperature as predictors deserved a deeper insight according to regions defined in PCA analysis. Results indicated that site index of stands growing in warm and wet conditions is better predicted using the linear model that includes clay content whereas predic-tions in the rest of regions are better achieved by the temperature-based model. The superiority of the tem-perature linear model is higher in the intermediate climate where the site index value is also intermediate (Table 6).
Discussion
This work confirms the great variability of soil and climatic conditions in the southwest Europe distribu-tion area of MMP and the reladistribu-tionship between this en-vironmental variability and site index. This is an ex-pected result as our data lay within the auto-ecological parameters defined by Gandullo and Sánchez-Palomares (1994). These authors also built a soil-site predictive model based on observations and discrete site quality classes according to a base age specific site index
mo-0 5 10 15 20 25 30
5
ELV P TDSQ
AUP+WP %FSand Clay Silt Permeability
WHC EH OM pHCa++ K
+
Mg
++
CEC Base Sum
C/N S1h
OM1hCa1hMg1hNa1h K1hCEC1hN1hWHC1h
Variable
% contribution of variables to PLS
components 1 and 2
Component 1 Component 2
del using mean height instead of dominant height. Unfortunately, the stand variables that they used in their study are not available and we cannot calculate
the site index value according to Bravo-Oviedo et al.
(2007) base age invariant model in order to contrast both results.
Climatic PCA defines homogenous regions in terms of temperature and precipitation. Within each of these climatic regions there exists variability in site index values leading to a not so clear relationship between site index value and climatic regions. However, there is a patent longitudinal gradient from the poorest site indices, which are located in the east on cold and dry sites, to the best site indices on warm and wetter clima-te in the west. The inclima-termediaclima-te stands are locaclima-ted in the central part of Spain and northwards, mean site index is around 15-16 m and although there are also cold sites, like those located on conglomerate rock type, the precipitation is higher than in the eastern stands. Other exception to the longitudinal gradient is the dolomite stands. They have a warm and humid cli-mate like the group with the best site index values; however they have a lower site index than expected according to climate.
Precipitation and temperature seem to be the most important environmental factors explaining extreme site index qualities. However, the variability in some
of them indicates that site index variability is therefore partly due to other environmental characteristics. Dolo-mite rock increases magnesium content that can block the adsorption of other cations leading to nutrient defi-ciencies. In addition, precipitation is relegated to the fifth axis when climatic and edaphic variables are ana-lyzed jointly in PCA, explaining only 4% of variation (results not shown). The second component is then de-voted to chemical properties, such as pH, that differen-tiates dolomite stands.
The components of principal component analysis do not show any discernable relationship with site index values. This is due to the fact that PCA searches for latent variables or factors which explain the variability of independent variables (X) and, as a result, the use
of these factors in an ordinary regression analysis (i.e.
Y =f(F1,F2…), where Fiis a linear combination of X
variables) often leads to poor results. As a generaliza-tion of PCA, the partial least square regression is capable of finding factors to explain X variables that are also important for Y variables (Abdi, 2003). As a drawback, the PLS model still needs many independent variables.
Studies undertaken in temperate and boreal areas indicate that high temperature is related to high site
index values (Fries et al., 2000). However, in warmer
areas, such as the Mediterranean basin, this effect is Table 6.Multivariate linear regression analysis and evaluation by PCA regions
Fitting phase
Model Adj-R2 RMSE Bias SIT= 17.6-0.0000079ELV2 + 0.0353PR-0.0435T2 0.552 2.88 –0.0016n.s. SIClay= 12.5-0.0000057ELV2+ 0.0285PR-0.0945Clay 0.567 2.83 –0.0081n.s.
Evaluation phase
Regions Model
Bias Accuracy
MPRESS %MPRESS RMSEp RMSEp%
V1 SIT 0.87 n.s. 4.55 3.26 17.12
SIClay 0.20 n.s. 1.05 3.10 16.24
V2 SIT 0.03 n.s. 0.20 3.25 19.89
SIClay 0.84 n.s. 5.15 3.18 19.46
V3 SIT –0.37 n.s. –2.48 3.80 25.52
SIClay –0.54 n.s. –3.60 3.29 22.13
V4 SIT –0.13 n.s. –1.23 3.33 30.32
SIClay –0.33 n.s. –2.97 3.46 31.51
positive if precipitation is also high. If this is not the case, the temperature would increase water deficit and site index values may be lower than expected. Seynave
et al. (2005) described a parabolic relationship between site index and elevation. This relationship is positive up to a maximum elevation after which it decreases. Our predictive model shows the decreasing part of this relationship whereas the positive, increasing part is reflected by other variables such as precipitation, since a positive relationship exists between elevation and rainfall. However, the stands located at low elevation sites are the most productive in the entire study area. This may be explained by the orientation of the moun-tains. Rain clouds come from the southwest and west component. They reach the western part of the central mountain range orthogonally and leave precipitation in this region firstly (Nicolás and Gandullo, 1967). This means that precipitation decreases from west to east, so does site index.
Chen et al. (2002) found that climatic variables and
local soil conditions are good predictors for large geo-graphic areas, whereas soil and foliar nutrient concen-trations lead to excellent predictive site index models
in smaller areas (Sánchez-Rodríguez et al., 2002). We
can only corroborate this fact if we divide the study area in four groups, for example, in the western part
of the study area (V1, see Table 6) where the
tempera-ture model showed higher bias than the clay content
model. Contrary, in V3region temperature plays a
major role in site index estimation even if clay content
is higher in these stands than in the V1region. In cold and
dry regions (V2and V4) temperature is a main driver
of site index estimation because of the lack of precipi-tation which indicates that a rising in temperature lead to a decreasing trend in productivity being more intense in sandy soils. This may be explained by a high soil tem-perature when air temtem-perature is also high in this area. We are aware that soil-site studies are designed to evaluate potential productivity in terms of site index when proper trees are not available. The predictive models presented here are unbiased and their precision is high enough to be considered for management pur-poses until proper trees are available and site index assessment using base age invariant site index curves can be performed. If a forest manager needs to use one of the models proposed here we suggest that the tempe-rature-based model is the best option. However, when predicting site index in stands located in the western part of the species distribution a larger error is expec-ted. Consequently, the forest manager should consider
if the cost associated to soil profile analysis outper-forms the cost of committing a larger error when applying the temperature-based model.
The wide use of multiple linear regressions to estimate forest productivity, in spite of its lack of accuracy, is due to its simplicity and utility when no other informa-tion exists. Conceptually, the linear relainforma-tionship between dendrometric values and environmental features might be untenable because many of the relationships in natu-re anatu-re non-linear because of interactions, compen-sations or facilitation processes. Some empirical efforts have been done (Romanyà and Vallejo, 2004) to model nonlinear soil-site relationships, and other promising approach to overcome the linear limitation is the use
of neural networks (Lek et al., 1996), although the need
of large databases to train the net and the «black-box» assumption, which lay underneath, makes its use less general than expected.
The attempts to have multiple linear models to pre-dict site index values in broad areas are always poor comparing to another approaches, such those that use synoptic variables. The reasons for such low predicted
availability according to Monserud et al.(1990) are
the number of factors that can exceed the sample size, and the failure to measure the true causes of site pro-ductivity. Another likely cause is the nonlinearity of soil-site index relationship and the interactions that we were unable to detect by using a linear approximation.
In a parallel study published earlier (Bravo-Oviedo et
al. 2008) a nonlinear model parameterized according
to the generalized algebraic approach (GADA) showed how the inclusion of precipitation in winter and autumn, mean annual temperature, drought length and rock type (dolomite versus non dolomite) increase the predictive ability of this type of models. The model was plot-based and consequently the site index estimation was consi-dered local. Here, we present a region-based linear approximation to be used in case of lack of appropriate
dominant trees where Bravo-Oviedo et al. (2008) model
cannot be applied.
Conclusions
satisfactorily explained site index for the intended purpose. Partial least squares regression provides a useful tool for selecting environmental predictor varia-bles in soil-site models, avoiding the necessity to apply any variable selection method in stepwise multiple linear regressions.
Acknowledgement
The authors want to thank C. Ordóñez, A. I. Lucas, I. Lizarralde, R. Ruiz-Peinado, E. Garriga and R. Calama who helped in soil sampling. We are in debt to Dr. Fernández-Cancio for providing climatic data and two referees for their comments on a early manuscript. Otilio Sánchez-Palomares helped in soil analysis. A. Bravo-Oviedo is deeply grateful to Dr. Curt and Michel Vennetier (from CEMAGREF-Aix-en-Provence; France) for their assistance in using multivariate techniques during a first attempt to analyze part of the data used in this study. This study was financially supported by projects OT-03-002, AGL 2004-007094-C02-02 and AGL-2007-65795-C02-01.
References
ABDI H., 2003. Partial Least Squares (PLS) regression. In: Lewis-Beck M., Bryman A., Futing T., eds. Encyclopaedia of Social Sciences Research Methods, Sage, Thousand Oaks (CA).
ALÍA R., MORO J., DENIS J.B., 1997. Performance of Pinus pinasterprovenances in Spain: interpretation of the genotype by environment interaction, Can J For Res 27, 1548-1559.
ALONSO R., SÁNCHEZ-PALOMARES O., ROIG S., LÓPEZ E., GANDULLO J.M., 2010. Las estaciones ecológicas actuales y potenciales de los sabinares albares españoles. Ed Instituto Nacional de Investigación Agraria y Alimentaria. Ministerio de Ciencia e Innovación. Mono-grafías INIA: Serie Forestal 19, 188 pp.
BRAVO-OVIEDO A., RÍO M., MONTERO G., 2007. Geo-graphic variation and parameter assessment in generalized algebraic difference site index modelling. For Eco Manage 247, 107-119.
BRAVO-OVIEDO A., TOMÉ M., BRAVO F., MONTERO G., RÍO M., 2008. Dominant height growth equations including site attributes in the generalized algebraic diffe-rence approach. Can J For Res 38, 2345-2358.
CARMEAN W.H., 1975. Forest site quality evaluation in the United States. Adv Agron 27, 209-269.
CARRASCAL L.M., GALVÁN I., GORDO O., 2009. Partial least squares regression as an alternative to current re-gression methods used in ecology. Oikos 118, 681-690.
COSTA M., MORLA C., SAINZ H. (eds), 2005. Los bos-ques Ibéricos. Una interpretación geobotánica. Ed Plane-ta, Madrid.
CURT T., BOUCHAUD M., AGRECH G., 2001. Predicting site index of Douglas-Fir plantations from ecological variables in the Massif Central are of France. For Eco Ma-nage 149, 61-74.
CHEN H.Y.H., KRESTOV P.V., KLINKA K., 2002. Trem-bling aspen site index in relation to environmental measu-res of site quality at two spatial scales. Can J For Res 32, 112-119.
DGCN, 1998. El Segundo Invenatrio Forestal Nacional. España. MMA-DGCN, Madrid,
DÍAZ-MAROTO I.J., VILA-LAMEIRO P., GUCHU E., DÍAZ-MAROTO M.C., 2007. A comparison of the auto-ecology ofQuercus roburL. and Q. pyrenaicaWilld: pre-sent habitat in Galicia, NW Spain. Forestry 80, 223-229. DUNBAR A., DHUBHAIN A.N., BULFIN M., 2002. The pro-ductivity of Douglas fir in Ireland. Forestry 75, 537-545. FERNÁNDEZ-CANCIO A., MANRIQUE E., 2001. Progra-mas GENPET para la reconstrucción de una estación meteorológica con resolución mensual en cualquier punto del territorio español, conocidas sus coordenadas y altitud. Software Registration 106,649, Spain.
FONTES L., TOME M., THOMPSON F., YEOMANS A., LUIS J.S., SAVILL P., 2003. Modelling the Douglas-fir [Pseudotsuga menziesii(Mirb.) Franco] site index from site factors in Portugal. Forestry 76, 491-507.
FRIES A., LINDGREN D., YING C.C., RUOTSALAINEN S., LINDGREN K., ELFVING B., KARLMATS U., 2000. The effect of temperature on site index in western Canada and Scandinavia estimated form IUFRO Pinus contorta provenance experiments. Can J For Res 30, 921-929. GANDULLO J.M., 1974. Ensayo de evaluación cuantitativa de
la insolación en función de la orientación y de la pendiente del terreno. An INIA: Ser Recursos Naturales 1, 95-107. GANDULLO J.M., 1985. Ecología vegetal. Fundación
Con-de Con-del Valle Con-de Salazar, Madrid. 207 pp.
GANDULLO J.M., SÁNCHEZ-PALOMARES O., 1994. Estaciones ecológicas de los pinares españoles. ICONA-Ministerio de Agricultura, Pesca y Alimentación, Madrid. 188 pp.
HÄGGLUND B., 1981. Evaluation of forest site producti-vity. Forestry Abstracts 42, 515-527.
HAIR J.F., ANDERSON R.E., TATHAM R.L., BLACK W.C., 1999. Análisis multivariante. Prentice Hall Iberia, Madrid. 832 pp.
HOLLINGSWORTH I.D., BOARDMAN R., FITZPATRICK R.W., 1996. A soil-site evaluation index of productivity in intensively managed Pinus radiata(D Don) plantations in south Australia. Environmental Monitoring and Assessment 39, 531-541.
HUANG S., YANG Y., WANG Y., 2003. A Critical look at procedures for validating growth and yield models. In: Amaro R., ed. Modelling Forest Systems, CAB. KLINKA K., CHEN H.Y.H., 2003. Potential productivity of
KRUMLAND B., ENG H., 2005. Site index systems for ma-jor young-growth forest and woodland species in northern California. The Rources Agency Dpt Forestry & Fire Protection. p. 219.
LEK S., DELACOSTE M., BARAN P., DIMOPOULOS I., LAUGA J., AULAGNIER S., 1996. Application of neural networks to modelling nonlinear relationships in ecology. Eco Model 90, 39-52.
MANRIQUE E., FERNÁNDEZ-CANCIO A., 2005. Sistema informático para la generación de datos climáticos y fito-climáticos. In: For SEC, ed. IV Congreso Forestal Espa-ñol, Zaragoza, Spain. p. 7.
MONSERUD R.A., MOODY U., BREUER D.W., 1990. A soil-site study for inland douglas-fir. Can J For Res 20, 686-695.
MYERS R.H., 1990. Classical and modern regression with applications. Wadsworth Publishing Company, Pacif ic Grove, CA. 488 pp.
NICOLÁS A., GANDULLO J.M., 1967. Ecología de los pi-nares Españoles I. Pinus pinasterAit. Ministerio de Agri-cultura, Dirección General de Montes, Caza y Pesca Flu-vial, IFIE, Madrid. 311 pp.
NIGH G., 2006. Impact of climate, moisture regime, and nutrient regime on the productivity of douglas-f ir in coastal British Columbia, Canada. Climatic Change 76, 321-337.
PITA P.A., 1968. Clasificación provisional de las calidades de la estación en las masas de P. pinasterSol (continental) y P. uncinataRam. en la península Ibérica. Anales del IFIE, pp. 125-139.
RÍO M., BRAVO F., PANDO V., SANZ G., SIERRA DE GRADO R., 2004. Influence of individual tree and stand attributes in stem straightness in Pinus pinaster Ait. stands. Ann For Sci 61, 141-148.
ROMANYÀ J., VALLEJO V.R., 2004. Productivity of Pinus radiataplantations in Spain in response to climate and soil. For Eco Manage 195, 177-189.
SOCIETY OF AMERICAN FORESTERS (SAF), 2008. The dictionary of Forestry. Avalaible in www. dictionayofforestry.org [10 November, 2010].
SÁNCHEZ-RODRÍGUEZ F., RODRÍGUEZ-SOALLEIRO R., ESPAÑOL E., LÓPEZ C.A., MERINO A., 2002. Influence of edaphic factors and tree nutritive status on
the productivity of Pinus radiataD. Don plantations in northwestern Spain. For Eco Manage 171, 181-189. S Á N C H E Z - PA L O M A R E S O. , J OV E L L A R L . C . ,
SARMIENTO L.A., RUBIO A., GANDULLO J.M., 2007. Las estaciones ecológicas de los alcornocales españoles. Ed Instituto Nacional de Investigación Agraria y Alimen-taria. Ministerio de Educación y Ciencia. Monografías INIA: Serie Forestal 14, 232 pp.
SÁNCHEZ-PALOMARES O., ROIG S., RÍO M., RUBIO A., GANDULLO J.M., 2008. Las estaciones ecológicas actuales y potenciales de los rebollares españoles. Ed Ins-tituto Nacional de Investigación Agraria y Alimentaria. Ministerio de Ciencia e Innovación. Monografías INIA: Serie Forestal 17, 343 pp.
SAS I.I., 2004. SAS/STAT(R) 9.1 User’s guide, SAS Inst Inc, Cary, NC, X, 5121.
SCARASCIA-MUGNOZZA G., OSWALD H., PIUSSI P., RADOGLOU K.M., 2000. Forests of the Mediterranean region: gaps in knowledge and research needs. For Eco Manage 132, 97-109.
SEYNAVE I., GEGOUT J.C., HERVE J.C., DHOTE J.F., DRAPIER J., BRUNO E., DUME G., 2005. Picea abies site index prediction by environmental factors and under-storey vegetation: a two-scale approach based on survey databases. Can J For Res 35, 1669-1678.
SOARES P., TOMÉ M., SKOVSGAARD J.P., VANCLAY J.K., 1995. Evaluating a growth model for forest manage-ment using continuous forest inventory data. For Ecol Ma-nage 71, 251-265.
TOBIAS R., 1995. An introduction to partial least squares regression. Proceedings of the 20thAnnual SAS Users Group International Conference, Cary, NC, SAS INSTITUTE INC. TOUMEY J.W., KORSTIAN C.F., 1947. Foundations of sil-viculture upon an ecological basis. Ed John Wiley & Sons, NY. 468 pp.
THORNTHWAITE C.W., 1957. Instruction and tables for computing potential Evapotranspirataion and the Water Balances. Centerton, New Jersey.
VANCLAY, 1994. Modelling forest growth and yield. CAB Internatioal, Wallingford.