RESEARCH ARTICLE OPEN ACCESS
Factors affecting cone production in
Pinus pinaster
Ait.: lack of
growth-reproduction trade-offs but significant effects of climate and
tree and stand characteristics
Felipe Bravo1,2, Douglas A. Maguire3 and Santiago C. González-Martínez4
1Sustainable Forest Management Research Institute, Universidad de Valladolid - INIA, Spain. 2Universidad de Valladolid, Escuela Técnica Superior de Ingenierías Agrarias, Dept. Producción Vegetal y Recursos Forestales. Avda de Madrid 44, 34004 Palencia, Spain. 3 Oregon State University; College of Forestry; Dept. of Forest Engineering, Resources and Management. Corvallis, OR, USA. 4UMR1202 BioGeCo: Biodiversity, Genes &
Communities, Cestas, France.
Instituto Nacional de Investigación y Tecnología Agraria y Alimentaria O. A., M. P. (INIA)
Abstract
Aim of study: Our main goal is to determine the relationship between cone production and radial growth in Pinus pinaster Ait. under different climatic conditions across the Iberian Peninsula.
Area of study: Coca Intensive Sampling Plateau, Northern Plateau (Spain).
Material and methods: Cone counts were conducted on an intensive monitoring plot in Coca (North-Central Spain) during the years 2000, 2006 and 2007. A ZIP (zero-inflated Poisson) model was adjusted for simultaneously estimating the probability of obtaining crop cones and its amount. The Northern Atlantic Oscillation (NAO) index was used as explanatory variable, together with a wide variety of tree and local stand variables. Climate (as evaluated by NAO), local stand density (here estimated from the six nearest trees), tree size and vigor, competition and growth efficiency significantly influenced both occurrence and intensity of cone production.
Main results: ZIP models for predicting reproductive effort seems an adequate tool to predict reproductive responses to climatic fluctuations and the resulting future species distribution in the face of climate change, as well as to identify silviculture actions that would promote reproductive success in naturally-regenerated stands, list and discuss relevant results (including numeric values of experimental results).
Research highlights: Climate, stand density and tree conditions (size and vigor, competition and growth efficiency) influence significantly both cone occurrence and intensity of fruiting as shown by a ZIP model. As the climate variables included in the model (based on Northern Atlantic Oscillation, NAO) are general and easily obtained, the proposed model has practical applicability to predicting Pinus pinaster cone production in the Iberian Peninsula.
Additional keywords: ZIP model; NAO; Mediterranean; silviculture; dendrochronology.
Abbreviations used: AIC (Akaike’s Information Criterion); BA6 (basal area based on the 6 nearest trees); BAL (basal area in larger trees); CL (crown length); CP (crown projection area); CSA (crown surface area); DBH (diameter at breast height); dpi (dots per inche); LAI (leaf area index); NAO (Northern Atlantic Oscillation); NCAR (National Center for Atmospheric Research); NCEP (National Centers for Environmental Prediction); QIC (quasi-likelihood information criterion); SLP (normalized sea level pressures); Wi (Akaike weight); ZIP (Zero Inflated Poisson).
Authors´ contributions: Conceived and designed the study; ran and interpreted the analysis and wote the document: FB. Provided most of the data: SCGM. Discussed the methods and the results and reviewed the document: DM and SCGM.
Citation: Bravo, F.; Maguire, D. A.; González-Martínez, S. C. (2017). Factors affecting cone production in Pinus pinaster Ait.: lack of growth-reproduction trade-offs but significant effects of climate and tree and stand characteristics. Forest Systems, Volume 26, Issue 2, e07S. https://doi.org/10.5424/fs/2017262-11200
Supplementary material (Figs. S1 & S2, Table S1) accompanies the paper on FS’s website.
Received: 09 Feb 2017. Accepted: 02 Oct 2017.
Copyright © 2017 INIA. This is an open access article distributed under the terms of the Creative Commons Attribution (CC-by) Spain 3.0 License.
Funding: Spanish Government through its scientific mobility program to FB. Correspondence: should be addressed to F. Bravo: [email protected]
Introduction
Plant reproductive effort in any given year comes at a cost in terms of carbon allocation, resulting in tradeoffs
with other traits that affect reproductive fitness more
indirectly, such as growth and survival (Thomas, 2011).
Against a backdrop of rapid environmental change,
these tradeoffs can constrain and influence adaptive
defined as the proportion of total resources used in
reproductive structures (Bazzaz et al., 2000), have
shown size dependency (Sugiyama & Bazzaz, 1998). Moreover, tradeoffs between reproductive allocation and vegetative growth have been reported in plants with
contrasting life-histories (e.g. Sánchez-Humanes et al.,
2011). Climent et al. (2008) showed that intense cone
yield is not compatible with rapid vegetative growth in
Aleppo pine (Pinus halepensis Mill) while Barringer
et al. (2013) found similar results for Quercus species in California. Shifts in resource allocation that affect traits other than vegetative growth are also evident.
For example, Sampedro et al. (2011) reported a
significant negative genetic correlation between Pinus pinaster Ait. growth and defensive investment. These results support the existence of selective pressure to
sacrifice growth rate when resources are demanded for
ecophysiological functions more ‘urgently’ required to
optimize reproductive fitness, such as direct allocation
to reproductive structures or to defense chemicals that enhance the probability of survival. Defenses structures (i.e, resin) require a sufficiently large and permanent
resource allocation that tree growth is reduced more on poor sites than on high productivity sites (Ferrenberg
et al., 2015). P. pinaster genetic variability is therefore related to differential aboveground resource allocation
and resistance to pest attacks (Di Matteo & Voltas,
2016). In this regard, (Moreira et al., 2015) observed
wide intra-specific genetic variation in P. pinaster with regard to resource allocation to inducible defenses. According to partitioning theory trade-offs are expected between allocation sinks when resources are limited.
In forest trees, inverse correlations between size and cone production have been found for both conifers and
angiosperms at the tree level (see, for instance, Eis et al.,
1965; Selas et al., 2002; Monks & Kelly, 2006), but also
at the branch level within trees (Tappeiner, 1969; Fox &
Stevens, 1991; Hasegawa & Takeda, 2001). Moreover, a
carry-over effect has been documented for the reduction of tree growth after intense fruit production (Thomas, 2011). The observed negative tradeoff between reproductive versus vegetative structures in forest trees may have important implications. For example, phenotypic selection of trees based on growth and wood
quality (e.g. straight stems) in breeding programs may
result in reduced reproductive allocation, but current evolutionary models suggest that increased fertility would be essential for in situ population survival in the
face of climate change (Gomulkiewicz & Holt, 1995; Gomulkiewicz & Houle, 2009; Alberto et al., 2013).
Environmental fluctuations can mediate
growth-reproduction tradeoffs and complicate interpretation of causal mechanisms. Bell (1980) states that environmental factors with opposite effects on growth
and reproduction can produce spurious negative tradeoffs between these two responses. From a slightly
different perspective, Knops et al. (2007) concluded
that observed growth oscillations associated with seed production were due to direct effects of rainfall on each, and that once this effect was removed, no tradeoffs were evident between radial growth and reproduction. Thus, attempts to evaluate tradeoffs for resource allocation must necessarily account for climatic and other mediating factors, while recognizing that differential response to the same environmental cues may have evolved as an adaptive mechanism for optimizing
reproductive fitness under enviromental variability.
Extensively-managed natural stands and
intensively-managed forest plantations of P. pinaster are distributed
throughout the Mediterranean basin where they are adapted to regional edaphic and climatic factors. But in some cases seed sources have not been selected to match environmental conditions at the plantation site.
Outside its natural range, P. pinaster is considered
a potentially invasive species (Lowe et al., 2000).
P. pinaster initiates cone primordia toward the end of the third growing season before seed production and release from the cone; therefore, the sequence of weather conditions during the four years prior to cone maturation may be important for the occurrence of a cone crop and the relative number of cones produced
(Mutke et al., 2005; Philippe et al., 2006; Calama et
al., 2011).
Beyond data from meteorological stations, indices of atmospheric mass distribution can help to provide integrated predictors for broad scale climate in terrestrial ecosystems. The Northern Atlantic Oscillation (NAO) refers to the atmospheric mass distribution between the Arctic and the subtropical Atlantic and has a strong impact on the European climate, including that of the Iberian Peninsula (where low NAO leads to a
humid growing season; Martín-Vide &
Fernández-Belmonte, 2001), as well as that of the eastern coast of North America. NAO can be assessed through an index based on the pressure differences between a northern location (usually Iceland) and more southern locations (usually the Azores Islands or the Portuguese coast). This type of general climate index provides an integrated measure of seasonal weather and offers potentially better description of coarse-scale
regional climatic variability than finer-scale averages of specific local variables (Hurrell & Deser, 2009).
Stenseth et al. (2003) advocated the use of indices
impacts on organisms better that simple temperature or precipitation values and (5) are easily available (most of them from the internet) for long-time frames.
Changes in atmospheric mass distribution, as
reflected by NAO, can impact a variety of ecological
processes and functions, including phenology, growth
and reproduction (Menzel, 2003; Stenseth et al., 2003;
Wang & Schimel, 2003). Only a few studies have documented the general effects of NAO atmospheric distribution on forest trees. Tree ring growth in the Mediterranean forests is negatively related with NAO
in winter, as reported in Fagus sylvatica L. (Piovesan
& Schirone, 2000), P. pinaster (Bogino & Bravo,
2008), Quercus ilex L. (Campelo et al., 2009) and
Pinus halepensis Mill. (Pasho et al., 2011). In Northern
Europe, Lindholm et al. (2001) found that NAO in
winter was positively correlated with Pinus sylvestris
L. tree-ring growth. Interestingly, Piovesan & Adams
(2001) found a significant correlation between seed
production and the NAO index from the previous
year among a number of beech species worldwide (F.
sylvatica from Europe, Fagus grandifolia Ehrh. from
eastern North America and Fagus crenata Blume from
Japan). In addition, birch (Betula ssp) pollen production
was correlated with the NAO index, with stronger correlation among sites in the United Kingdom than in
Poland (Stach et al., 2008).
Despite the ecological significance of fitness
tradeoffs, the general consensus that global climate impacts these tradeoffs, and the wider availability of atmospheric mass distribution indices, to our knowledge no study has linked these three concepts. Establishing this link is especially important in the case of tradeoffs between reproduction and growth due to the high ecological and economic importance of these
biological processes. The high intraspecific variability
of cone production previously reported for P. pinaster
(Tapias et al., 2004; Juez et al., 2014), along with the
wide fluctuation in annual weather conditions that it
typically endures, highlight the potential of this species as a case study for elucidating tradeoffs in resource allocation that may have ecological and economic importance. Moreover, a strong correlation has been recently reported in this species between environmental variables and minimum tree size required for production
of female reproductive structure, probably reflecting
environment-dependent costs of cone production
(Santos-del-Blanco et al., 2012).
Our main objective was to determine the relationship
between cone production and vegetative growth in
Mediterranean P. pinaster in the context of concurrent
fluctuations in climatic conditions. Radial growth at
breast height served as the surrogate for vegetative growth in our analysis, and two facets of cone production
were considered, including simple occurrence of cones as a binary response and intensity of cone production as an actual count of cone numbers. To accomplish the
stated objective, several different general hypotheses
were tested:
1) Cone production (occurrence and intensity) is driven by tree size, local stand density (here estimated from the six nearest trees), inter-tree competition
and climate. Five alternative climatic mechanisms
were proposed: (a) cone production (occurrence and intensity) is affected by climate during the current and each of the three previous years; (b) cone production (occurrence and intensity) is affected by climate during only the third year before cones reach maturity; (c) cone production (occurrence and intensity) is affected by climate in the third year before cones reach maturity; in addition cone
occurrence is also influenced by climate in the second
year before cones reach maturity; (d) cones intensity,
also known as cone set, is influenced by climate in the
third year before observed cone count, along with the size, local stand density, and competition covariates,
but cone occurrence is influenced only by climate (no
size or stand structural variables) during the third year
before cone maturity; (e) cones intensity is influenced
by climate in the second year before observed cone count, along with the size, local stand density, and competition covariates, but cone occurrence is
influenced only by climate (no size or stand structural variables) in the third year before cone maturity.
2) After accounting for tree size, local stand density (six nearest trees), inter-tree competition, and climate effects on cone occurrence and cone intensity, the
marginal effects of crown attributes, tree radial growth
and growth efficiency can explain a significant part of
the residual variability in cone production.
Testing of the hypothesis above was done by
constructing zero-inflated Poisson (ZIP) regression
models and selecting the model with the strongest statistical evidence using standard Akaike’s Information Criterion (AIC) criteria. Then, the marginal effects of individual-tree crown attributes, tree radial growth, and growth efficiency on reproductive effort were assessed, to test the null hypothesis that reproductive-growth tradeoffs are lacking in this widespread Mediterranean conifer.
Material and methods
Study area
The data were collected from an experimental
plot situated in a natural maritime pine (P. pinaster)
in the Castilian Plateau, central Spain (latitude 41º16’N and longitude 4º29’W). Rotation age has been approximately 100 years under a shelterwood system adapted to resin production. In this system, the regeneration period varies from 20 to 25 years in length. Climate is dry Mediterranean, with an annual rainfall of 401 mm and mean annual temperature of 11.2 ºC.
Vegetation is dominated by Corynephoruscanescens
(L.) P. Beauv., Stipa spp., Retama sphaerocarpa (L.)
Boiss., Lavandula stoechas L., Thymus mastichina
L., and isolated trees of Pinus pinea L. A detailed
description of the site was given by Nanos et al. (2004).
Tree data
In 2000, a circular plot (radius=100 m) was installed in a mature stand within the study area where only dead trees had previously been removed during thinning operations. On all mature trees (380) the following data were collected: spatial position (polar coordinates, to nearest 0.1 m), ring count age, total height (to nearest 0.1 m), number of cones and diameter at breast height
(DBH) to nearest 0.1 cm. Coordinates were measured
with a total station. In 2006 and 2007, additional cone counts were conducted on the same trees. Number of cones was estimated on each tree by visual count (see
details in Miguel et al., 2002). For each tree, BAL,
i.e., the basal area in trees larger than the subject
tree (Wykoff, 1990), was computed as an index of competition from above and basal area of neighboring
trees (BA6) was calculated as an index of two-sided
competition. Both BAL and BA6 for each subject tree
were computed by considering only the six nearest trees. Crown dimensions of each tree were estimated with Lizarralde’s (2008) crown equations (see Fig. S1 [suppl] for details). Tree dimensions (stem and crown) were assumed to have experienced no change over the course of the study (from 2000 to 2007) because the stand studied is mature and well over its maximum growth period.
In 2011, 113 trees were selected by expert judgement
to cover the range in cone yield and were cored to obtain
radial increments. DBH for these 113 trees ranged from
25.3 cm to 62.7 cm while cone counts ranged from 0 to 78 (see more details in Table 1). Cores were polished and scanned at high resolution (2000 dpi) with an Epson Expression 1640 XL scanner with 0.01 mm accuracy.
Tree rings were measured using WinDendro© V 6.5C version (Regent Instruments). COFECHA program
6.06P version (Grissino-Mayer 2001, www.ltrr.arizona. edu) was used to assess data accuracy by calculating correlation indices between ring-width series and identifying errors such as missing or false rings. At the end of this process, a 15-year growth series (from
1996 to 2010) was obtained for each tree. Tree-ring width from the cone count years and the three years previous to each cone count were extracted from each growth series. Only 105 trees per year (104 in
year 2000) were used in the final analysis. Trees were classified into four social classes according to their
relative BAL: dominant (if BAL was in the bottom
quartile, i.e. lowest values), codominant (if BAL
was in the second to smallest quartile), intermediate (if BAL was in the third to smallest quartile) and
suppressed (if BAL was in the largest quartile, i.e.,
highest BALs). The cone count frequencies are presented in supplementary documentation (whole data set in Fig. S2 [suppl]). As a surrogate for growth
efficiency different alternatives were computed from
annual ring increment, including basal area growth
per unit crown projection area (CP), growth per unit
crown surface area (CSA), and growth per unit LAIs.
Climatic data
NAO data were obtained from the Climate Analysis Section, National Center for Atmospheric Research,
NCAR (
https://climatedataguide.ucar.edu/climate-
data/hurrell-north-atlantic-oscillation-nao-index-station-based). Monthly and Seasonal NAO indexes
are based on the difference of normalized sea level pressures (SLP) between Ponta Delgada, Azores and
Stykkisholmur/Reykjavik. As of April 2003, the Ponta
Delgada station stopped reporting, so to continue this time series NCAR staff substituted it by the nearest National Centers for Environmental Prediction/ National Center for Atmospheric Research, NCEP/ NCAR reanalysis grid point (see details at http:// www.esrl.noaa.gov/psd/data/gridded/data.ncep. reanalysis.html). The correlation between a monthly time-series constructed with the Ponta Delgada observational data and one constructed with NCEP/ NCAR reanalysis data was, according to NCAR information, 0.99 for the period from 1948 to 2003. NAO data from the cone count years (t=0) and the three previous years (t=1, t=2 and t=3) were extracted
from the full dataset. NAOwinter was computed as the
average of the consecutive December, January and February NAOs).
Statistical analysis
Determining correct variance-covariance structure
Because the data included three non-consecutive measurements from each tree, potential autocorrelation
different variance-covariance structures, typically used in ecological studies (Barnett et al., 2010), were tested in a model for cone occurrence (binomial regression) and in a model for cone intensity (Poisson regression): independent, exchangeable, unstructured and autoregressive of order one. The models with alternative variance-covariance structures were
fitted by SAS Proc GENMOD and compared by
the quasi-likelihood information criterion (QIC) proposed by Pan (2001). No evidence could be
found for significant autocorrelation in the pooled
data, so further data analysis was pursued assuming independence of observations.
Zero-inflated Poisson model (ZIP model)
A zero-inflated Poisson (ZIP) model (eq. 1) proposed by Lambert (1992) was fitted to test the five hypotheses
proposed in the Introduction. The ZIP model consisted of two parts: one to estimate the occurrence of cone production by using a logistic model and other to estimate the cone set or intensity of the reproduction event (number
of cones) by using a Poisson model. The ZIP model fitted
by SAS Proc COUNTREG had the following form:
where is the observed cone count, represents the
probability of observing no cones modeled via
a logit link function (eq. 2 below) and indicates
the probability mass function for a Poisson function
with expected mean μ (eq. 3) and variance equal to
μ (1 + αμ)2.
where xi are the covariates representing climate, tree
size, stand density, and inter-tree competition and βi
and γi are parameters estimated from the data. Expected
cone occurrence ( ) and expected cone intensity (μi)
are not assumed to be affected by the same covariates.
Candidate ZIP models
To test the first set of alternative hypotheses (see end
of Introduction) about response of cone occurrence and cone intensity to tree size, stand density, inter-tree
competition and climate, five corresponding models were developed (Table 2). The best among the five
candidate models was selected on the basis of AIC. To test the second general hypothesis about marginal effects of crown attributes, radial growth
and tree growth efficiency, another set of alternative
models was developed (Table S1 [suppl]). New (2) (3)
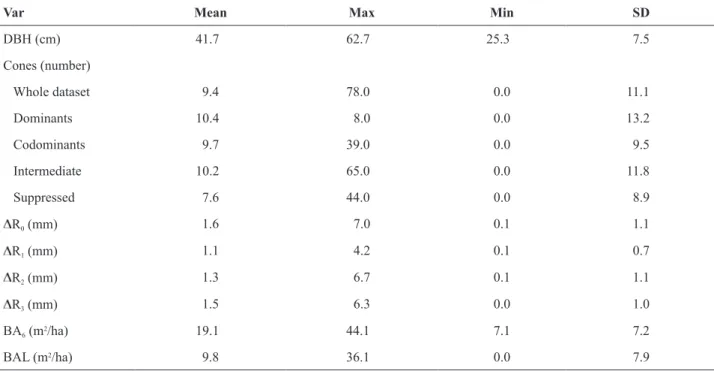
Var Mean Max Min SD
DBH (cm) 41.7 62.7 25.3 7.5
Cones (number)
Whole dataset 9.4 78.0 0.0 11.1
Dominants 10.4 8.0 0.0 13.2
Codominants 9.7 39.0 0.0 9.5
Intermediate 10.2 65.0 0.0 11.8
Suppressed 7.6 44.0 0.0 8.9
R0 (mm) 1.6 7.0 0.1 1.1
R1 (mm) 1.1 4.2 0.1 0.7
R2 (mm) 1.3 6.7 0.1 1.1
R3 (mm) 1.5 6.3 0.0 1.0
BA6 (m2/ha) 19.1 44.1 7.1 7.2
BAL (m2/ha) 9.8 36.1 0.0 7.9
(1)
Table 1. Summary of biometric data from 314 Pinus pinaster trees (104 trees for cone counts in year 2000 and 105 trees
for cone counts in years 2006 and 2007). DBH is diameter at breast height (1.3 m), Rt is annual radial increment for year
t (where t is number of years prior to cone counts), BA6 is basal area, and BAL is basal area in trees larger than subject
influence on occurrence of cones. In contrast, tree size,
inter-tree competition, and local stand density variables all contributed to explaining variation in cone intensity, along with winter NAO either during the year of cone primordia initiation (year t-3 in models 2, 3, and 4; Table 3) or during
year of flowering (year t-2 in model 5; Table 3).
In model 5, all variables were significant and AIC
achieved the lowest value (Table 3). Model 5 was therefore further considered as the base model for testing hypothesis 2 with regard to marginal effects of
crown attributes, growth efficiency, and radial growth
on cone count (ZIP full models, see below), starting with the following estimated forms for occurrence and intensity, respectively:
ZIP full models
Models with variables representing crown
dimensions, radial growth and growth efficiency
showed an improvement between 0.62 and 4.45 % in AIC reduction over the basic model (Table S1
[suppl]). The variables identified as best from each
group (crown dimensions, radial growth and growth
efficiency) were tested in different combinations to
identify a best model that potentially included one variable from each group (Table 4).
variables were included only in the intensity part of the model. Different variables were initially tested in the occurrence part of the model, but no improvements were achieved, suggesting that the occurrence model should include neither crown variables nor any radial
growth or growth efficiency effects.
The final step in the analysis was to identify the
best full model (i.e. the best model for explaining cone
occurrence and cone intensity as a function of tree size, stand density, inter-tree competition, and climate), with the intensity portion of the model augmented by the best variables representing crown, growth and growth
efficiency. The final model was selected on the basis
of percentage reduction in AIC over the basic model (best model from Table 1). Percentage reduction in AIC (PRAIC) was computed as:
Additionally, Akaike weight (Wi) was computed
following the procedure presented by Johnson &
Omland (2004). Wi provides a relative weight of
evidence for each model and can be interpreted as the probability of model i is the best model for the
observed data set. Equal values of Wi means that the
performance of the models is equal.
Results
ZIP basic model
Winter NAO three years prior to cone maturation was
the only variable tested that consistently had a significant
PRAIC = 100 × [1-(AICFull/AICBasic)] (4)
(5)
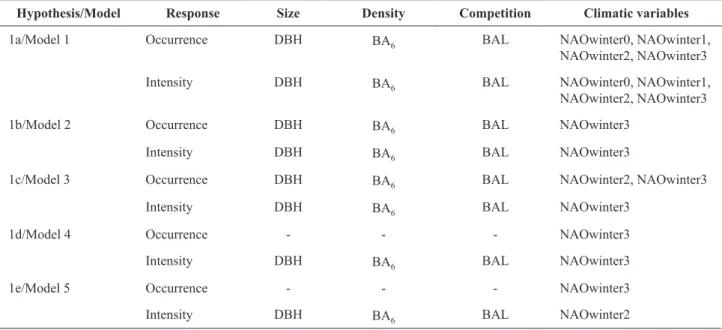
Table 2. Models for testing the effect of tree size, stand density, inter-tree competition, and climate on occurrence and
intensity of cones in Pinus pinaster.
Hypothesis/Model Response Size Density Competition Climatic variables
1a/Model 1 Occurrence DBH BA6 BAL NAOwinter0, NAOwinter1,
NAOwinter2, NAOwinter3
Intensity DBH BA6 BAL NAOwinter0, NAOwinter1,
NAOwinter2, NAOwinter3
1b/Model 2 Occurrence DBH BA6 BAL NAOwinter3
Intensity DBH BA6 BAL NAOwinter3
1c/Model 3 Occurrence DBH BA6 BAL NAOwinter2, NAOwinter3
Intensity DBH BA6 BAL NAOwinter3
1d/Model 4 Occurrence - - - NAOwinter3
Intensity DBH BA6 BAL NAOwinter3
1e/Model 5 Occurrence - - - NAOwinter3
Intensity DBH BA6 BAL NAOwinter2
Three of the combined models improved the performance of the basic model by including at least crown length (CL) as an additional explanatory variable in the basic model (Table 4). The best
combined model (Basic+ CL + EFI_LAIs_t in Table
4) included the two of the three variables that had the largest marginal effect on cone count when considered
as the only variable added to the base model, i.e., CL,
Growth0 and EFI_LAIs_0 (Table S1 [suppl]). AIC was
reduced over 4.7% by this full model (Table 4). We conclude that cone occurrence and intensity were
driven by climate (NAOwinter in the bud formation and
flowering year), tree size (DBH), tree competition
(BAL), tree density (BA6), and crown length (CL)
and growth efficiency (EFI_LAIs_1), as indicated in
below in eqs. [7] and [8]:
Discussion
To study tradeoffs between growth and reproduction in P. pinaster, a general ZIP model was fitted to
estimate both occurrence and intensity of cone production in a mature stand only this species. The
most influential variables were retained in the final
model, including some growth-related variables.
Specifically, the final model included variables
related to the climate two and three years before cone maturation, tree size and crown attributes, local stand
density (competition level), and growth efficiency. As
in other similar studies (e.g., Calama et al., 2011), we
studied the impact of weather up to one year before
cone development was initiated. In P. pinaster two
years are required to fully develop cones, so we considered the effects of weather three years prior to cone maturation. This model is more parsimonious that other previously reported for other Mediterranean
pines. Calama et al. (2011), for example, used 41
different variables to estimate Pinus pinea L. cone
production. However, Calama et al. (2011) used a much larger dataset with ten years of cone harvesting. Longer cone harvest period confers an important advantage because cone set varies dramatically across years.
However, differences in reproductive effect measured by Table 3. Results of fitting ZIP models to cone occurrence and cone count in Pinus pinaster.
Hypothesis/Model Response Size Density Competition Climate AIC
1a/Model 1 Occurrence DBH (ns) BA6 (ns) BAL (ns) NAOwinter0 (ns) 2752
NAOwinter1 (ns)
NAOwinter2 (ns)
NAOwinter3(**)
Intensity DBH (***) BA6 (***) BAL (***) NAOwinter0 (***)
NAOwinter1 (ns)
NAOwinter2 (ns)
NAOwinter3(***)
1b/Model 2 Occurrence DBH (ns) BA6 (ns) BAL (ns) NAOwinter3(**) 2882
Intensity DBH (***) BA6 (***) BAL (***) NAOwinter3(***)
1c/Model 3 Occurrence DBH (ns) BA6 (ns) BAL (ns) NAOwinter2 (***) 3064
NAOwinter3(***)
Intensity DBH (***) BA6 (***) BAL (***) NAOwinter3(***)
1c/Model 4 Occurrence - - - NAOwinter3(***) 2879
Intensity DBH BA6 BAL(***) NAOwinter3(***)
1d/Model 5 Occurrence - - - NAOwinter3(***) 2743
Intensity DBH (***) BA6 (***) BAL (***) NAOwinter2 (***)
(7)
cone harvesting records and visual cone counts should also be considered.
Different numerical simulations have been conducted to explore the impact of the predictor variables (winter
weather during the bud formation and flowering years,
tree size, stand density, competition from above, and
growth efficiency) on cone occurrence and intensity
of cone yield. Although a trade-off between cone yield and growth was not found, trends for tree size and stand
density agreed with current scientific knowledge on
cone production. Interestingly, in contrast with Calama
et al. (2011), occurrence and intensity of fruiting are
governed by different variables and just one factor
(weather) was included in both parts of the model.
Variables affecting cone occurrence and intensity of cone production
Cone occurrence
When NAOwinter is relatively high, the winter is drier
in the Iberian Peninsula. The logistic model for cone occurrence showed that a year with relatively high NAOwinter will lead three years later to a year with at
least some cone production. In general, dry winters stimulate the development of reproductive buds in
P. pinaster. This result is consistent with known relationships between environmental conditions and
the life cycle of pine species. Mutke et al. (2005) found
that rainfall during the fourth and the third years before cone maturation are key variables in cone production in P. pinea, a species that takes three years to produce
mature cones (one year more than in P. pinaster).
Intensity of cone production
Four variables affected intensity of fruiting in our
model: winter weather of the flowering year, tree size,
stand density and competition.
Wet winters (indicated by lower NAOwinter) during
the flowering year (2) lead to higher cone yields. These
results suggest that the necessary conditions for high cone counts include a relatively dry winter followed by a relatively wet winter. Dry winters ensure the occurrence of cones by favoring development of cone primordia, and a subsequent wet winter ensures a high cone count by enhancing primordia survival,
flowering and pollination success (Fig. 1a).
Trees with larger diameter are predicted to produce a larger number of cones than smaller trees (Fig. 1b). This result has been previously documented
in other species such as Pinus ponderosa (Krannitz
& Duralia, 2004) and Pseudotsuga menziesii
(El-Kassaby & Barclay, 1992), and is probably explained in part by the generally greater vigor of larger trees
in even-aged stands. Higher tree vigor has also been
shown to produce a higher number of recruits in
next generation (González-Martínez et al., 2006). As
thinning promotes diameter growth, an increase in
cone production is expected as a longer-term benefit
of thinning (Krannitz & Duralia, 2004).
As stand density declines the number of cones produced by a given tree increases (Fig. 1c). This result is consistent with previous observations of
increased cone production after thinning (Verkaik &
Espelta, 2006; Ruano et al., 2013), and can probably
be explained in part by the greater resources available for each tree in less dense stands, allowing more carbon to be allocated to reproductive efforts.
Trees that are experiencing higher levels of competition were predicted to produce higher average cone counts than more dominant trees (Fig. 1d). This result seems to contradict the previously described effect of stand density, by suggesting that trees under more competitive stress from above may be induced to invest more resources in reproductive effort. Some previous studies suggest the opposite (Fowells
& Schubert, 1956; Larson & Schubert, 1970), so in P.
Table 4. Models combining marginal effects of crown dimensions, radial growth, and growth efficiency for predicting
cone intensity.
Model AIC value % AIC improvement of full model over basic model Wi
Basic + CL+ Growtht + EFI_LAIs_t 2617 4.59 14.0244
Basic + CL + Growthtt 2616 4.63 23.1224
Basic + CL + EFI_LAIs_t 2614 4.70 62.8532
Basic + Growtht + EFI_LAIs_t 2670 2.66 0.0000
Wi (Akaike weight) provides a relative weight of evidence for each model and can be interpreted as the probability of model i is the
pinaster we similarly expected that dominant trees would produce the largest number of cones. The positive effect of BAL must be considered with caution, however, because
P. pinaster stands in Central Spain are typically of very low density and tree vertical differentiation is weak, perhaps resulting in similar cone production for trees in different social classes (Fig. 1d). Furthermore, large
trees (note dominant effect of tree diameter) may benefit
from some surrounding tall trees if, for example, a larger proportion of cone primordia survive frost events with some protective cover.
Growth/Reproduction tradeoffs
No tradeoffs were detected between vegetative growth
and cone production. However, a reduction of vegetative
growth when cone production is high has been repeatedly found in different pine species (Linhart & Mitton, 1985;
Krannitz & Duralia, 2004; Climent et al., 2008). In some
cases, these tradeoffs have been proposed to have a genetic basis (Schmidtling, 1981; Linhart & Mitton, 1985). In natural
stands of P. pinaster (this study), trees with higher growth
efficiency also produced higher cone counts on average
(Fig. 2), but the frequency distribution of cone counts was
also wider than for trees with lower growth efficiency. In
a study of Pinus contorta, Dick et al. (1990) found that
presence of male cones reduced tree photosynthetic potential while presence of female cones did not. Tradeoffs between
secondary growth and defense (Sampedro et al., 2011)
and secondary growth and cone production (Climent et al.
2008) have been previously reported for Mediterranean
pines evaluated under controlled conditions. Sampedro et
al. (2011) found negative tradeoffs between growth and
defensive investment in a greenhouse experiment with P.
pinaster seedlings from different provenances. However,
these latter tradeoffs emerged only under phosphorus
limiting conditions. Climent et al. (2008) found that
cone production in a Pinus halepensis seed orchard was
Figure 1. Response of cone count frequency distribution to increasing NAOwinter during flowering year (t-2). (a): DBH=250 mm, BAL=
0 m2/ha, BA
6= 30 m2/ha, CL= 50 dm and EFI_LAIs =0.1 mm/m2. NAO2 = -1, -0.5, 0.5 and 1 (negative: wet while positive: dry). (b):
BAL= 0, BA6= 30, CL= 50 and EFI_LAIs =0.1, NAO2 = -1, DBH= 250, 300, 350 and 400 mm. (c) DBH=250, BAL= 0, NAO2 = -1,
CL= 50 and EFI_LAIs =0.1, BA6 = 25, 30, 35 and 40. (d): DBH= 250, BA6= 30, CL= 50 and Efficiency =0.1, NAO2 = -1, BAL= 0,
7.5, 15, 22.5. BA6 (Basal area based on the 6 nearest trees); BAL (Basal area in larger trees); CL (crown length); EFI_LAI (Growth efficiency based on Leaf Area Index); NAO (Northern Atlantic Oscillation)
a)
c) d)
incompatible with high vegetative growth while Almqvist
et al. (2001) found no statistically significant correlation
between cone production and height growth in Picea
abies. Stands of P. pinaster in Central Spain are located on sandy soils of various depths and are characterized by high heterogeneity in available water and nutrients. Therefore, sites with good conditions for growth may also foster reproduction, while in more homogenous conditions (as those of greenhouse or common garden experiments), tradeoffs between growth and reproduction could emerge or simply be more detectable under the more uniform conditions.
In a detailed fruiting study in natural populations of
Quercus lobata in southern California, Sánchez-Humanes
et al. (2011) found that the cost of seed production differed at different levels of organization within the tree (tree canopy, individual branch and shoot within branch). Likewise the cost of seed production also varied among trees with different average seed production level. Only trees with consistently low seed production potential supported the trade-off theory, and only at the branch level. Their results suggest that any tradeoffs in reproductive allocation in natural populations would be detected at lower levels within trees, such as leaves or branches rather that at the level of the entire tree (Lovett-Doust & Lovett-Doust,
1988; Obeso, 1997). Our results for P. pinaster in a natural
stand in Central Spain agreed with a lack of tradeoffs at the
tree level, as also reported by Knops et al. (2007).
As an alternative possible microsite effects in extreme Mediterranean landscapes (see above), lack of apparent
growth/reproduction tradeoffs in P. pinaster may be
controlled by more general climatic factors. Cone production and growth interact with climate and this fact could have hidden tradeoffs in our study, as growth and cone development were driven by the same variables
describing climate (Despland & Hoyles, 1997). Winter
NAO is negatively related with radial tree growth over
the Iberian Peninsula. However, Bogino & Bravo (2008)
found that the growth variance explained by atmospheric
indices at a finer scale among P. pinaster forests within the Iberian Peninsula was low (8.95 to 37.46%).
Conclusions and perspectives
Climate, stand density and tree conditions (size and
vigor, competition and growth efficiency) influence significantly both cone occurrence and intensity of
fruiting as shown by a ZIP model. As the climate variables included in the model (based on NAO) are general and easily obtained, the proposed model has
practical applicability to predicting Pinus pinaster
cone production in the Iberian Peninsula. Our results
are limited because we used just one monitoring site during three years, so specific studies are needed at local
scales and in other geographical ranges of the species before the method can be applied at operational level. Judging from this model, no strong tradeoffs occurred
between growth and reproduction in P. pinaster from
Central Spain, so that phenotypic selection of those trees that have larger cone production as seed parents should
not forfeit future stand growth in this region. However,
trade-offs with other uses of photosynthates such as for
defensive chemicals or structures (studied by Moreira et
al., 2015 or Di Matteo & Voltas, 2016) should be also
considered. Our model also points to silvicultural actions
(e.g. changes in stand density) that could increase cone
production in natural forests of the species, which may prove useful in the face of impending environmental threats such as climate change
References
Alberto F, Aitken S, Alía R, González-Martínez SC, Hänninen H, Kremer A, Lefèvre F, Lenormand T, Yeaman S, Whetten
R, Savolainen O, 2013. Evolutionary response to climate change -evidence from tree populations. Global Change Biol 19: 1645-1661. https://doi.org/10.1111/gcb.12181
Almqvist C, Jansson G, Sonesson J, 2001. Genotypic correlations between early cone-set and height growth in Picea abies clonal trials. Forest Genet 883: 197-204. Barnett AG, Koper N, Dobson AJ, Schimiegelow F, Manseau
M, 2010. Using information criteria to select the correct variance-covariance structure for longitudinal data in ecology. Meth Ecol Evol 1 (1): 15-24. https://doi. org/10.1111/j.2041-210X.2009.00009.x
Barringer BC, Koening WD, Knops JMH, 2013.
Interrelationships among life-history traits in three California oaks. Oecologia 171: 129-139. https://doi. org/10.1007/s00442-012-2386-9
Bazzaz FA, Ackerly DD, Reekie EG, 2000. Reproductive allocation and reproductive effort in plants. In: Seeds: the ecology of regeneration in plant communities; Fenner M Figure 2. Response of cone count frequency distribution
(ed.), 2nd edn, pp: 1-37. CAB Int, Oxford, UK. https://doi. org/10.1079/9780851994321.0001
Bell G, 1980. The costs of reproduction and their consequences. Am Nat 116: 45-76. https://doi.org/10.1086/283611
Bogino S, Bravo F, 2008. SOI and NAO impacts of Pinus
pinaster Ait. growth in Spanish Forests. TRACE 2007 Tree
Rings in Archaelogy, Climatology and Ecology 6: 21-26. Calama R, Mutke S, Tomé J, Gordo J, Montero G, Tomé M,
2011. Modelling spatial and temporal variability in a
zero-inflated variable: The case of stone pine (Pinus pinea L.)
cone production. Ecol Model 222: 606-618. https://doi. org/10.1016/j.ecolmodel.2010.09.020
Campelo F, Nabais C, García-González I, Cherubini P,
Gutiérrez E, Freitas H, 2009. Dendrochronology of Quercus
ilex L. and its potential use for climate reconstruction in the Mediterranean region. Can J For Res 39: 2486-2493.
https://doi.org/10.1139/X09-163
Climent J, Prada MA, Calama R, Chambel MR, Sánchez de Ron D, Alía R, 2008. To grow or to seed: ecotypic variation in reproductive allocation and cone production by young female Aleppo pine (Pinus halepensis, Pinaceae). Am J Bot 95 (7): 833-842. https://doi.org/10.3732/ajb.2007354
Despland E, Hoyles G, 1997. Climate influences on growth
and reproduction of Pinus banksiana (Pinaceae) ata the limit of the species distribution in Eastern North America. Am J Bot 84 (8): 928-937. https://doi.org/10.2307/2446283
Dick J, Leakey RRB, Jarvis PG, 1990. Influence of female
cones on the vegetative growth of Pinus contorta trees. Tree Phisiol 6: 151-163. https://doi.org/10.1093/ treephys/6.2.151
Di Matteo G, Voltas J, 2016. Multienvironment evaluation of
Pinus pinaster provenances: Evidence of genetic trade-offs
between adaptation to optimal conditions and resistance to the Maritime Pine Bast Scale (Matsucoccus feytaudi). Forest Sci 62 (5): 553-563. https://doi.org/10.5849/ forsci.15-109
Eis S, Garman EH, Ebell LF, 1965. Relation between cone production and diameter increment of Douglas-fir
(Pseudotsuga menziesii (Mirb.) Franco), Grand fir (Abies
grandis (Dougl.) Lindl.) and western white pine (Pinus
monticola Dougl.). Can J Bot 43: 1553-1559. https://doi.
org/10.1139/b65-165
El-Kassaby YA, Barclay HJ, 1992. Cost of reproduction
in Douglas-fir. Can J Bot 70: 1429-1432. https://doi.
org/10.1139/b92-179
Etterson JR, Shaw RG, 2001. Constraint to adaptive evolution in response to global warming. Science 294: 151-154.
https://doi.org/10.1126/science.1063656
Ferrenberg S, Kane JM, Langehan JM, 2015. To grow or defend? Pine seedlings grow less but induce more defences when a key resource is limited. Tree Physiol 35: 107-111.
https://doi.org/10.1093/treephys/tpv015
Fowells HA, Schubert GH, 1956. Seed crops of forest trees
in the pine region of California. U.S. Department of
Agriculture, Technical Bulletin 1150, Government Print
Office, Washington DC.
Fox JF, Stevens GC, 1991. Costs of reproduction in a willow: experimental responses vs. natural variation. Ecology 72: 1013-1023. https://doi.org/10.2307/1940601
Gomulkiewicz R, Holt RD, 1995. When does evolution by
natural selection prevent extinction? Evolution 49: 201-207. https://doi.org/10.1111/j.1558-5646.1995.tb05971.x
Gomulkiewicz R, Houle D, 2009. Demographic and genetic
constraints on evolution. Am Natur 174: E218-229. https:// doi.org/10.1086/645086
González-Martínez SC, Burczyk J, Nathan R, Nanos N, Gil L, Alía R, 2006. Effective gene dispersal and female reproductive success in Mediterranean maritime pine
(Pinus pinaster Aiton). Mol Ecol 15 (14): 4577-4588.
https://doi.org/10.1111/j.1365-294X.2006.03118.x
Hasegawa S, Takeda H, 2001. Functional specialization of
current shoots as a reproductive strategy in Japanese alder
(Alnus hirsuta var. sibirica). Can J Bot 79: 38-48. https://
doi.org/10.1139/b00-143
Hurrell JW, Deser C, 2009. North Atlantic climate variability:
The role of the North Atlantic Oscillation. J Mar Syst 78: 28-41. https://doi.org/10.1016/j.jmarsys.2008.11.026 Johnson JB, Omland KS, 2004. Model selection in ecology
and evolution. Trends Ecol Evol 19 (2):101-108. https:// doi.org/10.1016/j.tree.2003.10.013
Juez L, González-Martínez SC, Nanos N, de-Lucas AI, Ordóñez C, del Peso C, Bravo F, 2014. Can seed production and restricted dispersal limit recruitment in Pinus
pinaster Aiton from the Spanish Northern Plateau? Forest
Ecol Manage 313: 329-339. https://doi.org/10.1016/j. foreco.2013.10.033
Knops JMH, Koenig WD, Carmen WJ, 2007. Negative correlation does not imply a tradeoV between growth
and reproduction in California oaks. Proc Natl Acad Sci USA 104: 16982-16985. https://doi.org/10.1073/ pnas.0704251104
Krannitz PG, Duralia TE (2004) Cone and seed production
in Pinus Ponderosa: A review. Wes North Am Natur 64:
208-218.
Lambert D, 1992. Zero-Inflated Poisson regression
models with an application to defects in manufacturing. Technometrics 34: 1-14. https://doi.org/10.2307/1269547
Larson MM, Schubert GH, 1970. Cone crops of ponderosa pine in central Arizona including the influence of Abert
squirrels. US Dept of Agric, For Serv Rep RM-58, Rocky Mount Forest and Range Exp Stat, Fort Collins, CO, USA.
Lindholm MM, Eggertsson O, Lovelius N, Raspopov O,
Shumilov O, Läämelaid A, 2001. Growth indices of
North European Scots pine record the seasonal North Atlantic Oscillation. Boreal Environ Res 6: 275-284.
Linhart YB, Mitton JB, 1985. Relationships among
in Ponderosa Pine. Am J Bot 722: 181-184. https://doi. org/10.2307/2443545
Lizarralde I, 2008. Dinámica de rodales y competencia en las masas de pino silvestre (Pinus sylvestris L.) y pino negral (Pinus pinaster Ait.) de los sistemas central e Ibérico meridional. Tesis Doctoral, Universidad de
Valladolid, Spain.
Lovett Doust J, Lovett Doust L, 1988. Modules of production and reproduction in a dioecious clonal shrub Rhus typhina. Ecology 69: 741-750. https://doi. org/10.2307/1941023
Martín-Vide J, Fernández-Belmonte D, 2001. El índice
NAO y la precipitación mensual en la España peninsular. Invest Geograf 26: 41-58. https://doi.org/10.14198/ INGEO2001.26.07
Menzel A, 2003. Plant phenological anomalies in Germany and their relation to air temperature and NAO. Clim Change 57: 243-263. https://doi. org/10.1023/A:1022880418362
Miguel I, González-Martínez SC, Alía R, Gil L, 2002. Growth phenology and mating system of maritime pine
(Pinus pinaster Ait.) in central Spain. Invest Agrar: Sist
Recur For 11: 193-204.
Monks A, Kelly D, 2006. Testing the resource-matching hypothesis in the mast seeding tree Nothofagus
truncata (Fagaceae). Austral Ecol 31: 366-375. https://
doi.org/10.1111/j.1442-9993.2006.01565.x
Moreira X, Zas R, Solla A, Sampedro L, 2015 Differentiation of persistent anatomical defensive structures is costly and determined by nutrient availability and genetic growth-defence constraints. Tree Physiol 35: 112-123.
https://doi.org/10.1093/treephys/tpu106
Mutke S, Gordo J, Gil L, 2005. Variability of Mediterranean Stone pine cone production: Yield loss as response
to climate change. Agr Forest Meteor 132: 263-272. https://doi.org/10.1016/j.agrformet.2005.08.002 Nanos N, González-Martínez SC, Bravo F, 2004. Studying
within-stand structure and dynamics with geostatistical and molecular marker tools. Forest Ecol Manage 189: 223-240. https://doi.org/10.1016/j.foreco.2003.08.016 Obeso JR, 1997. Costs of reproduction in Ilex aquifolium:
effects at tree branch and leaf levels. J Ecol 85: 159-166. https://doi.org/10.2307/2960648
Pan W, 2001. Akaike's information criterion in generalized estimating equations. Biometrics 57 (1): 120-125. https://doi.org/10.1111/j.0006-341X.2001.00120.x
Pasho E, Camarero JJ, Luis M de, Vicente-Serrano SM,
2011. Spatial variability in large-scale and regional atmospheric drivers of Pinus halepensis growth in eastern Spain. Agric Forest Meteorol 151: 1106-1119. https://doi.org/10.1016/j.agrformet.2011.03.016
Philippe G, Baldet P, Héois B, Ginisty C, 2006. Reproduction sexuée des conifères et production de
semences en vergers à graines. Cemagref, 570 pp.
Piovesan G, Schirone B, 2000. Winter North Atlantic oscillation effects on the tree rings of the Italian beech (Fagus sylvatica L.) Int J Biometeorol 44: 121-127.
https://doi.org/10.1007/s004840000055
Piovesan G, Adams JM, 2001. Masting behaviour in beech: linking reproduction and climatic variation. Can J Bot 79: 1039-1047. https://doi.org/10.1139/b01-089
Ruano I, Rodríguez E, Bravo F, 2013. Effects of pre-commercial thinning on growth and reproduction in
post fire regeneration of Pinus halepensis Mill. Ann
Forest Sci 70 (4): 357-366. https://doi.org/10.1007/ s13595-013-0271-2
Sampedro L, Moreira X, Zas R, 2011. Costs of constitutive and herbivore-induced chemical defences in pine trees emerge only under low nutrient availability. J Ecol 99: 818-827. https://doi.org/10.1111/j.1365-2745.2011.01814.x
Sánchez-Humanes B, Sork VL, Espelta J, 2011. Tradeoffs
between vegetative growth and acorn production in
Quercus lobata during a mast year: the relevance of
crop size and hierarchical level within the canopy. Oecologia 166 (1): 101-110. https://doi.org/10.1007/ s00442-010-1819-6
Santos-del-Blanco L, Climent J, González-Martínez SC, Pannell JR, 2012. Genetic differentiation for size at
first reproduction through male versus female functions
in the widespread Mediterranean tree Pinus pinaster. Ann Bot 110: 1449-1460. https://doi.org/10.1093/aob/ mcs210
Schmidtling RC, 1981. The inheritance of precocity and its relationship with growth in Loblolly pines. Silvae Genetica 30: 188-192.
Selas V, Piovesan G, Adams JM, Bernabei M, 2002.
Climatic factors controlling reproduction and growth of Norway spruce in southern Norway. Can J For Res 32: 217-225. https://doi.org/10.1139/x01-192
Stach A, Emberlin J, Smith M, Adams-Groom B, Myszkowska D, 2008. Factors that determine the
severity of Betula spp. pollen seasons in Poland (Poznań
and Krakow) and the United Kingdom (Worcester and London). Int J Biometeorol 52: 311-321. https://doi. org/10.1007/s00484-007-0127-2
Stenseth NC, Ottersen G, Hurrell JW, Mysterud A, Lima M, Chan KS, Yoccoz NG, Ådlandsvik B, 2003.
Studying climate effects on ecology through the use of climate indices, the North Atlantic Oscillation, El Niño Southern Oscillation and beyond. Proc R Soc Lond, B Biol Sci 270: 2087-2096. https://doi.org/10.1098/ rspb.2003.2415
Sugiyama S, Bazzaz FA, 1998. Size dependence of
reproductive allocation: the influence of resource
Tapias R, Climent J, Pardos JA, Gil L, 2004. Life histories of Mediterranean pines. Plant Ecol 171: 53-68. https:// doi.org/10.1023/B:VEGE.0000029383.72609.f0 Tappeiner JC, 1969. Effect of cone production on branch,
needle, and xylem ring growth of Sierra Nevada
Douglas-fir. For Sci 15: 171-174.
Thomas SC, 2011. Age-related changes in tree growth and functional biology: the role of reproduction. In: Size- and age-related changes in tree structure and function; Meinzer FC et al. (eds), pp: 33-64. Springer. https://doi. org/10.1007/978-94-007-1242-3_2
Verkaik I, Espelta JM, 2006. Post-fire regeneration
thinning, cone production, serotiny and regeneration age in Pinus halepensis. Forest Ecol Manage 231 (1-3): 155-163. https://doi.org/10.1016/j.foreco.2006.05.041 Wang G, Schimel D, 2003. Climate change, climate
modes, and climate impacts. Ann Rev Environ Resour 28: 1-28. https://doi.org/10.1146/annurev. energy.28.050302.105444