1
CERTIFICACIÓN
Yo, Ph.D. Hugo Navarrete, certifico que la disertación de Licenciatura en Ciencias
Biológicas del candidato Alejandro Federico Arteaga Navarro, “Comparative phylogeography reveals cryptic diversity and repeated patterns of cladogenesis for
amphibians and reptiles in northwestern Ecuador”, ha sido concluida en conformidad con las normas establecidas, por lo tanto, puede ser presentada para la calificación correspondiente.
Ph.D. Hugo Navarrete
Director de la disertación
Quito, abril de 2015
2
PONTIFICIA UNIVERSIDAD CATÓLICA DEL ECUADOR
FACULTAD DE CIENCIAS EXACTAS Y NATURALES
ESCUELA DE CIENCIAS BIOLÓGICAS
COMPARATIVE PHYLOGEOGRAPHY REVEALS CRYPTIC DIVERSITY AND REPEATED PATTERNS OF CLADOGENESIS FOR AMPHIBIANS AND REPTILES
IN NORTHWESTERN ECUADOR
Disertación previa a la obtención del título de licenciado en Ciencias Biológicas.
Alejandro Federico Arteaga Navarro
Quito, abril de 2015
3
Comparative phylogeography reveals cryptic
diversity and repeated patterns of cladogenesis for
amphibians and reptiles in northwestern Ecuador
Alejandro Arteaga1,2*
1Escuela de Ciencias Biológicas, Pontificia Universidad Católica del Ecuador, Quito, Ecuador, 2 Tropical Herping, Quito, Ecuador
*E-mail: alejandro@tropicalherping.com
4
Abstract
Comparative phylogeography is now a common approach to understand how
historical processes have shaped the formation of lineages in a broad spectrum of
codistributed populations of different taxa. However, these types of studies are scarce in the
Neotropics, a region that is characterized by speciose assemblages, complex geological
history, and poorly understood historical biogeography. To cope with this lack of knowledge,
in this study, we apply a broad comparative approach to investigate the diversification
patterns, if any, of five lineages of amphibians and reptiles codistributed at the biogeographic
boundaries of the Choco and Andes ecoregions in northwester Ecuador. Mitochondrial
sequences were used to determine the degree of diversification within species. Our results
highlight congruent patterns of parapatric speciation and common geographical barriers for
distantly related taxa. These comparisons indicate similar biological and demographic
characteristics for the included clades, and reveal the existence of two new species of
Pristimantis previously subsumed under P. walkeri. Our data supports the hypothesis that widely distributed Chocoan taxa may generally experience their greatest opportunities for
isolation and parapatric speciation across elevational thermal gradients in the adjacent
montane forests. Finally, our study provides critical information to predict which unstudied
lineages may harbor cryptic diversity, and how geology and climate are likely to have shaped
5
Introduction
Northwestern South America is privileged for being located in an area where two of
the most biodiverse terrestrial ecoregions of the planet meet, the Andes and the Chocoan
lowlands. Together, these to ecoregions harbor nearly 18.5% of the world’s total diversity of
terrestrial vertebrates (Mittermeier et al 2011; Jenkins et al 2013; Kluge 2008). For example,
in Mindo, Ecuador, a transitional valley of only 268 km2 located where the Choco meets the
Andes (ca 1000 m), 101 species of amphibians and reptiles have been registered (Arteaga,
Bustamante & Guayasamin 2013). Another locality in NW Ecuador, Bilsa Biological Station,
harbors 109 species of herpetofauna in only 33 km2 (Ortega-Andrade et al 2010). The reason why this transitional area is so diverse in relation to other tropical areas could be explained by
a history of biological interchanges (Elmer et al 2013; Pinto Sánchez et al 2012; Pyron & Wiens 2013), lower rates of extinction (Pyron & Wiens 2013; Rolland et al 2014), or greater rates of speciation than other regions (Pyron & Wiens 2013; Rolland et al 2014). This latter
cause explained by the interaction between the geographic and climatic complexity of
tropical mountainous areas (Weir & Price 2011; Kozak & Wiens 2007), the evolutionary
conservatism of climatic niches (Cadena et al 2012; Hutter, Guayasamin & Wiens 2013), and the time the lineages have persisted in the region (Smith et al 2014; Rolland et al 2014; Hutter, Guayasamin & Wiens 2013).
From the scenarios outlined above, one that we can evaluate with our data is that of
speciation in complex watersheds and montane ecosystems through simple models of
vicariance (Wiens 2004). Several authors (Lynch & Duellman 1997; Arteaga, Bustamante &
Guayasamin 2013; Torres-Carvajal & Lobos 2014; Guayasamin et al 2015) have already
suggested that both the valleys and the large river systems of this region have effectively
6
determine if these elements of the landscape have affected distantly related lineages of
herpetofauna in the same way. Barriers and ecological gradients might be common to all
lineages, but ultimately what determines the pattern of speciation in an area is the measure by
which those elements of the landscape affect the ability of the organisms to disperse (García
et al 2012; Daza, Castoe & Parkinson 2010). Evidence for allopatric speciation driven by geographical barriers is abundant (Vences & Wake 2007), but evidence for parapatric
speciation along ecological gradients remains scarce (Coyne & Orr 2004; Price 2008),
although this latter pattern has been suggested to have play an important role in the speciation
of amphibians in the Andes (Lynch & Duellman 1997).
One way to study the effect that geographical barriers have on the diversification of
distinct groups of organisms is comparative phylogeography (Avise 2000; Ree & Smith
2008; Ree & Sanmartín 2009). These studies at the molecular and geographical level make it
possible to infer patterns of species diversification from the current geographic distribution of
genetic diversity (Feldman & Spicer 2006; Leaché, Crews & Hickerson 2007), and to
evaluate the impact of historical events on the genetic composition and structure of biotic
assemblages (Rocha et al 2002; Zink 2002; Pastorini et al 2003). In addition, this information
allows us to create hypotheses about current patterns of species distributions and to infer
which lineages that have not been studied at the molecular level may harbor cryptic diversity.
Recent studies in Ecuador addressing geographic patterns of diversification have been
focused on groups of closely related amphibians (Elmer et al 2013; Hutter, Guayasamin & Wiens 2013) and reptiles (Torres et al 2014; Torres-Carvajal & Mafla-Endara 2013). None of these studies have used a comparative phylogeographic approach across reptiles and
7
different questions and provide a wider perspective of the co-diversification and speciation of
their target area. In this study, we use two pairs of species of reptiles belonging to the
families Gymnopthalmidae and Viperidae; and three pairs of species of amphibians
belonging to the family Craugastoridae, to describe geographic patterns of diversification.
The sister-species pairs were chosen for i) being co-distributed in northwestern Ecuador and
ii) having been considered conspecific in the past.
Materials and methods
Ethics statement
This study was carried out in strict accordance with the guidelines for use of live
amphibians and reptiles in field research compiled by the American Society of Ichthyologists
and Herpetologists (ASIH), The Herpetologists' League (HL) and the Society for the Study of
Amphibians and Reptiles (SSAR). Research and collection were done under permits of the
Ecuadorian Ministry of the Environment: No14-2011-IC-FAU-DPAP-MA, No
05-2013-IC-FAU-DPAP-MA and No01-2014-AD-RIC-FAU-DPAP-MA, granted to Juan M. Guayasamin
through Universidad Tecnológica Indoamérica, and permit No012-IC-FAN-DPEO-MAE,
granted to Mario Yánez-Muñoz through the Museo Ecuatoriano de Ciencias Naturales.
Specimens were euthanized with 20% benzocaine, fixed in 10% formalin and stored in 70%
ethanol. Museum vouchers were deposited at the Museo de Zoología of the Universidad
Tecnológica Indoamérica (MZUTI).
Sampling
A total of 103 samples representing 13 species (including two yet undescribed
8
(Table 1). Our study focuses on five lineages. Each lineage contains two species known to be
the closest morphological relative of each other. One species is relatively widely distributed
on evergreen lowland and foothill forests of western Ecuador (Fig. 1), and the other species is
mostly restricted to evergreen lower-montane forests in northwestern Ecuador (Fig. 1). The
five lineages share similar patterns of distribution, but have totally different dispersal
characteristics and life history traits. Samples from genera other than Bothrops, Alopoglossus
and Pristimantis were used as outgroups for phylogenetic analyses (S1 Table). 199 sequences
from GenBank were included in the analyses as well (S1 Table).
[image:8.595.72.436.405.760.2]Figure 1. Main vegetation zones and rivers in the Ecuadorian northwest. The map is a simplified version of the main vegetation zones of Sierra (1999).
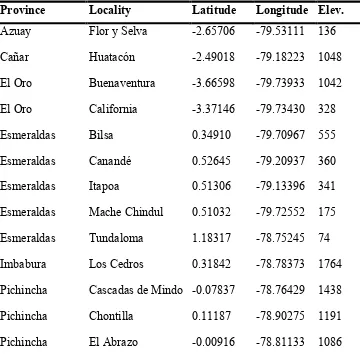
Table 1. Sampling locations.
Province Locality Latitude Longitude Elev.
Azuay Flor y Selva -2.65706 -79.53111 136
Cañar Huatacón -2.49018 -79.18223 1048
El Oro Buenaventura -3.66598 -79.73933 1042
El Oro California -3.37146 -79.73430 328
Esmeraldas Bilsa 0.34910 -79.70967 555
Esmeraldas Canandé 0.52645 -79.20937 360
Esmeraldas Itapoa 0.51306 -79.13396 341
Esmeraldas Mache Chindul 0.51032 -79.72552 175
Esmeraldas Tundaloma 1.18317 -78.75245 74
Imbabura Los Cedros 0.31842 -78.78373 1764
Pichincha Cascadas de Mindo -0.07837 -78.76429 1438
Pichincha Chontilla 0.11187 -78.90275 1191
9
Pichincha Las Gralarias -0.00158 -78.73858 1793
Pichincha Mashpi lodge 0.16352 -78.87274 1060
Pichincha Milpe 0.03489 -78.86713 1070
Pichincha Sachatamia -0.02470 -78.75909 1704
Pichincha Selva Virgen 0.10673 -78.18542 355
Pichincha Séptimo Paraíso -0.02808 -78.76667 1537
Pichincha Silanche 0.14577 -79.14338 418
Pichincha Sueños de Bambú -0.06655 -78.77158 1391
Pichincha Tandayapa Lodge 0.00249 -78.68083 1730
Pichincha Yellow House -0.04505 -78.75938 1498
Santo Domingo Otongachi -0.32145 -78.95094 661
All specimens included in the genetic analyses came from the localities listed on Table 1 and
were morphologically identified according to Lynch & Duellman (1997), Arteaga et al
(2013), Campbell & Lamar (2004) and Torres-Carvajal & Lobos (2014). Novel sequences are
marked with an asterisk under S1 Table, which includes museum vouchers at the Museo de
Zoología of the Universidad Tecnológica Indoamérica (MZUTI) and the División de
Herpetología del Museo Ecuatoriano de Ciencias Naturales (MECN), along with individuals
released after sampling (ANF and AA). Among the newly sequenced specimens, there are: 4
Bothrops osbornei, 5 B. punctatus, 8 Alopoglossus festae, 2 A. viridiceps, 12 Pristimantis crenunguis, 14 P. labiosus, 31 P. luteolateralis, 3 Pristimantis mindo, 2 P. parvillus, 12 P. subsigillatus, 4 P. walkeri, and six specimens belonging to the two new species described
10
Laboratory techniques
Genomic DNA was extracted from 96% ethanol-preserved tissue samples (liver,
muscle tissue or scales) using a modified salt precipitation method based on the Puregene
DNA purification kit (Gentra Systems). For amphibians, we amplified the mitochondrial 12S
gene using the primers t-Phe-frog and Val-frog developed by Wiens et al (2005) and 12L29E-F and 12H46E-R developed by Heinicke et al (2007). For the 16S gene we used the
primers 16SC and 16Sbr-H developed by Darst & Cannatella (2004) and Palumbi et al
(1991), respectively. For reptiles, we amplified the 12S gene using the primers 12Sa and
12Sb developed by Kocher et al (1989), and the 16S gene using the primers 16Sar and 16Sbr developed by Simon et al (1994). Additionally, the cytb gene was obtained with the primers L14910 and H16064 developed by Burbrink et al (2000), whereas the subunit 4 of the NADH
dehydrogenase mitochondrial gene was amplified with using the primers ND4_F and ND4_R
developed by Arévalo et al (1994). The DNA amplification reactions of gene fragments
contained 1 µL of extracted DNA, 0.5 µL of dNTPs, 0.5 µL of forward and reverse primers,
1.5 µL of MgCl2, 0.25 µL of Taq DNA polymerase, 2.5 µL of ThermoPol buffer, and 18.25
µL H2O. PCR products were visualized in 1% agarose gel, and unincorporated primers and
dNTPs were removed from PCR products by ExoI/SAP digestion. Cycle sequencing
reactions were performed by Macrogen Labs (Macrogen Inc., Korea). All fragments were
sequenced in both forward and reverse directions. The sequences were deposited in GenBank
(S1 Table).
DNA sequence analyses
11
Geneious ProTM 5.4.7 (Drummond et al 2010). The resulting sequences and those already available from Genbank (S1 Table) were aligned using MAFFT v.7 (Katoh & Standley
2013), under the default parameters in Geneious ProTM 5.4.7. Genes were combined into a
single matrix with eight partitions, three per protein coding gene corresponding to each codon
position. The best partition strategies along with the best-fit models of evolution were
obtained in PartitionFinder 1.1.1 (Lanfear et al 2012) and jModeltest (Darriba et al 2012) under the Bayesian information criterion. In the mitochondrial matrix, we defined eight a
priori partitions (12S, 16S and one partition for each codon position of ND4 and cytb). Phylogenetic relationships were assessed under a Bayesian approach in MrBayes 3.2.0
(Ronquist & Huelsenbeck 2003). Four independent analyses were performed to reduce the
chance of converging on a local optimum. Each analysis consisted of 6.7 million generations
and four Markov chains with default heating settings. GenBank accession numbers are listed
in S1 Table. Trees were sampled every 1,000 generations, resulting in 5,000 saved trees per
analysis after 25% of those were arbitrarily discarded as ‘‘burn-in.’’ Stationarity was
confirmed by plotting the –ln L per generation in the program Tracer 1.2 (Rambaut and
Drummond 2003). Genetic distances were calculated using the uncorrected distance matrix in
PAUP 4.0 (Swofford 2004).
Morphological data
Generic and family names used in this study follow Pyron & Wiens (2011) and
Guayasamin (2004) for amphibians, Hendry et al (2014) for vipers and Pellegrino et al
(2001) for lizards. To examine species boundaries within Pristimantis, our diagnoses and descriptions generally follow Duellman & Lehr (2009). We examined comparative
alcohol-preserved specimens from the herpetology collections at the MZUTI, MECN and Fundación
12
we use the ± symbol. Morphological measurements were taken with digital calipers to the
nearest 0.1 mm, as described by Lehr and Coloma (2008). These are as follows: (1) snout–
vent length (SVL), (2) tibia length, (3) foot length, (4) head length, (5) head width, (6) eye
diameter, (7) interorbital distance, (8) upper eyelid width, (9) internarial distance, (10) eye–
nostril distance. Sexual maturity was determined by the presence of testis or vocal slits in
males and by the presence of eggs or convoluted oviducts in females.
Distribution maps
We present ranges of occurrence graphically in the form of spatially distributed dots
on a colored representation of Ecuador's relief. Each dot indicates a locality where the species
has been observed. This includes published records, photographic vouchers and museum
specimens deposited at MZUTI, MECN, FHGO and (The University of Kansas) KU. For all
species in the study, a distribution model accompanies the dot maps. These models estimate
potential areas of distribution, on the basis of observed presences and a set of environmental
predictors (Elith & Leathwick 2009). To create the models, we used presence localities listed
on S2 Table, along with the 19 bioclimatic variables from Worldclim 1.4 (Hijmans et al
2005) and Maxent 3.3.3e, an algorithm based on the principle of maximum entropy (Phillips
et al 2006; Elith et al 2011; Renner & Warton 2013). The convergence threshold was set to 10–5, maximum iterations to 500, and the regularization parameter to “auto”.
Results
Bothrops punctatus
and
B. osbornei
13
Including the outgroups, we used 129 mtDNA sequences to build a molecular
phylogeny of the genus Bothrops (Fig. 2). The resulting topology and support is similar to
numerous recent studies (Hendry et al 2014; Fenker et al 2014; Carrasco et al 2012). In agreement with previous results (Hendry et al 2014; Fenker et al 2014), B. punctatus is
recovered as the sister species of B. osbornei. Comparisons of an 759 bp fragment of the mitochondrial NADH dehydrogenase subunit 4 gene between the two species shows a genetic
distance of 7.6%, whereas sequence variation within each of the two species is 0%.
Figure 2. Maximum likelihood phylogram depicting relationships within bothropoid pitvipers. The phylogram was derived from analysis of 2908 bp of mitochondrial DNA (gene fragments 12S, 16S, cytb and ND4). Posterior probabilities and voucher numbers are shown.
Distribution maps.
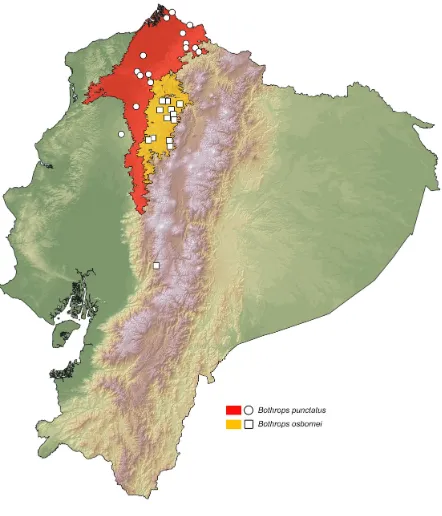
Using a database of museum (S2 Table) and literature (Amaral 1923; Freire-Lascano
1991; Schätti & Kramer 1991; Campbell & Lamar 2002; Morales 2004; Yánez-Muñoz et al
2009) records corresponding to 17 localities for Bothrops punctatus and 17 for B. osbornei,
we modeled the habitat suitability for each of the species (Fig. 3). The resulting distribution
map is similar to previous works (Campbell & Lamar 2004; Arteaga et al 2013), but nearly doubles the number of known localities and shows a distinct geographical separation between
the two vipers. The predicted area of potential distribution for B. punctatus is related with evergreen lowland and foothill forests in Ecuador (Sierra 1999) (Figs. 1 and 3), whereas for
B. osbornei, the predicted area of potential distribution is mostly related with evergreen lower-montane forests, cloudforests and foothill forests (Sierra 1999) (Figs. 1 and 3). From
our database of known localities, we estimated altitude limits of distributions: 15–864 m for
14
two species.
Figure 3. Distribution of Bothrops osbornei and B. punctatus in Ecuador. White dots represent known localities. Each colored area represents the potential distribution of one of
the clades recovered in the phylogeny of Fig. 2.
Systematics.
Several authors (Campbell & Lamar 1992; McDiarmid et al 1999; Arteaga et al 2013) have considered Bothrops punctatus and B. osbornei to be conspecific. Our results at the
molecular and ecological level now support the view of other authors (Freire-Lascano 1991;
Schätti & Kramer 1991; Schätti & Kramer 1993; Campbell & Lamar 2004) who have used
morphological data to support the validity of Bothrops osbornei. Although similar in outer morphology and scale counts (Campbell & Lamar 2004) our sampled individuals show
indeed subtle but consistent differences in coloration (Fig. 4). B. osbornei has a dorsal pattern
of dark trapezoidal blotches, whereas B. punctatus has a pattern of spots arranged in in the form of squares.
Figure 4. Morphological variation within sampled Bothrops species. (a) Juvenile of B. punctatus (ANF 1575). (b) Adult (ANF 2101) of B. punctatus. (c) Juvenile of B. osbornei
(ANF 2005). (d) Adult of B. osbornei (ANF 2767).
Phylogeography.
Despite uncertainties in the higher-level relationships of Bothrops, both the species distribution modeling (Fig. 3) and the mtDNA phylogeny suggest that B. osbornei is an
15 al 1999; Wüster et al 2002) further supports this view.
Alopoglossus festae
and
A. viridiceps
Molecular analyses.
Including the outgroups, we used 26 mtDNA sequences to build a molecular
phylogeny of the genus Alopoglossus (Fig. 5). The resulting topology and support is similar
to the most recent study (Torres-Carvajal & Lobos 2014), and A. festae is recovered as the sister species of A. viridiceps. Comparisons of a 596 bp fragment of the mitochondrial NADH dehydrogenase subunit 4 gene between the two species shows a genetic distance of 12.4–
13.4%, whereas sequence variation within A. viridiceps is 0%, and within A. festae is 2.2– 6.4%.
Figure 5. Maximum likelihood phylogram depicting relationships within the genus
Alopoglossus. The phylogram was derived from analysis of 1221 bp of mitochondrial DNA (gene fragments 12S, 16S, cytb and ND4). Posterior probabilities and voucher numbers are
shown.
Distribution maps.
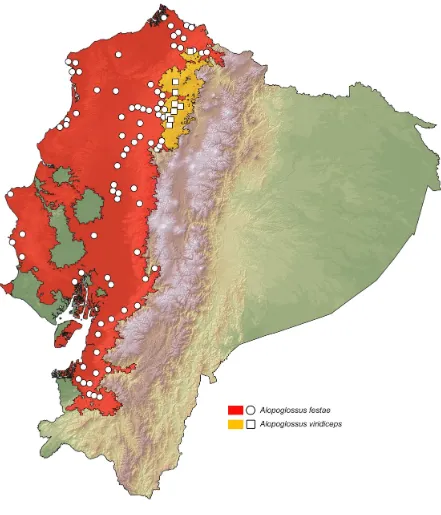
Using a database of museum (S2 Table) and literature (Peracca 1904; Miyata 1976;
Yánez-Muñoz 2005; Savid 2006; Almendariz & Carr 2007; Köhler et al 2012; Lynch et al
2014; Torres-Carvajal & Lobos 2014) records corresponding to 88 localities for Alopoglossus
festae and 9 for A. viridiceps, we modeled the habitat suitability for each of the species (Fig. 6). The resulting distribution map of A. festae is similar to previous works (Köhler et al 2012; Arteaga et al 2013; Torres-Carvajal & Lobos 2014), but increases the number of localities.
16
province of Pichincha by Torres-Carvajal & Lobos (2014) to nine localities, including the
provinces of Imbabura and Esmeraldas. The predicted area of potential distribution for A.
festae is related with evergreen and semideciduous lowland and foothill forests in Ecuador (Sierra 1999) (Figs. 1 and 6), whereas for A. viridiceps, the predicted area of potential
distribution is mostly related with evergreen lower-montane forests and cloudforests (Sierra
1999) (Figs. 1 and 6). From our database of known localities, we estimated altitude limits of
distributions: 3–1377 m for A. festae and 1165–1879 for A. viridiceps. We found no localities
of sympatry between the two species.
Figure 6. Distribution of Alopoglossus festae and A. viridiceps in Ecuador. White dots represent known localities. Each colored area represents the potential distribution of one of
the clades recovered in the phylogeny of Fig. 5.
Systematics.
Based on morphological characters, Alopoglossus viridiceps is most closely related to
A. festae (Torres-Carvajal & Lobos 2014) (Fig. 7). This similarity might explain why several
specimens of A. viridiceps housed at MZUTI and MECN, were previously identified as A. festae. Collections of the latter speciesfrom the highlands of Pichincha and Imbabura housed at the AMNH might actually represent A. viridiceps.
Figure 7. Morphological variation within sampled Alopoglossus species. (a) Adult of A. viridiceps (MZUTI 3552). (b) Juvenile of A. festae (MZUTI 2630). (c) Adult of A. festae
(MZUTI 2994). (d) Adult female of A. festae (MZUTI 3370).
Phylogeography.
17
close, but non-overlapping ranges of distribution, Torres-Carvajal & Lobos (2014) suggested
that one of the species originated from the other by allopatric or parapatric speciation. Our
species distribution models, the mtDNA phylogeny, and the fact that both species were
previously confused with each other in museum collections further supports this view.
Published (Savit 2006; Torres-Carvajal & Lobos 2014) and museum (S2 Table) distribution
records of A. viridiceps are located south of the Lita river and north of the Toachi river (Figs. 1, 6). These two rivers might have acted as effective barriers for latitudinal dispersal of A.
viridiceps. Our phylogeny (Fig. 5) shows a deep genetic split between populations of A. festae north of Jubones river and populations of that species south of thar river, suggesting
that this geographical has effectively prevented migration between populations
Pristimantis labiosus
and
P. crenunguis
Molecular analyses.
Including the outgroups, we used 47 mtDNA sequences to build a molecular
phylogeny of the Pristimantis (Hypodictyon) rubicundus species series (Lynch & Miyata 1980; Hedges et al 2008) (Fig. 8). The resulting topology and support is similar to recent
studies (Pyron & Wiens 2011; Pinto-Sánchez et al 2011; Padial et al 2014), and P. labiosus is recovered as the sister species of P. crenunguis. A comparison of a 495 bp fragment of the mitochondrial 16S gene between the two species shows a genetic distance of 5.9–8.1%,
whereas sequence variation within P. crenunguis is 0–0.6%. Within P. labiosus, however, sequence variation ranged from 0% to 6.5%. Based on these results, we suggest that P.
labiosus is composed of at least two cryptic species. The clade formed by MECN 9527, 9528 and MZUTI 3018 is the most genetically distinct and is shown to be sister to all other
18 Figure 8. Maximum likelihood phylogram depicting relationships within the
Pristimantis (Hypodictyon) rubicundus species series. The phylogram was derived from analysis of 1032 bp of mitochondrial DNA (gene fragments 12S and 16S). Posterior
probabilities and voucher numbers are shown.
Distribution maps.
Using a database of museum (S2 Table) and literature (Lynch 1976; Lynch et al 1994;
Lynch & Duellman 1997; Morales 2004; Yánez-Muñoz 2005) records corresponding to 46
known localities for Pristimantis labiosus and 22 for P. crenunguis, we modeled the habitat suitability for each of the species (Fig. 9). The resulting distribution maps are similar to those
most recently published (Arteaga et al 2013). The predicted area of potential distribution for
P. labiosus is related with evergreen lowland and foothill forests in Ecuador (Sierra 1999)
(Figs. 1 and 9), whereas for P. crenunguis, the predicted area of potential distribution is almost exclusively related with evergreen lower-montane forests (Sierra 1999) (Figs. 1 and
9). From our database of known localities, we estimated altitude limits of distributions: 63–
1161 m for P. labiosus and 1165–1793 for P. crenunguis. We found no localities of sympatry between the two species.
Figure 9. Distribution of Pristimantis labiosus and P. crenunguis in Ecuador. White dots represent known localities. Each colored area represents the potential distribution of one of
the clades recovered in the phylogeny of Fig. 8.
Systematics.
19 crenunguis (Lynch et al 1994; Lynch & Duellman 1997; Arteaga et al 2013). Literature (López et al 1998; Reyes 2008) and museum records of P. labiosus above 1200 m likely
correspond to P. crenunguis.
Figure 10. Morphological variation within sampled species of the Pristimantis
(Hypodyction) rubicundus series. (a) Juvenile of Pristimantis crenunguis (Not vouchered).
(b) Adult of P. crenunguis (Not vouchered). (c) Juvenile of P. labiosus (MZUTI 3511). (d)
Adult of P. labiosus (Not vouchered).
Phylogeography.
Lynch and Duellman (1997) and Arteaga et al (2013) suggested that Pristimantis
labiosus and P. crenunguis are altitudinal replacements of each other. The assumption was made based on the similarities in size, structure, microhabitat utilization, and the adjacent
ranges of distribution of the two species. Our species distribution models (Fig. 9) and the
mtDNA phylogeny (Fig. 8) support this view. The close, but non-overlapping ranges of
distribution suggest an allopatric or parapatric pattern of speciation. However, the existence
of at least two genetically structured lineages within P. labiosus suggest a more complex scenario of speciation than just one event of vicarance between P. labiosus and P. crenunguis. Samples of P. labiosus of evergreen lowland forest north of the Esmeraldas river
(MZUTI 3000, 3051) form a clade distinct from samples of the same species inhabiting
evergreen foothill forests south of the Esmeraldas river (Figs. 1, 8, 9). Although most samples
of P. crenunguis show a degree of geographical structure (north and south of the Guayllabamba river), some samples from south of the Guayllabamba river (MZUTI 1398,
2987) are nested within the samples north of that river (Fig. 8). All published (Lynch 1976;
20
Toachi river (Figs. 1, 9). These two rivers might have acted as effective barriers for
latitudinal dispersal of P. crenunguis.
Pristimantis subsigillatus
and
P. mindo
Molecular analyses.
Including the outgroups, we used 53 mtDNA sequences to build a molecular
phylogeny of the Pristimantis lacrimosus species group (Lynch & Duellman 1980; Hedges et al 2008) (Fig. 11), which includes P. subsigillatus and P. mindo (Arteaga et al 2013). The resulting topology and support is similar to numerous recent studies (Pyron & Wiens 2011;
Pinto-Sánchez et al 2011; Arteaga et al 2013; Padial et al 2014; Rivera-Prieto et al 2014), and P. subsigillatus is recovered as the sister species of P. mindo. Comparisons of a 695 bp
fragment of the mitochondrial 16S gene between the two species shows a genetic distance of
10.4–10.9%, whereas sequence variation within P. mindo is 0–0.4%, and within P. subsigillatus is 0–2.0%.
Figure 11. Maximum likelihood phylogram depicting relationships within the
Pristimantis lacrimosus species group. The phylogram was derived from analysis of 2598 bp of mitochondrial DNA (gene fragments 12S and 16S). Posterior probabilities and voucher
numbers are shown.
Distribution maps.
Using a database of museum (S2 Table) and literature (Lynch & Duellman 1997;
Ortega-Andrade & Altamirano 2004; Muñoz 2005; Almendariz & Carr 2007;
Yánez-Muñoz et al 2009; Arteaga et al 2013) records corresponding to 45 localities for Pristimantis
21
(Fig. 12). The resulting distribution maps are similar to the most recent revision of the species
(Arteaga et al 2013). For P. mindo, the seven localities of occurrence reported at the time of
description (Arteaga et al 2013) are now expanded to 14 localities, including the current upper and lower limits of the altitudinal distribution of the species. The localities were added
based on museum vouchers (S2 Table) or photographic or acoustic vouchers from Curipogio
(00.13112 N 78.67632 S; 1171 m), Cascadas de Mindo (00.08002 S 78.76251 W; 1381 m),
Milpe (00.03905 N 78.87054 W; 1055 m), Mashpi Lodge (00.16537 N 78.87244 W; 1060
m), Estación La Favorita (00.22833 S 78.76503 W; 1810 m) and Saragoza Río Cinto
(00.12891 S 78.75437 W 1522 m). The predicted area of potential distribution for P.
subsigillatus is related with evergreen lowland and foothill forests in Ecuador (Sierra 1999) (Figs. 1 and 12), whereas for P. mindo, the predicted area of potential distribution is mostly related with evergreen lower-montane forests and cloudforests (Sierra 1999) (Figs. 1 and 12).
From our database of known localities, we estimated altitude limits of distributions: 27–1092
m for P. subsigillatus and 1056–1810 for P. mindo. We found two localities of sympatry
between the two species (i.e. Mashpi and Milpe).
Figure 12. Distribution of Pristimantis mindo and B. subsigillatus in Ecuador. White dots represent known localities. Each colored area represents the potential distribution of one of
the clades recovered in the phylogeny of Figure 11.
Systematics.
Based on morphological characters, Pristimantis subsigillatus is most closely related to P. mindo (Arteaga et al 2013) (Fig. 13). This similarity might explain why several specimens of P. mindo housed at MZUTI and MECN, were previously identified as P.
22 subsigillatus (KU 218147) from a previous study (Heinicke et al 2007) may have been misidentified, and is actually a P. nyctophylax.
Figure 13. Morphological variation within sampled species of the Pristimantis lacrimosus species group. (a) Adult male of Pristimantis subsigillatus (MZUTI 2228). (b) Adult female of P. subsigillatus (MZUTI 2653). (c) Adult male of P. mindo (MZUTI 1382). (d) Adult female of P. mindo (MZUTI 1766).
Phylogeography.
The morphological similarities between P. subsigillatus and P. mindo, and their close, and slightly overlapping ranges of distribution, lead Arteaga et al (2013) to suggest that one
of the species originated from the other through a parapatric process of speciation. Our
species distribution models (Fig. 12), the mtDNA phylogeny (Fig. 11), the discovery of
localities of sympatry, and the fact that both species were previously confused with each
other in museum collections further supports this view. Each of the two known populations of
P. mindo are reciprocally monophyletic and exhibit greater genetic distance from each other
(0.4%) than within populations (0%). This pattern is best explained by the presence of the
Guayllabamba river (Fig. 1), which seems to be acting as a dispersal barrier. On the contrary,
the pattern of cladogenesis within P. subsigillatus is not geographically structured (Fig. 11),
with samples north and south of the different river systems not clustering together.
Pristimantis walkeri
and
P. luteolateralis
Molecular analyses.
Including the outgroups, we used 78 mtDNA sequences to build a molecular
23
species group (Lynch & Duellman 1997; Hedges et al 2008) (Fig. 14). Based on the topology recovered in previous studies (Hedges et al 2008; Pyron and Wiens 2011; Pinto-Sánchez et al
2011; Padial et al 2014), we decided to include three members of the Pristimantis
(Hypodiction) ridens series (Hedges et al 2008) as outgroups, along novel sequences for P.
luteolateralis, P. parvillus, P. walkeri, and two other species previously subsumed under P. walkeri. With similar support values as in recent studies (Hedges et al 2008; Pyron & Wiens 2011; Pinto-Sánchez et al 2011), we recover a sister relationship between P. walkeri and P.
luteolateralis (Fig. 14). However, as currently circumscribed (Lynch and Duellman 1997; Arteaga et al 2013), P. walkeri is paraphyletic, with P. luteolateralis and P. parvillus nested
right within P. walkeri. To cope with this problem and to accurately reflect their distinct evolutionary histories, we treat each of the three clades of P. walkeri in our phylogeny as distinct species: P. aff. walkeri N, P. walkeri sensu stricto and P. aff. walkeri S (together
referred to as P. walkeri sensu lato). As well as in other studies, (Hedges et al 2008; Pyron & Wiens 2011; Pinto-Sánchez et al 2011) the yellow-groined rainfrogs Pristimantis
luteolateralis, P. parvillus and P. walkeri form a strongly supported clade. Our study shows, however, that P. aff. walkeri N belongs to the assemblage, but P. chalceus, P. esmeraldas and
P. aff. walkeri S do not. A comparison of a 731 bp fragment of the mitochondrial 12S gene
between P. walkeri sensu stricto and P. luteolateralis shows a genetic distance of 2.9–4.5%, whereas sequence variation within P. walkeri is 0–0.1%, and within P. luteolateralis is 0–
0.7%. For the same fragment, P. walkeri sensu stricto and P. aff. walkeri N show a genetic distance of 5.2–5.5%, whereas sequence variation within P. aff. walkeri N is 0–0.1%.
24
voucher numbers are shown.
Distribution maps.
Using a database of museum (S2 Table) and literature (Lynch & Duellman 1997;
Morales 2004; Ortega-Andrade & Altamirano 2004; Almendariz & Carr 2007; Yánez-Muñoz
et al 2009; Valencia & Garzón 2013; Lynch et al 2014) records corresponding to 53 localities
for Pristimantis walkeri, 9 for P. aff. walkeri N, 6 for P. aff. walkeri S, and 39 for P. luteolateralis, we modeled the habitat suitability for each of the species (Fig. 15). For P.
luteolateralis, the resulting distribution map greatly expands that of Lynch & Duellman (1997), and closely resembles that of Arteaga et al (2013). Unlike previous works (Lynch & Duellman 1997; Arteaga et al 2013), our distribution map of P. walkeri sensu stricto shows
that it is endemic to the evergreen lowland and foothill forests of central Ecuador (Sierra
1999), whereas the northern and southern portion of its previously reported range now
corresponds to that of P. aff. walkeri N and P. aff. walkeri S, respectively. For P. luteolateralis, the predicted area of potential distribution is almost exclusively related with evergreen lower-montane forests (Sierra 1999). From our database of known localities, we
estimated altitude limits of distributions: 27–1155 m for P. walkeri and 905–1879 for P. luteolateralis. We found no localities of sympatry between any of the four species.
Figure 15. Distribution of P. aff. walkeri S, P. luteolateralis, P. aff. walkeri N and P. walkeri in Ecuador. White dots represent known localities. Each colored area represents the potential distribution of one of the clades recovered in the phylogeny of Figure 14.
Systematics.
25
authors (Yánez-Muñoz et al 2009; Arteaga et al 2013) have confused intermediate elevation populations of P. luteolateralis with P. walkeri sensu stricto. Our genetic analyses of P.
walkeri sensu lato demonstrate the existence of at least three highly distinct lineages that deserve full-species status. By examining specimens of P. walkeri sensu lato, we found
consistent morphological differences among the three genetic lineages. One of these, P. walkeri sensu stricto, is herein restricted to the populations in the central Pacific lowlands of Ecuador, where the type locality of P. walkeri lies (Las Palmas). Populations of the type
locality were included in the molecular analyses, and they are nested within the clade herein
defined as P. walkeri sensu stricto.
Figure 16. Ecuadorian Trans-Andean Pristimantis characterized by their yellow to orange pigmentation in the hidden surfaces of the hind limbs. (a) Adult male of P. aff. walkeri S (MZUTI 3270). (b) Adult male holotype of P. aff. walkeri S (MZUTI 3480). (c) Adult female paratype of P. aff. walkeri S (MZUTI 3356). (d) Adult male of P. aff. walkeri N (MZUTI 3913). (e) Adult male of P. aff. walkeri N (MZUTI 3914). (f) Adult male of P. aff.
walkeri N (MZUTI 3915). (g) Adult male of P. luteolateralis (MZUTI 3092). (h) Adult male of P. luteolateralis (MZUTI 3904). (i) Adult female of P. luteolateralis (Not vouchered). (j)
Adult male of P. parvillus (Not vouchered). (k) Adult male of P. walkeri (MZUTI 1768). (l) Adult female of P. walkeri (MZUTI 1769). (m) Adult female of P. scolodiscus (Not vouchered). (n) Adult male of P. esmeraldas (MZUTI 3545). (o) Adult female of P. esmeraldas (MZUTI 3375).
Phylogeography.
The topology of our mtDNA phylogeny (Fig. 14) suggests that the clade containing P.
26
of P. walkeri sensu stricto currently present south of the Esmeraldas river and throughout the Chocoan lowlands of Central Ecuador. Lynch and Duellman (1997) and Arteaga et al (2013)
suggested that Pristimantis walkeri and P. luteolateralis are altitudinal replacements of each other. The assumption was made based on the similarities in size, structure, microhabitat
utilization, and the adjacent ranges of distribution of the two species. Our species distribution
models and the mtDNA phylogeny support this relationship when the name P. walkeri is restricted to the populations south of the Esmeraldas river. We found populations of P. aff.
walkeri S to be more closely related to P. unistrigatus than to P. walkeri, suggesting no direct common ancestry between P. aff. walkeri S and P. walkeri.
Table 2. Character states in the Ecuadorian Trans-Andean Pristimantis with yellow to orange pigmentation in the hidden surfaces of the hind limbs.
Species Heel tubercles Groin pattern Oblique lateral stripe P. aff walkeri S Present, low Orange spots outlined in black Absent
P. aff walkeri N Present, low Yellow blotches outlined in black Present, faint
P. esmeraldas Absent Yellow blotches, sometimes absent Absent
P. luteolateralis Present, subconical
Yellow blotches outlined in black Present, distinct
P. parvillus Present, low Large yellow oval spot Absent
P. scolodiscus Present, low Large yellow oval spot Absent
P. walkeri Present, low Yellow blotches outlined in black Absent
Discussion
When analyzed together, our five mtDNA molecular phylogenies and 14 species
distribution models reveal a pattern of cladogenesis that is common for at least five pairs of
[image:26.595.69.537.398.594.2]27
parapatric speciation event in which a widely distributed Chocoan taxon gives rise to a more
restricted montane-forest vicariant. A parapatric model is suggested because populations of
the sister species are not separated by a geographical barrier, but by changes in vegetation
zones.
The common phylogeographic pattern involves a Chocoan ancestor whose
geographical range included a portion of the adjacent foothill and lower-montane forests in
the area between the Mira and Toachi river valleys, the area in Ecuador where these two
vegetation zones are wider (Fig. 1) and closest to the Equatorial line. Under this suggested
scenario, divergence may have occurred because of reduced gene flow between Chocoan and
montane populations. Closer to the Equator, elevation gradients have a stronger effect on the
dispersal of organisms than a similar gradient on temperate regions (Janzen 1967). This
greater climatic stratification of tropical mountains is hypothesized to increase the likelihood
of parapatric speciation along elevational climatic gradients (Kozak & Wiens 2007; Moritz et al 2000), and may in part explain why our sampled Chocoan lineages (some of which range
into Colombia and Panama) have upland vicariants only in the montane forests closer to the
Equatorial line. Several studies (Huey 1978; Wake & Lynch 1976; Ghalambor et al 2006;
Deutsch et al 2008; Huey et al 2009; McCain 2009; Buckley & Jetz 2008) confirm that closer to the Equator, species occupy more restricted elevational ranges and have narrower thermal
tolerances.
From our results, the strongest evidence to support the scenario described above
comes from the phylogeographic pattern of Pristimantis walkeri and P. luteolateralis (Fig. 14). The phylogeny shows that a Chocoan distribution is the ancestral trait, whereas the
Andean distribution is the derived trait. The second strongest evidence comes from the
28 P. subsigillatus. In all cases, mtDNA sequence variation is greater among populations of the Chocoan species than among populations of the Andean species, suggesting that Chocoan
lineages are older and have had greater time to accumulate non-synonymous substitutions.
The third strongest evidence to support the parapatic pattern of speciation comes from the
existence of at least two localities of sympatry between P. mindo and P. subsigillatus (the most genetically distinct pair of species included in this study), suggesting secondary contact
after a process of speciation.
Besides the deep and geographically structured split between the sister taxa included
in this study, our results also show geographically structured mitochondrial subdivisions
within taxa. In Ecuador, we can identify at least two barriers where the taxa share a major
break in genetic composition. The Guayllabamba river (Fig. 1) is likely responsible for the
majority of the genetic heterogeneity observed in Pristimantis crenunguis (Fig. 8), P. mindo
(Fig. 11), P. luteolateralis (Fig. 14). The Guayllabamba river has also been recognized as a genetic boundary in other cloudforest taxa (Guayasamin et al 2015). The Esmeraldas river
(Fig. 1) is likely responsible for the majority of the genetic heterogeneity observed in P. labiosus, and is the main barrier separating populations of P. aff. walkeri N and P. walkeri
sesu stricto. Two other rivers (Mira and Toachi) have presumably acted as effective barriers of dispersal for Alopoglossus viridiceps, P. crenunguis, P. mindo and P. luteolateralis, since none of these species has been found either north of Mira river or south of Toachi river. From
our list of sampled species, the only one known to be distributed south of the Toachi river is
Bothrops osbornei, wich occurs as far south as Sacramento, Chimborazo province (Freire-Lascano 1991). The barrier that has most likely prevented this species from colonizing
montane forests further south is the dry valley of the Chimbo river (Fig. 1).
29
vegetation zones and river valleys in the Ecuadorian northwest suggests that allopatric
speciation may have driven an important part of the current observed diversity of this region.
Our study suggests that widely distributed Chocoan taxa may generally experience their
greatest opportunities for isolation and parapatric speciation across elevational thermal
gradients in the montane forests within 0.8 degrees latitude from the Equatorial line in
Ecuador. We expect that our discovery of hidden species richness and their common patterns
of speciation represent sound testable hypotheses for unstudied taxa or communities that
range both in Chocoan lowlands and their adjacent Equatorial montane forests (e.g. Anadia rhombifera, Tantilla melanocephala and Pristimantis parvillus). These may in fact be species
complexes, with populations inhabiting the montane forests representing distinct evolutionary
units that deserve full-species status.
Acknowledgments
For granting access to their protected forests, I am grateful to Fundación Jocotoco,
Reserva Itapoa and Reserva de Biodiversidad Mashpi. Special thanks to Paolo Escobar,
Daniel Mideros, Ángela León, Rita Hidalgo, Diana Troya, Carlos Morochz, Silvia Cevallos,
Paulina Romero, Chelsea Carson, Javier Aznar, José Vieira, Daniel Romero and Rossana
Romo for their assistance and companionship in the field. Fieldwork was made possible with
the support of the Programa de Becas de Investigación para la Conservación de la
Biodiversidad. Laboratoy work was carried out at Universidad Tecnológica Indoamérica.
Sequencing was made possible with support of the George Washington University, and the
U.S. National Science Foundation. For his constant support and guidance, I am grateful to
30
References
Almendáriz A, Carr JL. Lista actualizada de los anfibios y reptiles registrados en los
remanentes de bosque de la cordillera de la Costa y áreas adyacentes del suroeste de
Ecuador. Quito: Escuela Politécnica Nacional; 2007.
Amaral A do. New genera and species of snakes. Proc New England Zool Club. 1923;8: 85–
105.
Arévalo E, Davis SK, Sites JW Jr. Mitochondrial DNA-sequence divergence and
phylogenetic relationships among eight chromosome races of the Sceloporus grammicus
complex (Phrynosomatidae) in Central Mexico. Syst Biol. 1994;43: 387–418.
Arteaga A, Bustamante L, Guayasamin JM. The amphibians and reptiles of Mindo. Quito:
Universidad Tecnológica Indoamérica; 2013.
Avise JC. Phylogeography: The history and formation of species. Cambridge: Harvard
University Press; 2000.
Buckley LB, Jetz W. Linking global turnover of species and environments. Proc Natl Acad
Sci USA. 2008;105: 17836–17841.
Burbrink FT, Lawson R, Slowinski JB. Mitochondrial DNA phylogeograhy of the polytypic
North American rat snake (Elaphe obsoleta): A critique of the subspecies concept.
Evolution. 2000;54: 2107–2188.
Cadena CD, Kozak KH, Gómez JP, Parra JL, McCain CM, et al. Latitude, elevational
climatic zonation and speciation in New World vertebrates. Proc R Soc B. 2012;279:
194–201.
Campbell JA, Lamar WW. Taxonomic status of miscellaneous Neotropical viperids, with the
description of a new genus. Occas Pap Tex Tech Univ Mus. 1992;153: 1–31.
Campbell JA, Lamar WW. The venomous reptiles of the western hemisphere. New York:
31
Carrasco PA, Mattoni CI, Leynaud GC, Scocchi GJ. Morphology, phylogeny and taxonomy
of South American bothropoid pitvipers (Serpentes, Viperidae). Zool Scr. 2012;41: 109–
124.
Coyne JA, Orr HA. Speciation. Sunderland: Sinauer & Associates; 2004.
Darriba D, Taboada GL, Doallo R, Posada D. jModelTest 2: More models, new heuristics
and parallel computing. Nature Methods. 2012;9: 772–772.
Darst CR, Cannatella DC. Novel relationships among hyloid frogs inferred from 12S and 16S
mitochondrial DNA sequences. Mol Phylogenet Evol. 2005;31: 462–475.
Daza JM, Castoe TA, Parkinson CL. Using regional comparative phylogeographic data from
snake lineages to infer historical processes in Middle America. Ecography. 2010;33:
343–354.
Deutsch CA, Tewksbury JJ, Huey RB, Sheldon KS, Ghalambor CK, Haak DC, Martin PR.
Impacts of climate warming on terrestrial ectotherms across latitude. Proc Natl Acad Sci
USA. 2008;105: 6668–6672.
Drummond AJ, Ashton B, Buxton S, Cheung M, Cooper A, Heled J, et al. Geneious v5.5.
Biomatters. 2010. Available: http://www.geneious.com.
Duellman WE, Lehr E. Terrestrial breeding frogs in Peru. Münster: Natur und Tier Verlag;
2009.
Elith J, Leathwick JR. Species distribution models: ecological explanation and prediction
across space and time. Annu Rev Ecol Evol Syst. 2009;40: 677–697.
Elith J, Phillips SJ, Hastie T, Dudík M, Chee YE, Yates CJ. A statistical explanation of
MaxEnt for ecologists. Divers Distrib. 2011;17: 43–57.
Elmer KR, Bonnet RM, Wake DB, Lougheed SC. Early Miocene origin and cryptic
diversification of South American salamanders. BMC Evol Biol. 2013;13: 1–16.
Feldman CR, Spicer GS. Comparative phylogeography of woodland reptiles in California:
32
2222.
Fenker J, Tedeschi LG, Pyron RA, Nogueira CC. Phylogenetic diversity, habitat loss and
conservation in South American pitvipers (Crotalinae: Bothrops and Bothrocophias). Diversity Distrib 2014;20: 1108–1119.
Freire-Lascano A. Dos nuevas especies de Bothrops en el Ecuador. Publicaciones de Trabajos Científicos del Ecuador, Universidad Técnica de Machala. 1991;2: 1–11.
García JC, Crawford AJ, Mendoza AM, Ospina O, Cardenas H, Castro F. Comparative
phylogeography of direct-developing frogs (Anura: Craugastoridae; Pristimantis) in the southern Andes of Colombia. PLoS ONE. 2012 Sep 25. doi:
10.1371/journal.pone.0046077.
Ghalambor C, Huey RB, Martin PR, Tewksbury JJ, Wang G. Are mountain passes higher in
the tropics? Janzen’s hypothesis revisited. Int Comp Biol. 2006;46: 5–17.
Guayasamin JM. A new species of Eleutherodactylus (Anura: Leptodactylidae) from the northwestern lowlands of Ecuador. Herpetologica. 2004;60: 103–116.
Guayasamin JM, Krynak T, Krynak K, Culebras J, Hutter CR. Phenotypic plasticity raises
questions for taxonomically important traits: a remarkable new Andean rainfrog
(Pristimantis) with the ability to change skin texture. Zool J Linn Soc. 2015;173: 913– 928.
Hedges SB, Duellman WE, Heinicke MP. New World direct-developing frogs (Anura:
Terrarana): molecular phylogeny, classification, biogeography, and conservation.
Zootaxa. 2008;1737: 1–182.
Heinicke MP, Duellman WE, Hedges SB. Major Caribbean and Central American frog
faunas originated by ancient oceanic dispersal. Proc Natl Acad Sci USA. 2007;104:
10092– 10097.
Hendry CR, Guiher TJ, Pyron RA. Ecological divergence and sexual selection drive sexual
33
760–771.
Hijmans RJ, Cameron SE, Parra JL, Jones PG, Jarvis A. Very high resolution interpolated
climate surfaces for global land areas. Int J Climatol. 2005;25: 1965–1978.
Huey RB. Latitudinal pattern of between-altitude faunal similarity: mountains might be
higher in the tropics. Am Nat. 1978;112: 225–229.
Huey RB, Deutsch CA, Tewksbury JJ, Vitt LJ, Hertz PE, Álvarez HJ, Garland T. Why
tropical forest lizards are vulnerable to climate warming. Proc R Soc B. 2009;276:
1939–1948.
Hutter CR, Guayasamin JM. A new cryptic species of glassfrog (Centrolenidae:
Nymphargus) from Reserva Las Gralarias, Ecuador. Zootaxa. 2012;3257: 1–21.
Hutter CR, Guayasamin JM, Wiens JJ. Explaining Andean megadiversity: the evolutionary
and ecological causes of glassfrog elevational richness patterns. Ecol Lett. 2013; 16:
1135–1144.
Janzen DH. Why mountain passes are higher in the tropics. Am Nat. 1967:101; 233–249.
Jenkins CN, Pimm SL, Joppa LN. Global patterns of terrestrial vertebrate diversity and
conservation. Proc Natl Acad Sci USA. 2013;110: 2602-2610.
Katoh K, DM Standley. MAFFT multiple sequence alignment software version 7:
improvements in performance and usability. Mol Biol Evol. 2013;30: 772–780.
Kessler M, Kluge J. Diversity and endemism in tropical montane forests - from patterns to
processes. In: Gradstein SR, Homeier J, Gansert D, editors. The Tropical mountain
forest: Patterns and processes in a biodiversity hotspot. Göttingen Centre for
Biodiversity and Ecology; 2008. pp. 35–50.
Kocher TD, Thomas WK, Meyer A, Edwards SV, Paabo S, Villablanca FX, Wilson AC.
Dynamics of mitochondrial evolution in animals: amplification and sequencing with
conserved primers. Proc Natl Acad Sci USA. 1989;86: 6196–6200.
34
mechanisms. Proc R Soc B. 2007;274: 2995–3003.
Köhler G, Diethert H-H, Vesely M. A contribution to the knowledge of the lizard genus
Alopoglossus (Squamata: Gymnophthalmidae). Hepetol Monogr. 2012:26; 173–188.
Lanfear R, Calcott B, Ho SY, Guindon S. Partition-Finder: Combined selection of
partitioning schemes and substitution models for phylogenetic analyses. Mol Biol Evol.
2012;29: 1695–1701.
Leaché AD, Crews SC, Hickerson MJ. Two waves of diversification in mammals and reptiles
of Baja California revealed by hierarchical Bayesian analysis. Biol Lett. 2007;3: 646–
650.
Lehr E, Coloma LA. A minute new Ecuadorian Andean frog (Anura: Strabomantidae,
Pristimantis). Herpetologica. 2008;64: 354–367.
Lynch JD. New species of frogs (Leptodactylidae: Eleutherodactylus) from the Pacific versant of Ecuador. Sci Pap Univ Kansas Nat Hist Mus. 1976;55 :1–33.
Lynch JD, Duellman WE. The Eleutherodactylus of the Amazonian slopes of the Ecuadorian Andes (Anura: Leptodactylidae). Miscellaneous Publication, Museum of Natural
History, University of Kansas. 1980;69: 1–86.
Lynch JD, Duellman WE. Frogs of the genus Eleutherodactylus in western Ecuador. Systematics, ecology, and biogeography. Special Publication of the Natural History
Museum, University of Kansas. 1997;23: 1–236.
Lynch JD, Miyata K. Two new species of Eleutherodactylus (Amphibia: Leptodactylidae) from the lowlands and lower cloud forests of western Ecuador. Breviora. 1980;457: 1–
12.
Lynch JD, Ruiz-Carranza PM, Ardila-Robayo MC. The identities of the Colombian frogs
confused with Eleutherodactylus latidiscus (Boulenger) (Amphibia: Anura: Leptodactylidae). Sci Pap Univ Kansas Nat Hist Mus. 1994;170: 1–42.
35 olallai Hoogmoed, 1985 (Anura, Bufonidae), an enigmatic and endangered Andean
toad. Amphib Reptile Conserv. 2014;8: 1–7.
McCain CM Vertebrate range sizes indicate that mountains may be ‘higher’ in the tropics.
Ecol Lett. 2009;12: 550–560.
McDiarmid RW, Campbell JA, Touré TA. Snake species of the world. Washington:
Herpetologists' League; 1999.
Maddison DR, Maddison WP. MacClade. Sunderland: Sinauer Associates. 2005. Available:
http://macclade.org/.
MAE. Línea base de deforestación del Ecuador continental. Quito: Ministerio del Ambiente;
2012.
Mittermeier RA, Turner WR, Larsen FW, Brooks TM, Gascon C. Global biodiversity
conservation: the critical role of hotspots. In: Zachos FE, Hable JC, editors. Biodiversity
hotspots. Heidelberg: Springer. 2011. pp. 3–22.
Vences M, Wake D. Speciation, species boundaries and phylogeography of amphibians. In:
Heatwole H, Tyler M, editors. Amphibian biology, vol. 7. Amphibian systematics.
Chipping Norton: Surrey Beatty and Sons. 2007. pp. 2613–2669.
Miyata K. Annotated checklist and key to the lizards of Centro Científico Río Palenque.
Cambridge: Museum of Comparative Zoology; 1976.
Morales MA. Dinámica poblacional de las comunidades de anfibios y reptiles de siete
localidades de la zona de amortiguamiento de la Reserva Ecológica Cotacachi-Cayapas,
Esmeraldas, Ecuador. Cuenca: Universidad del Azuay; 2004.
Moritz C, Patton JL, Schneider CJ, Smith TB. Diversification of rainforest faunas: an
integrated molecular approach. Ann Rev Ecol Syst. 2000;31: 533–563.
Ortega-Andrade HM, Altamirano M. Aproximación al conocimiento del nicho trófico de una
comunidad de anuros en los bosques de Punta Galeras, suroccidente de la Provincia de
36
Ortega-Andrade HM, Bermingham J, Aulestia C, Paucar C. Herpetofauna of the Bilsa
Biological Station, province of Esmeraldas, Ecuador. Check List. 2010;6: 119–154.
Padial JM, Grant T, Frost DR. Molecular systematics of terraranas (Anura:
Brachycephaloidae) with an assessment of the effects of alignment and optimality
criteria. Zootaxa 2014;3825: 001–132.
Palumbi SR, Martin A, Romano S, McMillan WO, Stice L, Grabowski G. The Simple Fool’s
Guide to PCR, Version 2.0. Honolulu: University of Hawaii; 1991.
Pastorini J, Thalmann U, Martin RD. A molecular approach to comparative phylogeography
of extant Malagasy lemurs. Proc Nat Acad Sci. 2003;100: 5879–5884.
Pellegrino KCM, Rodrigues MT, Yonenaga-Yassuda Y, Sites Jr JW. A molecular perspective
on the evolution of microteiid lizards (Squamata, Gymnophthalmidae) and a new
classification for the family. Biol J Linn Soc Lond. 2011;74: 315–338.
Peracca MG. Viaggio del Dr. Enrico Festa nell Ecuador e regioni vicine. Boll Mus Zool
Comp Anat Univ Torino. 1904;19: 1–41.
Phillips SJ, Anderson RP, Schapire RE. Maximum entropy modeling of species geographic
distributions. Ecol Model. 2006;190: 231–259.
Pinto-Sánchez NR, Ibáñez R, Madriñán S, Sanjur OI, Bermingham E, Crawford AJ. The
Great American Biotic Interchange in frogs: Multiple and early colonization of Central
America by the South American genus Pristimantis (Anura: Craugastoridae). Mol Phylogenet Evol. 2012;62: 954-972.
Price T. Speciation in birds. Greenwood Village: Roberts & Company; 2008.
Pyron RA, Wiens JJ. A large-scale phylogeny of Amphibia with over 2,800 species, and a
revised classification of extant frogs, salamanders, and caecilians. Mol Phylogenet Evol.
2011;61: 543–583.
Pyron RA, Wiens JJ. Large-scale phylogenetic analyses reveal the causes of high tropical
37
Rambaut A, Drummond AJ. Tracer version 1.4.1. 2003. Available: http://beast.bio.ed.ac.uk.
Ree RH, Sanmartín I. Prospects and challenges for parametric models in historical
biogeographical inference. J Biogeogr. 2009;36: 1211–1220.
Ree RH, Smith SA. Maximum likelihood inference of geographic range evolution by
dispersal, local extinction, and cladogenesis. ︎ Syst Biol. 2008;57: 4–14.
Renner IW, Warton DI. Equivalence of MAXENT and poisson point process models for
species distribution modeling in ecology. Biometrics. 2013;69: 274–281.
Reyes A. Inventario de la herpetofauna del Bosque Protector Río Guajalito, un bosque
nublado montano del Occidente de la Provincia de Pichincha, Ecuador. Quito:
Universidad San Francisco de Quito; 2008.
Rivera-Prieto DA, Rivera-Correa M, Daza JM. A new colorful species of Pristimantis
(Anura: Craugastoridae) from the eastern flank of the Cordillera Central in Colombia.
Zootaxa. 2014;3900: 223–242.
Rocha LA, Bass AL, Robertson DR, Bowen BW. Adult habitat preferences, larval dispersal,
and the comparative phylogeography of three Atlantic surgeonfishes (Teleostei:
Acanthuridae). Mol Ecol. 2002;11: 243–252.
Rolland J, Condamine FL, Jiguet F, Morlon H. Faster speciation and reduced extinction in the
tropics contribute to the mammalian latitudinal diversity gradient. PLoS Biol. 2014 Jan
28. doi: 10.1371/journal.pbio.1001775.
Ronquist F, Huelsenbeck JP. MrBayes 3: Bayesian phylogenetic inference under
mixedmodels. Bioinformatics. 2003;19: 1572–1574.
Savit AZ. Reptiles of the Santa Lucía Cloud Forest, Ecuador. Iguana. 2006;13: 94–103.
Schätti B, Kramer E. A new pitviper from Ecuador, Bothriechis mahnerti n. sp. Rev Suisse Zool. 1991;98: 9–14.
38 Porthidium (Serpentes: Viperidae). Rev Suisse Zool. 1993;100: 235–278.
Simon C, Frati F, Beckenbach A, Crespi B, Liu H, Flook P. Evolution, weighting, and
phylogenetic utility of mitochondrial gene sequences and compilation of conserved
polymerase chain reaction primers. Ann Entomol Soc Am. 1994;87: 651–701.
Sierra R. Propuesta preliminar de un sistema de clasificación de vegetación para el Ecuador
continental. Quito: EcoCiencia;1999.
Smith BT, McCormack JE, Cuervo AM, Hickerson MJ, Aleixo A, Cadena CD, et al. The
drivers of tropical speciation. Nature. 2014;515: 406-409.
Swofford DL. Phylogenetic analysis using parsimony and other methods. 2002. Available:
http://paup.csit.fsu.edu.
Torres-Carvajal O, Barnes CW, Pozo-Andrade MJ, Tapia W, Nicholls G. Older than the
islands: origin and diversification of Galápagos leaf-toed geckos (Phyllodactylidae:
Phyllodactylus) by multiple colonizations. J Biogeogr. 2014;41: 1883–1894.
Torres-Carvajal O, Lobos SE. A new species of Alopoglossus lizard (Squamata,
Gymnophthalmidae) from the tropical Andes, with a molecular phylogeny of the genus.
ZooKeys. 2014;410: 105–120.
Torres-Carvajal O, Mafla-Endara P. Evolutionary history of Andean Pholidobolus and
Macropholidus (Squamata: Gymnopthalmidae) lizards. Mol Phylogenet Evol. 2013;68: 212–217.
Valencia JH, Garzón K. Guía de anfibios y reptiles en ambientes cercanos a las estaciones del
OCP. Quito: Fundación Herpetológica Gustavo Orcés; 2011.
Wake DB, Lynch JF. The distribution, ecology, and evolutionary history of plethodontid
salamanders in tropical America. Sci Bull Nat Hist Mus Los Angeles Co. 1976;25: 1–65.
Weir JT, Price M. Andean uplift promotes lowland speciation through vicariance and
dispersal in Dendocincla woodcreepers. Mol Ecol. 2011;20: 4550–4563.
39
of species. Evolution. 2004;58: 193–197.
Wiens JJ, Fetzner JW, Parkinson CL, Reeder TW. Hylid frog phylogeny and sampling
strategies for speciose clades. Syst Biol. 2005;54: 719–748.
Wüster W, Salomão MG, Quijada-Mascareñas JA, Thorpe RS, BBBSP. Origins and
evolution of the South American pitviper fauna: evidence from mitochondrial DNA
sequence analysis. In Schuett GW, Höggren M, Douglas ME, Greene HW, editors.
Biology of the vipers. Eagle Mountain: Eagle Mountain Publishing. 2002. pp 111–128.
Yánez-Muñoz M. Evaluación y caracterización de la herpetofauna del Corredor Awa-Cachi,
Provincia de Esmeraldas. Quito: Fundación Sirua; 2005.
Yánez-Muñoz MH, Bejarano-Muñoz EP. Lista actualizada de ranas terrestres Pristimantis
(Anura: Craugastoridae) en las estribaciones occidentales del Distrito Metropolitano de
Quito, Andes de Ecuador. Boletín Técnico. 2013;11: 125–150.
Yánez-Muñoz MH, Moreno-Cárdenas PA, Mena-Valenzuela P. Guía de Campo de los
Pequeños Vertebrados del Distrito Metropolitano de Quito . Quito: Imprenta Editcar;
2009.
Zink RM. Methods in comparative phylogeography, and their application to studying