PERMANYER
ORIGINAL ARTICLE Rev Invest Clin. 2019;71:186-94
Astemizole, an Inhibitor of
Ether-À-Go-Go-1 Potassium Channel,
Increases the Activity of the Tyrosine
Kinase Inhibitor Gefitinib in
Breast Cancer Cells
Janice García-Quiroz
1‡, María E. González-González
1‡, Lorenza Díaz
1, David Ordaz-Rosado
1,
Mariana Segovia-Mendoza
1,2, Heriberto Prado-García
3, Fernando Larrea
1and Rocío
García-Becerra
1,4*
Departments of 1Reproductive Biology "Dr. Carlos Gual Castro", Instituto Nacional de Ciencias Médicas y Nutrición
Salvador Zubirán, Mexico City; 2Immunology, Instituto de Investigaciones Biomédicas, Universidad Nacional Autónoma
de México, Mexico City; 3Chronic Degenerative Diseases, Instituto Nacional de Enfermedades Respiratorias “Ismael
Cosío Villegas”, Mexico City; and 4Breast Cancer Research Program, Department of Molecular Biology and Biotechnology,
Instituto de Investigaciones Biomédicas, Universidad Nacional Autónoma de México, Mexico City, Mexico.
‡These authors contributed equally to this work.
Received for publication: 01-10-2018 Approved for publication: 28-11-2018 DOI: 10.24875/RIC.18002840
ABSTRACT
Background: Expression and activity of the potassium channel ether-à-go-go-1 (EAG1) are strongly related to carcinogenesis
and tumor progression, which can be exploited for therapeutic purposes. EAG1 activity may be reduced by preventing its phos-phorylation with epidermal growth factor receptor (EGFR) kinase inhibitors and by astemizole, which blocks the channel pore and downregulates its gene expression. Objective: We aimed to study the potential cooperative antiproliferative effect of the
EGFR inhibitor gefitinib and the EAG1-blocker astemizole, in breast cancer cells. Materials and Methods: The cells were
char-acterized by immunocytochemistry. Inhibitory concentrations were determined by non-linear regression analysis using dose-response curves. The nature of the pharmacological effect was evaluated by the combination index equation while cell cycle analysis was studied by flow cy tometry. Results: Astemizole and gefitinib inhibited cell proliferation in a concentration-dependent
manner, with inhibitory concentrations (IC 50) values of 1.72 µM and 0.51 µM, respectively. All combinations resulted in a synergistic antiproliferative effect. The combination of astemizole and gefitinib diminished the percentage of cells in G2/M and S phases, while increased accumulation in G0/G1 of the cell cycle. Conclusions: Astemizole and gefitinib synergistically
inhib-ited proliferation in breast cancer cells expressing both EGFR and EAG1. Our results suggest that the combined treatment in-creased cell death by targeting the oncogenic activity of EAG1. (REV INVEST CLIN. 2019;71:186-94)
Key words: Breast cancer. Combination index. Epidermal growth factor receptor. Astemizole. Gefitinib.
Corresponding author:
*Rocío García-Becerra
Department of Reproductive Biology Dr. Carlos Gual Castro
Instituto Nacional de Ciencias Médicas y Nutrición Salvador Zubirán
Vasco de Quiroga, No. 15
Col. Belisario Domínguez Sección XVI, Del. Tlalpan C.P. 14080, Mexico City, Mexico
INTRODUCTION
Breast cancer is the most frequently diagnosed neo-plasia and a leading cause of cancer death among women1. Understanding the foundation of the
dif-ferential response to treatments based on the mo-lecular signature of the tumor is crucial to stratify patients who may benefit from a targeted therapeutic approach. Among the different phenotypes, the hu-man epidermal growth factor receptor-2 (HER2) pos-itive and the triple-negative breast cancer (TNBC), characterized by the lack of expression of estrogen receptor (ER), progesterone receptor, and HER2, are the most aggressive and clinically challenging tu-mors2. While most of TNBC tumors express the
epi-dermal growth factor receptor 1 (EGFR), the coex-pression of HER2 and EGFR worsens the prognosis, giving rise to poorly differentiated tumors with a high metastatic index2. Indeed, overexpression of EGFR
and/or its ligands is a common trait usually found in multiple cancer types favoring tumor growth, which makes EGFR a useful marker for molecular targeting therapy3,4. Therapeutic agents utilized in the clinic for
EGFR-positive tumors include small-molecule tyrosine kinase inhibitors (TKIs). Gefitinib, a TKI used as a single agent for EGFR-targeted therapy, has shown to be effective mainly in patients with non-small-cell lung carcinoma-bearing EGFR-activating mutations5.
Moreover, this TKI inhibits the growth of both human tumor xenografts and breast cancer cell lines ex-pressing different levels of EGFR or HER26-8. In breast
cancer patients, gefitinib is not currently being con-sidered for therapeutic purposes, mainly due to the low response rates for some types of breast tu-mors9-11. Nevertheless, gefitinib treatment has
re-sulted in a significant difference in the complete pathologic response between non-TNBC and TNBC tumors12, showing promise in treating this latter type
of tumors. Whether tumors will or will not respond to EGFR inhibitors depend on many factors including mu-tations that drive EGFR hyperactivation, rendering the cell “addicted” to EGFR pathway and, therefore, very sensitive to TKI therapy13. On the opposite, cells that
are insensitive to TKIs may depend on other pathways to survive. Interestingly, one common pathway that drives breast cancer cells proliferation independently of the expression of common molecular markers is the one initiated by the oncogenic potassium channel ether-à-go-go 1 ([EAG1], Kv10.1, KCNH1)14-17. EAG1
channels are responsible for the potential membrane
hyperpolarization that induces human breast cancer cell progression into the G1 phase of the cell cycle, resulting in cell proliferation16,18. Accordingly, reducing
these currents with EAG1 blockers or downregulating EAG1 expression inhibited cell proliferation, an effect that has been observed in ER-positive, HER2-positive, and TNBC cells19-22. In general, EAG1 overexpression
is a hallmark of cancer23-25, particularly in breast
tu-mors (95% abundance, independently of the molecu-lar signature)25. Given that, EAG1 is implicated in
carcinogenesis and is a surface-expressed protein; it has been extensively studied as an oncological target due to its accessibility by extracellular pharmacologi-cal tools such as astemizole24-26.
Astemizole, a non-sedating second-generation H1 -histamine receptor antagonist, has shown a signifi-cant association with reduced mortality among can-cer patients, especially if a concurrent chemotherapy is used27. The latter may be explained by the following
facts: (1) astemizole inhibits EAG1 currents by bind-ing to open channels from inside the cells28; (2) it
reduces EAG1 gene expression in breast cancer19,20;
(3) the blockade of histamine H1 receptors by
aste-mizole decreases histamine-dependent growth of cancer cells26; (4) astemizole enhances both
lyso-somal- and caspase-dependent cell death pathways27;
and (5) astemizole sensitizes breast cancer cells to chemotherapy while reverts multidrug resistance27.
On the other hand, protein tyrosine kinases, particu-larly EGFR kinase, stimulate EAG1 channel activity by phosphorylating the tyrosine residues Tyr90, Tyr344, and Tyr48529. Therefore, TKIs are expected to
shut-down EAG1, as shown in HEK293 cells transfected with EAG1 and treated with AG556, a compound that selec-tively inhibits EGFR autophosphorylation29. Indeed, EGFR
blocking, at the level of activity and/or expression, sig-nificantly reduced EAG1 currents29. Consequently, the
MATERIALS AND METHODS
Cell culture
The breast cancer cell line BT-474 was purchased from American Type Culture Collection (ATCC) and maintained in Hybri-Care medium (ATCC) supple-mented with 1.5 g/L sodium bicarbonate, 100 units/ mL penicillin plus 100 µg/mL streptomycin, and heat-inactivated FBS (all from Invitrogen Life Technologies, NY, USA) to a final concentration of 10% in humidified atmosphere with 5% CO2 at 37°C. All experimental procedures were performed in supplemented Hybri-Care medium conditioned with 5% charcoal-stripped-heat-inactivated FBS.
Characterization of cells
by immunocytochemistry
Cells were grown on Lab-Tek Chamber Slides (Thermo Scientific) and fixed in 96% ethanol. Antigen retrieval was achieved by autoclaving in immuno/DNA retriev-er with EDTA solution (BioSB, CA, USA) during 5 min. Slides were blocked with ImmunoDetector peroxidase blocker (BioSB) for 5 min and further incubated during 2 h with anti-EAG1 (1:300, Novus Biologicals, CO, USA) or 1 hour with EGFR (1:250, BioSB), anti-ERα (1:250, BioSB), or anti-HER2 (1:100, Cell Signal-ing Technology, MA, USA) antibodies. Slides were sequentially incubated with ImmunoDetector Biotin-Link and ImmunoDetector HRP label (BioSB) during 10 min each, washed with Tris-buffered saline, stained with diaminobenzidine, and counterstained with he-matoxylin.
Cell proliferation and drug
combination studies
Cells were seeded in 96-well plates at a density of 1000 cells per well. After 24 h, cells were incubated in the presence of different concentrations of astem-izole (Sigma, St. Louis, MO, USA), gefitinib (kindly provided by AstraZeneca, Mexico City, Mexico), or the vehicle alone (dimethyl sulfoxide, DMSO) during 6 days. Cell proliferation was studied using the colo-rimetric XTT assay (Roche Applied Sciences, IN, USA) following the manufacturer’s instructions. Absorbance was determined at 492 nm in a Multiskan spectro-photometer (Labsystems Inc., Canada). Furthermore,
cell density was determined using the protein-binding dye SRB30. The concentrations that caused 20% and
50% cell proliferation inhibition (inhibitory concentra-tions [IC]20 and IC50, respectively) were calculated by non-linear regression analysis using sigmoidal fitting from the sigmoidal dose-response curve by means of the scientific graphing software Origin (OriginLab Corporation, Northampton, MA). Subsequently, using the IC20 and IC50 of astemizole and gefitinib, we stud-ied the effect of the drug combination to determine a possible synergism on cell proliferation. Then, com-bination index (CI) values were determined applying CI equation31. For this analysis, an additive effect,
synergism, or antagonism were defined as CI values = 1.0, < 1.0, and > 1.0, respectively, as previously reported31.
Cell cycle distribution
BT-474 cells were incubated in the absence or pres-ence of the respective IC50 values of astemizole or gefitinib alone or combined during 96 h. After treat-ment, the cells were collected, washed with phos-phate buffer pH 7.2, and fixed in 70 % ethanol v/v. Then, the samples were washed and incubated in RNAse (10 µg/ml), 0.1 % v/v Triton X-100, and 7-aminoactinomycin D (7-AAD) (BioLegend, San Di-ego, CA) (50 µg/ml) solution in the dark at room temperature for 20 min. The DNA content was deter-mined using a FACSCanto II flow cytometer (Becton Dickinson, San Jose, CA, USA). For cell cycle analysis, a total of 30,000 events from 7-AAD area versus 7-AAD wide gate were acquired. Results were ana-lyzed using FlowJo software (LLC, Ashland, OR, USA).
Statistical analysis
Statistical differences were determined by one-way ANOVA followed by post hoc test Holm-Sidak for pair-wise comparisons (SigmaStat 3.5, Jandel Scientific). Differences were considered statistically significant at p < 0.05.
RESULTS
Cell characterization
targets of astemizole and gefitinib. BT-474 cells showed positive immunostaining for EAG1, HER2, and EGFR, which suggest sensitivity to astemizole and ge-fitinib. In addition, we confirmed ERα presence in BT-474 cells (Fig. 1).
Antiproliferative effects
of astemizole and gefitinib
To test the functionality of EAG1/HER2/EGFR-target-ed treatment, BT-474 cells were incubatEAG1/HER2/EGFR-target-ed in the pres-ence of increasing concentrations of astemizole or gefitinib. A concentration-dependent antiproliferative
effect of both compounds was observed (Fig. 2), in-dicating that these cells greatly depended on EAG1/ HER2/EGFR signaling pathways to grow. Based on the range of concentrations tested, we calculated the IC20 and IC50 values for the experimental compounds (Table 1).
Drug combination effects
on cell proliferation
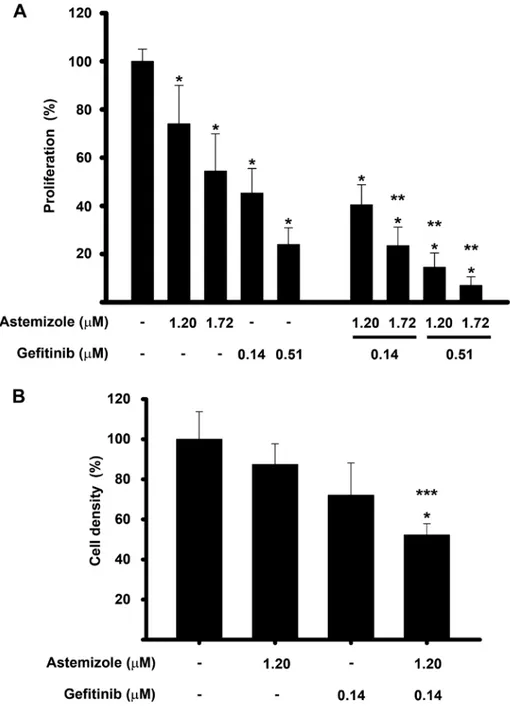
To analyze the potential synergistic antiproliferative effect of astemizole and gefitinib, drug combination studies were carried out using their corresponding IC20 and IC50 values. Results showed that cell prolif-eration was inhibited in a greater extent when com-bining the drugs, as compared against each compound alone. Statistical significance was reached using gefi-tinib at IC20 with astemizole at IC50 and gefitinib at IC50 in combination with astemizole at both concen-trations tested, reaching approximately 80-90% cell growth inhibition (Fig. 3A). Furthermore, cell density was significantly reduced by the combined treatment compared with non-treated cells (Fig. 3B).
Figure 1. Immunocharacterization of breast cancer cells. BT-474 cells showed strong immunoreactivity (brown staining) for estrogen receptor α (ER), ether-à-go-go-1 (EAG1), epidermal growth factor receptor 1 (EGFR), and epidermal growth factor receptor 2 (HER2). Negative control is shown in the inset and was carried out in the absence of primary antibody. Representative images are shown.
Table 1. IC values for astemizole and gefitinib.
IC Astemizole
(µM) Gefitinib (µM)
20 1.20 0.14 50 1.72 0.51
To determine the pharmacological effect that result-ed from the drug combinations, CI equation was used31. A graphic of the fraction affected of cells
ver-sus CI value for the drug combination is shown in figure 4. All the combination schemes resulted in CI < 1, which reflect synergism in every case. Accordingly, as the concentrations of astemizole and gefitinib in-creased, the values depicting CI ranged from 0.75 to 0.26, indicating moderate to strong synergism, re-spectively.
Astemizole combined with gefitinib
diminished the percentage of cells
in G2/M-phase
To determine whether the combined treatment modified the cell cycle distribution of BT-474 cells, flow cytometric analysis using a fluorescent marker for DNA was performed. Figure 5 shows the cell cycle profile after treating the cells with astemizole or gefitinib at their corresponding IC50 values, alone or combined during 96 hours. As depicted, astem-izole and gefitinib per se reduced the percentage of cells in G2/M phase compared to untreated cells. The combination of both drugs further reduced this value, achieving statistical significance when com-pared with both vehicle- and astemizole-treated
cells. Accordingly, the percentage of cells arrested in G0/G1 increased, while the S phase diminished in the combined treatment when compared to vehicle-treat-ed cells. These observations are consistent with more cells exiting the cell cycle after being exposed to the combined treatment. The S phase was not modified.
DISCUSSION
Recently, the use of antihistamines for cancer ther-apy has gained interest due to their efficacy, safety, and low cost27. In this study, we tested the
com-monly prescribed antihistamine astemizole with the EGFR-blocker gefitinib, and we show for the first time that this combination had a synergistic effect on growth inhibition of cultured breast cancer cells. The synergistic interaction observed between these two compounds might be due to several mechanisms including the dual target of EAG1, both at the level of activity and expression, and the concomitant blocking of EGFR signaling. Indeed, the rationale to use astemizole and gefitinib in combination was based on preclinical data showing that TKIs abate the ability of EGFR to phosphorylate EAG1, while astemizole inhibits both EAG1 activity and expres-sion, resulting in decreased cell proliferation and
tumor progression16,19,20,29. The combination of
gefi-tinib and astemizole has previously been tested in hu-man lung cancer cell lines, showing, in a similar hu-manner to our results, that the drug combination at their IC20
had a superior effect in reducing cell proliferation and
survival while increased apoptosis in comparison to each compound alone32.
It is worth mentioning that some TKIs have been shown to inhibit members of the cytochrome P450
family (CYPs), which should be considered when com-bining TKIs with drugs that are CYPs substrates, due to the possibility of increased drug toxicity or reduced pharmacological effects33. In this regard, astemizole,
used in this study, is catabolized by CYP3A4, a cyto-chrome that also plays a role in gefitinib metabolism. Previous reports demonstrated that gefitinib inhibits CYP3A4 activity in almost 20%33; therefore, we
hy-pothesize that lower concentrations of astemizole will result in a greater effect in vivo when combined with gefitinib, in a similar manner as seen in this in vitro study.
Of note, herein, we showed that the calculated IC20 and IC50 of gefitinib in BT-474 cells are in the range of clinically achievable concentrations. As a reference, the steady-state plasma concentrations of gefitinib observed in cancer patients receiving 225-300 mg/ day of TKI ranged between 0.35 µM and 0.53 µM, with clinically meaningful disease stabilization in a range of different tumor types34,35. In our study, IC
20
and IC50 values of gefitinib were 0.14 and 0.51 µM,
Figure 4. Combination index (CI) values and fraction affect-ed from different schemes of drug combinations. The BT-474 cells were co-incubated at the corresponding inhibitory concentrations (IC)IC20-IC20 (), IC50-IC20 (), IC20-IC50 () and IC50-IC50 (Δ) values of astemizole and gefitinib, respec-tively. CI value of 1 indicates additive effect (denoted by the horizontal line) and the values below this line mean syner-gistic effect. All the combination schemes showed synergism at different intensities.
respectively. Therefore, it might be possible to lower the dose of gefitinib to patients by the concomitant administration with astemizole, which may result in benefit to reduce undesirable side effects of TKI. In the case of astemizole, reported therapeutic and toxic serum levels are 0.05 µg/mL (0.10 µM) and 14 µg/mL (30.5 µM), respectively36; therefore, the IC
20
and IC50 values calculated in this study are higher than the therapeutic values but significantly lower than those associated with toxicity. Nevertheless, it should be noted that astemizole therapeutic levels have been calculated when prescribed as an antihis-tamine, not as an anticancer agent, which remains to be determined in future studies and are expected to be higher. In this regard, this study suggests that under in vivo conditions, astemizole might be used at lower doses when combined with gefitinib, due to the synergy that results from the interaction of these drugs and the gefitinib-dependent inhibition of CYP3A4.
Our results showing that the combination of gefitinib and astemizole synergistically inhibited cell prolifera-tion while significantly reduced the G2/M and in-creased the G0/G1 phases of the cell cycle, allow us to suggest that the combination of the drugs can modify the cell cycle profile in breast cancer cells favoring cell death. This assumption is supported by previous reports showing that astemizole and gefi-tinib alone can inhibit cyclin D1 and E expression and provoke cell cycle arrest in G0/G1 and/or cell death in breast cancer14,37. Given the strong dependence of
EAG1 proliferative potential on EGFR expression and activity, we believe that the drug combination studied herein might be a good therapeutic option for pa-tients bearing tumors coexpressing HER2/EGFR/ EAG1, regardless of the presence of ER, and irrespec-tive of the tumor dependence on estrogens to sur-vive. Moreover, since EAG1 may also be upregulated by estrogens, as previously shown in cervical cancer cells38, the combination of astemizole/gefitinib
rep-resents a good option to further abate estrogen-dependent EAG1-induced cell proliferation.
In summary, the results of the present study suggest that strategies involving the dual blockade of EAG1 may significantly improve the benefits of standard chemotherapy regimens, including tyrosine kinases inhibition, in patients affected with breast cancer.
ACKNOWLEDGMENTS
This study was funded by the Consejo Nacional de Ciencia y Tecnología (CONACyT, México) grant num-ber 256994 to RG, and by the Instituto Científico Pfizer (grant INCMN/110/08/PI/86/15 to RGB). Mariana Segovia Martínez is grateful for the post-doctoral fellowship received from the Fundación para la Salud y la Educación Dr. Salvador Zubirán (Grant P-318).
REFERENCES
1. Jemal A, Bray F, Center MM, et al. Global cancer statistics. CA Cancer J Clin. 2011;61:69-90.
2. Reis-Filho JS, Tutt AN. Triple negative tumours: a critical review. Histopathology. 2008;52:108-18.
3. Zhang M, Zhang X, Zhao S, et al. Prognostic value of survivin and EGFR protein expression in triple-negative breast cancer (TNBC) patients. Target Oncol. 2014;9:349-57.
4. Nicholson RI, Gee JM, Harper ME. EGFR and cancer prognosis. Eur J Cancer. 2001;37 Suppl 4:S9-15.
5. Yang CH, Yu CJ, Shih JY, et al. Specific EGFR mutations predict treatment outcome of stage IIIB/IV patients with chemothera-py-naive non-small-cell lung cancer receiving first-line gefitinib monotherapy. J Clin Oncol. 2008;26:2745-53.
6. Moulder SL, Yakes FM, Muthuswamy SK, et al. Epidermal growth factor receptor (HER1) tyrosine kinase inhibitor ZD1839 (Ires-sa) inhibits HER2/neu (erbB2)-overexpressing breast cancer cells in vitro and in vivo. Cancer Res. 2001;61:8887-95. 7. Anido J, Matar P, Albanell J, et al. ZD1839, a specific epidermal
growth factor receptor (EGFR) tyrosine kinase inhibitor, induces the formation of inactive EGFR/HER2 and EGFR/HER3 heterodi-mers and prevents heregulin signaling in HER2-overexpressing breast cancer cells. Clin Cancer Res. 2003;9:1274-83. 8. Campiglio M, Locatelli A, Olgiati C, et al. Inhibition of
prolifera-tion and inducprolifera-tion of apoptosis in breast cancer cells by the epidermal growth factor receptor (EGFR) tyrosine kinase in-hibitor ZD1839 (‘iressa’) is independent of EGFR expression level. J Cell Physiol. 2004;198:259-68.
9. Baselga J, Albanell J, Ruiz A, et al. Phase II and tumor pharma-codynamic study of gefitinib in patients with advanced breast cancer. J Clin Oncol. 2005;23:5323-33.
10. von Minckwitz G, Jonat W, Fasching P, et al. A multicentre phase II study on gefitinib in taxane-and anthracycline-pretreated met-astatic breast cancer. Breast Cancer Res Treat. 2005;89:165-72. 11. Dickler MN, Cobleigh MA, Miller KD, Klein PM, Winer EP. Effi-cacy and safety of erlotinib in patients with locally advanced or metastatic breast cancer. Breast Cancer Res Treat. 2009; 115:115-21.
12. Bernsdorf M, Ingvar C, Jörgensen L, et al. Effect of adding gefi-tinib to neoadjuvant chemotherapy in estrogen receptor nega-tive early breast cancer in a randomized phase II trial. Breast Cancer Res Treat. 2011;126:463-70.
13. Hopper-Borge EA, Nasto RE, Ratushny V, et al. Mechanisms of tumor resistance to EGFR-targeted therapies. Expert Opin Ther Targets. 2009;13:339-62.
14. Borowiec AS, Hague F, Gouilleux-Gruart V, Lassoued K, Ouadid-Ahidouch H. Regulation of IGF-1-dependent cyclin D1 and E expression by hEag1 channels in MCF-7 cells: the critical role of hEag1 channels in G1 phase progression. Biochim Biophys Acta. 2011;1813:723-30.
15. Ouadid-Ahidouch H, Roudbaraki M, Delcourt P, et al. Functional and molecular identification of intermediate-conductance ca(2+)-activated K(+) channels in breast cancer cells: associa-tion with cell cycle progression. Am J Physiol Cell Physiol. 2004;287:C125-34.
17. Ouadid-Ahidouch H, Chaussade F, Roudbaraki M, et al. KV1.1 K(+) channels identification in human breast carcinoma cells: involvement in cell proliferation. Biochem Biophys Res Commun. 2000;278:272-7.
18. Wonderlin WF, Strobl JS. Potassium channels, proliferation and G1 progression. J Membr Biol. 1996;154:91-107.
19. García-Becerra R, Díaz L, Camacho J, et al. Calcitriol inhibits ether-à go-go potassium channel expression and cell proliferation in human breast cancer cells. Exp Cell Res. 2010;316:433-42. 20. García-Quiroz J, García-Becerra R, Barrera D, et al. Astemizole
synergizes calcitriol antiproliferative activity by inhibiting CY-P24A1 and upregulating VDR: a novel approach for breast can-cer therapy. PLoS One. 2012;7:e45063.
21. García-Quiroz J, García-Becerra R, Santos-Martínez N, et al. In vivo dual targeting of the oncogenic ether-à-go-go-1 potassium
channel by calcitriol and astemizole results in enhanced antineo-plastic effects in breast tumors. BMC Cancer. 2014;14:745. 22. Ouadid-Ahidouch H, Ahidouch A. K+ channel expression in
hu-man breast cancer cells: involvement in cell cycle regulation and carcinogenesis. J Membr Biol. 2008;221:1-6.
23. Pardo LA, Stühmer W. Eag1: an emerging oncological target. Cancer Res. 2008;68:1611-3.
24. Camacho J. Ether à go-go potassium channels and cancer. Can-cer Lett. 2006;233:1-9.
25. Hemmerlein B, Weseloh RM, Mello de Queiroz F, et al. Overex-pression of eag1 potassium channels in clinical tumours. Mol Cancer. 2006;5:41.
26. García-Quiroz J, Camacho J. Astemizole: an old anti-histamine as a new promising anti-cancer drug. Anticancer Agents Med Chem. 2011;11:307-14.
27. Ellegaard AM, Dehlendorff C, Vind AC, et al. Repurposing cat-ionic amphiphilic antihistamines for cancer treatment. EBioMed-icine. 2016;9:130-9.
28. García-Ferreiro RE, Kerschensteiner D, Major F, et al. Mechanism of block of hEag1 K+ channels by imipramine and astemizole. J Gen Physiol. 2004;124:301-17.
29. Wu W, Dong MQ, Wu XG, et al. Human ether-à-go-go gene potassium channels are regulated by EGFR tyrosine kinase. Bio-chim Biophys Acta. 2012;1823:282-9.
30. Vichai V, Kirtikara K. Sulforhodamine B colorimetric assay for cytotoxicity screening. Nat Protoc. 2006;1:1112-6.
31. Chou TC. Drug combination studies and their synergy quantifica-tion using the chou-talalay method. Cancer Res. 2010;70:440-6. 32. Chávez-López MG, Zúñiga-García V, Hernández-Gallegos E, et
al. The combination astemizole-gefitinib as a potential therapy for human lung cancer. Onco Targets Ther. 2017;10:5795-803. 33. Wang ZX, Sun J, Howell CE, et al. Prediction of the likelihood of
drug interactions with kinase inhibitors based on in vitro and computational studies. Fundam Clin Pharmacol. 2014;28:551-82. 34. Baselga J, Rischin D, Ranson M, et al. Phase I safety, pharmaco-kinetic, and pharmacodynamic trial of ZD1839, a selective oral epidermal growth factor receptor tyrosine kinase inhibitor, in patients with five selected solid tumor types. J Clin Oncol. 2002;20:4292-302.
35. Costa DB, Kobayashi S, Yeo WL, Hamada A. Serum concentra-tions of erlotinib at a dose of 25 mg daily. J Thorac Oncol. 2010;5:1311-2.
36. Schulz M, Schmoldt A. Therapeutic and toxic blood concentra-tions of more than 800 drugs and other xenobiotics. Pharmaz-ie. 2003;58:447-74.
37. Krol J, Francis RE, Albergaria A, et al. The transcription factor FOXO3a is a crucial cellular target of gefitinib (Iressa) in breast cancer cells. Mol Cancer Ther. 2007;6:3169-79.