Espinoza R, Hernández-Avila M, Narciso J, Castañaga C, Moscoso S, Ortiz G, Carbajal L, Wegner S, Noonan G. Determinants of blood-lead levels in children in Callao and Lima metropolitan area. Salud Publica Mex 2003;45 supl 2:S209-S219.
The English version of this paper is available too at: http://www.insp.mx/salud/index.html
Abstract
Objectives. To determine blood lead levels in urban
popu-lations of children (n=2 510) and women (n=874) in the early postpartum in certain districts of Lima and Callao, and to correlate those levels with particular exposures.
Mate-rial and Methods. Between July 1998 and January 1999
cross sectional study was conducted. The study population was selected using three sampling strategies in the govern-ment operated school system and from public pediatric and maternity hospitals at Lima and Callao, Peru. Study person-nel were trained to collect finger stick blood samples with a protocol that minimizes external lead contamination. Lead determinations in blood and environmental samples were performed at the study site using portable anodic striping voltamenters. To determine the simultaneous effects of different predictors on blood lead levels, multivariate re-gression models were used to estimate adjusted mean dif-ferences. Results. The mean blood lead level in the children studied was 9.9 µg/dl ranging from I µg/dl to 64 µg/dl with 29% of the children displaying values greater than 10 µg/dl and 9.4% at levels greater than 20 µg/dl. Among the women, the mean was 3.5 µg/dl (SD=2.4 µg/dl), and 2.4% (n=21)
Espinoza R, Hernández-Avila M, Narciso J, Castañaga C, Moscoso S, Ortiz G, Carbajal L, Wegner S, Noonan G.
Determinación de los niveles de plomo en sangre de niños de El Callao y del área metropolitana de Lima.
Salud Publica Mex 2003;45 supl 2:S209-S219.
El texto completo en inglés de este artículo también está disponible en: http://www.insp.mx/salud/index.html
Resumen
Objetivos. Determinar los niveles de plomo en sangre en
una muestra compuesta por niños y mujeres en el posparto temprano, residentes en Lima y El Callao. Investigar los determinantes de estos niveles y algunas fuentes de expo-sición. Material y métodos. Entre julio de 1998 y enero de 1999 se llevó a cabo una encuesta en el área metropoli-tana de Lima y en El Callao, Perú. La población de estudio fue identificada mediante tres estrategias de muestreo y con la cual se seleccionaron escuelas públicas y hospitales pe-diátricos y gineco-obstétricos. El personal que participó en el estudio recibió entrenamiento para la técnica de punción digital y puso especial énfasis en controlar la contamina-ción externa con plomo. Las determinaciones del metal en sangre y muestras ambientales se llevaron a cabo utilizando voltametría anódica. Para determinar los efectos simultá-neos de diferentes predictores sobre los niveles de plomo en sangre se usaron modelos de regresión multivariada para estimar diferencias de media y ajustadas.
Resulta-dos. Los niveles promedio de plomo en sangre fueron de
9.9 µg/dl de una variación entre 0 y 64 µg/dl. El 29 y 9.4% de los niños presentaron valores por encima de 10
Determinants of blood-lead levels
in children in Callao
and Lima metropolitan area
Rocío Espinoza, MD,(1) Mauricio Hernández-Avila, MD, MPh, ScD,(2) Juan Narciso, Eng,(1) Carmen Castañaga, MD,(1)
Shirley Moscoso, Biól,(1) Georgina Ortiz, MD,(1) Luz Carbajal, MD,(3) Steve Wegner, MD,(4) Gary Noonan, Eng.(5)
Supported by funding from the United States Agency for International Development (USAID), Peru Mission, Environmental Strategic Objective Team, Lima, Peru.
(1) Dirección General de Salud Ambiental. Dirección de Salud Ocupacional. Lima, Perú.
(2) Centro de Investigación en Salud Poblacional, Instituto Nacional de Salud Pública, Cuernavaca, Morelos, México. (3) Departamento de Estadística, Universidad Peruana Cayetano Heredia, Lima, Perú.
(4) North Carolina Access Care, North Carolina, US
(5) National Centers for Enviromental Health, Center for Disease Control and Prevention.
Received on: May 15, 2003 • Acepted on: September 22, 2003
Address reprint requests to: Dr. Mauricio Hemández Avila, Instituto Nacional de Salud Pública, Avenida Universidad 655, colonia Santa María Ahuacatitlán 62508, Cuernavaca, Morelos, México.
A
ir pollution is an emerging public health problemin Peru that affects more than eight million indi-viduals living in different urban areas of the country. In Peru, significant amounts of lead can still be found in gasoline (0.75 grams per liter), but the public health impact of this exposure has not been documented. The growing evidence for a direct link between low-level lead exposure and deficits in the neurobehavioral-cog-nitive performance evidenced in childhood through adolescence has led to a worldwide initiative to re-duce the lead content of gasoline.l Following thisini-tiative the Peruvian government has committed itself to the reduction and elimination of the use of lead in gasoline. In this paper we report the results of a large cross-sectional study that was designed to determine the current levels of exposure to lead, in order to de-fine potential sources of lead and to provide the base-line blood lead concentrations necessary to monitor changes associated with the phasing –out of leaded gas-oline.
Material and Methods
The study was carried out between July 1998 and Jan-uary 1999, and included populations from Metropoli-tan Lima and Callao, the port area nearby (see Figure
I). The sample studied consisted of 2 510 children be-tween 6 months and 11 years of age and 874 women in the early postpartum. The study population was se-lected using three sampling strategies: 1) Children aged 3 to 11 years were recruited through the government operated school system. For this purpose 15 schools were selected at random reflecting different districts in Lima and Callao with different vehicular traffic in-tensity and of medium to low socio-economic level (n=1 539). 2) Children from 1 to 35 months of age (n=971) were recruited at random from five public hospitals and one primary health center in Callao among chil-dren who attended for a healthy child visit during the study period. 3) Women in the immediate postpartum were selected at random using a systematic sampling of women delivering in five Government Operated Ma-ternity Hospitals. This group was selected to estimate blood lead levels at birth, because the blood lead lev-els of women have been highly correlated with the blood lead levels of their developing fetuses and new-born infants.2-4 All participants and parents of the
chil-dren were recruited at schools or pediatric service locations, provided written consent and answered a short questionnaire regarding potential sources of lead exposure that included: habits of the children (chew-ing and suck(chew-ing pencils, eat(chew-ing soil, bit(chew-ing and eat(chew-ing
displayed levels greater than 10 µg/dl. Important differences were observed between the sample locations, and the high-est levels were documented in the port region near Callao. The mean level of blood lead in this group was 25.6 µg/dl (SD=4.6 µg/dl), while among the rest of the sample it was 7.1 µg/dl (SD=5.1 µg/dl). The presence of a mineral storage area signified a difference in exposure in excess of 13 µg/dl for children living near the port area in contrast to the oth-er children who woth-ere not as close to such fixed sources of lead exposure. For the participants in Lima, the risk of show-ing levels above 10 µg/dl was associated with exposure to high vehicular traffic. Conclusions. In metropolitan Lima, we conclude that the mean blood lead levels of the popula-tions studied were not alarming and that a positive health impact can be made by a reduction of lead in gasoline. With regard to the port area, the study demonstrates that the presence of mineral storage areas pose a detrimental risk factor for the health of the children living in this area. The English version of this paper is available too at: http:// www.insp.mx/salud/index.html
Key words: blood lead; child; environment; Peru
µg/dl y 20 µg/dl,respectivamente. Para las mujeres el pro-medio de plomo en sangre fue de 3.5 µg/dl (DE=2.4) y 2.4% (n=2l) presentaron niveles superiores a 10 µg/dl. Se obser-varon diferencias importantes en relación con el sitio de residencia; los niveles más altos se documentaron en la zona de El Callao. Para este grupo la media de plomo en sangre fue de 25.6 µg/dl (DE=4.6) mientras que para el resto de la muestra el promedio de plomo en sangre fue de 7.1 µg/dl (DE=5.l). En esta zona se detectó un área de almacenamiento de minerales como una fuente importante de exposición. Los niños que viven cerca de esta área tenían en promedio un exceso de 13 µg/dl en sangre. Para los participantes de la zona de Lima el riesgo de presentar niveles por encima de 10 µg/dl se asoció con la exposición a tráfico vehicular.
Conclusiones. Para Lima Metropolitana se puede concluir
que los niveles de plomo en sangre no representan un pro-blema urgente, sin embargo, el reducir el plomo de la gaso-lina se acompaña de un beneficio importante. En contraste, para el área cercana al puerto de El Callao, nuestro estudio demuestra la presencia de sitios de almacenamiento de mi-nerales que representan un riesgo importante para la salud de los niños que viven en esta zona. El texto completo en inglés de este artículo también está disponible en: http:// www.insp.mx/salud/index.html
fingernails), personal hygiene (number of hand wash-ings), environmental exposure (time in outdoor envi-ronments and type of transportation used to go to school), place of residence in relation to vehicular traf-fic intensity and other potential sources of exposure to lead, types of water utilized, habits in the preparation of food for the children, and the occupation of parents, husbands, or other household members.
Blood samples
Study personnel were trained in the processes of hand washing and the collection of finger stick blood sam-ples according to a protocol that minimized the poten-tial for lead contamination. Hand washing of the participants was performed and supervised by study personnel. The fingers were meticulously washed, and after drying them participants were asked to place their hands in a prayer-like manner to avoid contamination. A small sample of blood, 50 µl, was obtained by punc-turing the ring finger. The blood sample was placed in capillary tubes with heparin. Portable anodic
voltam-etry was used to determine blood lead levels. The sen-sitivity of the instrument used is adequate for blood lead levels between 1.4 and 65 µg/dl, it requires nei-ther manual calibration nor refrigeration, and provides blood lead levels in a few minutes.5-7 All participants
(or their parents in the case of the children) received information and counseling regarding their blood lead levels and, if necesary, written information indi-cating how to reduce their exposure to lead. When the blood lead level was higher than 20 µg/dl, study per-sonnel collected an additional venous sample with heparin (3 to 5 ml) and these blood lead levels were analyzed by atomic absorption. 8 Th quality control to
analyze blood lead levels by atomic absorption was done in collaboration with the Center for Disease
Con-trol9 whereby control samples with known values of
lead were sent to the laboratory in Lima.
Environmental samples
In the initial phase of the study it became apparent that children living in a poor neighborhood of Callao had
abnormally high blood lead levels (mean 25.7 µg/dl). In order to investigate potential sources of exposure for this population, study personnel visited the area and identified large open areas where considerable quantities of mineral concentrate was stored. The stor-age sites covered an estimated area of 147 000 m2 in
the vicinity of the port in Callao. These facilities pro-vide temporary storage for metals, metal concentrates and other mining products before they are exported by ship. To assess the potential contribution of these areas as sources of lead exposure, we collected soil sam-ples from the interior of the source point and at dif-ferent distances (300 m, 600 m, 900 m and 1 200 m), following an enlarging circumference pattern around the point source. The samples of soil were obtained from surface soil, not exceeding a depth of 2 cm
ac-cording to the recommendations of the CDC10-12 A
limited number of water samples were also collected. Lead determination of the environmental samples was performed using ultrasonic extraction. Weighed quantities of paint and soil, as well as towelettes that were used to sample for dust, were placed into 50 ml polypropylene centrifuge tubes. Instrument-grade nitric acid 17.5% (25% by Environmental Protection Agency (EPA) method) was introduced into each cen-trifuge tube with a mechanical pipet (15 ml for dust samples and 5 ml for soil samples) and the tubes were capped. Samples were then placed in an ultrasonic bath, subjected to ultrasonic energy for 30 minutes, cooled to room temperature, and allowed to settle be-fore final dilution to 50 ml with distilled water. We used a battery powered 400-g portable anodic stripping vol-tameter (ASV) with disposable electrodes for analyses of soil and dust. Five milliliter aliquots of extracted and diluted sample were placed in 5 ml polypropylene sam-ple vials. An electrolyte pill was introduced to each aliquot and crushed with a plastic stirring rod, the aliquot was shaken to ensure complete dissolution of the electrolyte. ASV determination of lead in water was similar except that a different electrolyte pill was used.10,11
Statistical analysis
Univariate and bivariate statistics, tabulations, and distribution plots were examined for all variables. Place of residency (Lima versus Callao) was identified as an important determinant of blood lead levels and we therefore performed the analyses for the total sample as well as for Lima and Callao as separate strata.
To determine the simultaneous effects of different predictors on blood lead levels, multivariate regression models were used to estimate adjusted mean
differ-ences. To assess the impact of different variables in terms of the risk of having high blood lead levels, blood lead level was modeled using logistic regression where the dependent variable was categorized as 1 for subjects with values greater than 10 µg/dl and 0 for those with values less than or equal to 10 µg/dl. In this phase of the analysis we estimated odds ratios to assess the association between blood lead and other variables using multivariate logistic regression.
Results
Child PopulationDuring the study period 2510 children with a mean age of 4.5 years (range 6 months to 11 years) were re-cruited (Figure 1). The mean blood lead level for the study population was 9.9 µg/dl (range 1 µg/dl to 64
µg/dl). Twenty-nine percent of the children had blood lead levels higher than 10 µg/dl and 9.4% had blood lead levels over 20 µg/dl.
Blood lead levels varied significantly by place of residency. The observed blood lead levels were 7.1
µg/dl (SD= 5.1) and 9.6 µg/dl (SD=6.2) for Lima and Callao, respectively. Variation in blood lead levels in Callao became even more apparent when we stratified the population according to the selected schools (Ta-ble I). Two schools and a primary health center in Puer-to Nuevo, a small poor neighborhood located in Callao, were situated close to a large area used for the tempo-rary storage of mineral concentrates. The mean of blood lead levels in these schools and the health center were 40.7 µg/dl, 15.8 µg/dl and 26.6 µg/dl, respectively.
The analysis of the results of the environmental soil samples (46 samples) demonstrated an inverse correlation between lead in soil and distance from the mineral storage areas. When the distance was 300 m the lead levels were between 900 and 2859 g/g as com-pared to a distance of between 901m to 1 200 m where the lead level decreased to 214 g/g. (Figure 2).
The concentrations of lead in water were all be-low 7 ppb, which is the threshold value recommended by the World Health Organization (WHO).
Determinants of blood- lead levels
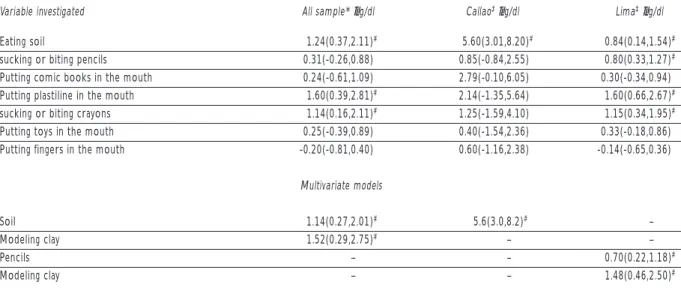
of residency (Table II), only the habits of eating soil and playing with modeling clay remained as statisti-cally significant predictors; the first was associated with an increase of 1.1 µg/dl and the second with an in-crease of 1.6 µg/dl. The variables associated with the risk of having blood lead levels higher than 10 µg/dl, adjusting for age and sex, presented similar results as those previously described. For the total sample stud-ied, eating soil was associated with an increase of 64% (OR 1.64, 95% CI: 1.25-2.16) in the risk of showing val-ues higher than 10 µg/dl, while biting or sucking pen-cils was associated with an increased risk of 37% (OR 1.37, 95% CI: 1.14-11.65). Children living in Callao dis-played an increase of 92% (OR 1.92, 95% CI: 1.25-3.06)
FIGURE 2. DESCRIPTIVE ANALYSES FOR SOIL LEAD AND
DISTRIBUTIONACCORDIINGTODISTANCETOTHESTORAGE
AREA. LIMAAND CALLAO, PERÚ, 1998-1999
3000
2500
2000
1500
1000
500
9
Soil lead concentrations (
µ
g/g)
1 2 3 4 Distance to source (storage area) Table I
MEANBLOODLEADLEVELS, DISTRIBUTION
OFFREQUENCYANDPERCENTAGEOFPARTICIPANTS
ACCORDINGTODISTRICTANDSCHOOL.1998-1999
Children
Mean S.D.
District Recruitment Centers Number % µg/dl µg/dl
Comas Elementary school 119 4.74 6.64 2.66 Elementary school 141 5.62 7.43 2.97 Pre-school 22 0.88 6.78 2.18 Pre-school 60 2.39 10.54 7.43 Elementary school 75 2.99 7.54 4.26
Callao Elementary school 166 6.61 8.58 4.44 *Elementary school 68 2.71 40.73 12.96 *Elementary school 119 4.74 15.88 9.81 *Pre-school 130 5.18 13.87 8.01
Callao Healthy child clinic 213 8.49 8.44 5.56 *Healthy child clinic 127 5.05 26.66 11.96
La Molina Elementary school 44 1.75 5.54 2.89 Elementary school 72 2.87 5.80 2.89 Pre-school 103 4.1 6.24 2.56
Lince Pre-school 198 7.89 8.31 4.06 Elementary school 84 3.35 5.91 1.82 Elementary school 138 5.5 9.39 3.89
Lima Healthy child clinic 185 7.37 6.72 4.27 Healthy child clinic 200 7.97 6.37 4.14
SJM Healthy child clinic 40 1.59 5.29 6.94
P Libre Healthy child clinic 206 8.21 6.64 6.99 Total 2, 510 100 9.9 5.8
Women
District
PLibre Hospital Santa Rosa 199 22.77 2.58 1.45 SJM Hospital María Auxiliadora 67 7.67 2.67 1.66 Lima Hospital San Bartolomé 203 23.23 3.58 2.89 Lima Ins. Maternal Perinatal 203 23.23 3.77 2.03 Callao Hospital Daniel Alcides Carrión 202 23.1 4.13 2.85
Total 874 100 3.5 2.4
* Recruitment centers located near mineral deposits SD Standard deviation
parents reported that they had the habit of eating mod-eling clay displayed more elevated blood lead levels
(2.2 µg/dl). Considering both behaviors described
above simultaneously and adjusting for age and place
Descriptive analyses for soil lead samples (µg/g)
Sample size 46
Minimum 52
Percentil 25 98
Mean 542
Median 214
Percentil-75 623
Maximum 2859
Table II
DIFFERENCESINBLOODLEADLEVELSACCORDINGTODIFFERENTBEHAVIORSSTUDIED:
LIMA METROPOLITAN AREAAND CALLAO, 1998-1999
Variable investigated All sample* µg/dl Callao‡µg/dl Lima‡µg/dl
Eating soil 1.24(0.37,2.11)# 5.60(3.01,8.20)# 0.84(0.14,1.54)# sucking or biting pencils 0.31(-0.26,0.88) 0.85(-0.84,2.55) 0.80(0.33,1.27)# Putting comic books in the mouth 0.24(-0.61,1.09) 2.79(-0.10,6.05) 0.30(-0.34,0.94) Putting plastiline in the mouth 1.60(0.39,2.81)# 2.14(-1.35,5.64) 1.60(0.66,2.67)# sucking or biting crayons 1.14(0.16,2.11)# 1.25(-1.59,4.10) 1.15(0.34,1.95)# Putting toys in the mouth 0.25(-0.39,0.89) 0.40(-1.54,2.36) 0.33(-0.18,0.86) Putting fingers in the mouth -0.20(-0.81,0.40) 0.60(-1.16,2.38) -0.14(-0.65,0.36)
Multivariate models
Soil 1.14(0.27,2.01)# 5.6(3.0,8.2)# –
Modeling clay 1.52(0.29,2.75)# – –
Pencils – – 0.70(0.22,1.18)#
Modeling clay – – 1.48(0.46,2.50)#
* Difference in means adjusted for age and residential area ‡ Difference in means adjusted for age
§ Significant predictors in the multivariate models #p<0.05
in the risk of having high blood lead levels in relation to the above mentioned variable.
Exposure to vehicular traffic
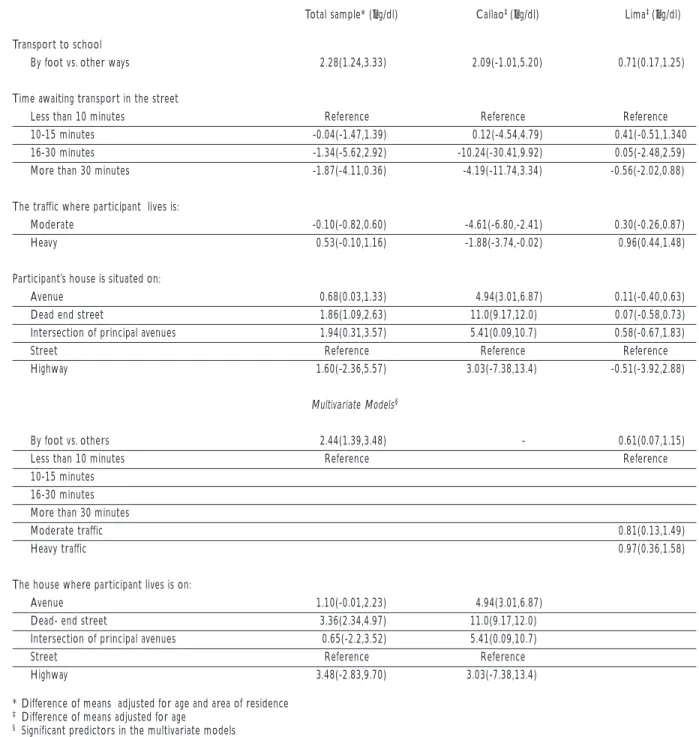
The type of transportation used by the participant to go to school, waiting time and location of the home were variables studied in the questionnaire. Walking to school was associated with an increase in blood lead level in comparison with other means of transporta-tion. In the whole population, an excess in the blood lead level of 2.2 µg/dl was associated with walking to school after adjusting for differences in age and sex. An excess of 0.61 µg/dl and 2.0 µg/dl were detected in the children of Lima and Callao, respectively, when analyzing them separately. In the population of Callao the variable of major predictive power was the type of street where the houses were located (Table III). These results, however, are distorted by the fact that a large number of the participants (53%) who lived near the mineral deposits reported that they lived in narrow dead-end streets with low vehicular traffic. The most important predictors for the residents of Lima were: walking to school and the intensity of vehicular traffic in the residential zones.
Exposure to paints
The questionnaire results as well as a limited sample of house paint chips did not suggest that paints were an important source of lead exposure in the popula-tion studied.
Variables associated with residence and exposure to lead
Eighty-one percent of the population studied report-ed that they obtainreport-ed water directly from their homes. They displayed blood lead levels significantly lower than those who obtained water from cylinders, from only one source in the neighborhood or from a source outside the house.
Place of storage of the minerals
Exposure in relation to occupation
The father s occupation was a risk factor for high blood lead levels among the children studied. If the father had an occupation that involved lead exposure and his
working clothes were cleaned at home, the child was three times more likely to have a high blood lead lev-el. However, this finding should be interpreted with caution because of the small percentage of children exposed to this risk factor. This type of potential
ex-Table III
DIFFERENCESINBLOODLEADLEVELSACCORDINGTODIFFERENTVARIABLESRELATEDTOVEHICULARTRAFFIC:
METROPOLITANAND CALLAO,1998-1999
Total sample* (µg/dl) Callao‡ (µg/dl) Lima‡ (µg/dl)
Transport to school
By foot vs. other ways 2.28(1.24,3.33) 2.09(-1.01,5.20) 0.71(0.17,1.25)
Time awaiting transport in the street
Less than 10 minutes Reference Reference Reference
10-15 minutes -0.04(-1.47,1.39) 0.12(-4.54,4.79) 0.41(-0.51,1.340 16-30 minutes -1.34(-5.62,2.92) -10.24(-30.41,9.92) 0.05(-2.48,2.59) More than 30 minutes -1.87(-4.11,0.36) -4.19(-11.74,3.34) -0.56(-2.02,0.88)
The traffic where participant lives is:
Moderate -0.10(-0.82,0.60) -4.61(-6.80,-2.41) 0.30(-0.26,0.87) Heavy 0.53(-0.10,1.16) -1.88(-3.74,-0.02) 0.96(0.44,1.48)
Participant’s house is situated on:
Avenue 0.68(0.03,1.33) 4.94(3.01,6.87) 0.11(-0.40,0.63) Dead end street 1.86(1.09,2.63) 11.0(9.17,12.0) 0.07(-0.58,0.73) Intersection of principal avenues 1.94(0.31,3.57) 5.41(0.09,10.7) 0.58(-0.67,1.83)
Street Reference Reference Reference
Highway 1.60(-2.36,5.57) 3.03(-7.38,13.4) -0.51(-3.92,2.88)
Multivariate Models§
By foot vs. others 2.44(1.39,3.48) - 0.61(0.07,1.15)
Less than 10 minutes Reference Reference
10-15 minutes 16-30 minutes More than 30 minutes
Moderate traffic 0.81(0.13,1.49)
Heavy traffic 0.97(0.36,1.58)
The house where participant lives is on:
Avenue 1.10(-0.01,2.23) 4.94(3.01,6.87)
Dead- end street 3.36(2.34,4.97) 11.0(9.17,12.0) Intersection of principal avenues 0.65(-2.2,3.52) 5.41(0.09,10.7)
Street Reference Reference
Highway 3.48(-2.83,9.70) 3.03(-7.38,13.4)
* Difference of means adjusted for age and area of residence ‡ Difference of means adjusted for age
posure was reported in less than 1% of the children sampled.
Multivariate analysis
The simultaneous effects of the different predictors of blood lead levels were evaluated in multiple regres-sion models. The predictors with statistical significance were sex, age, eating soil, sucking or biting pencils, parent s occupation and place of residence.
The most important predictors identified in the analysis were similar for Callao and Lima. When the stratified analysis was carried out, however, frequent hand washing in Callao and the intensity of vehicular traffic for the Lima population were variables of im-portance.
Results in women in immediate post-partum period
The 874 women studied had a mean age of 25.5 years (SD=6.2). Approximately 80% were married and only 86% reported having completed elementary school or a higher level of education. The mean number of chil-dren of the participants was 1.9 (SD= 1.3). Their mean blood lead level was 3.5 µg/dl (range 0.2 µg/dl to 28.2
µg/dl) and 2.4% (n=21) had blood lead levels higher than 10 µg/dl.
Blood lead levels varied by hospital and a statisti-cally significant difference was observed between women recruited in the hospital that provides servic-es to the population living in Callao, with a mean blood lead level of 4.1 µg/dl, and women recruited from hos-pitals providing service to other areas in Lima, where we observed a mean blood lead level of 2.8 µg/dl.
Other variables such as length of time living in Lima and smoking during pregnancy were significant-ly related to blood lead levels. Women who had lived longer in Lima had higher blood lead levels. Other variables used, such as exposure to traffic, time spent outdoors, husbands occupation, and type of transpor-tation were not significantly associated with the wom-en s blood lead levels. It is important to mwom-ention however, that women who indicated the presence of mineral storage areas near their houses (n=2) had blood lead levels nearly two times higher than the rest of the participants; 6.55 µg/dl versus 3.55 µg/dl, respectively.
Discussion
This is the first large cross-sectional study that has been performed to evaluate blood lead levels and their de-terminants in Lima, and it constitutes a baseline
as-sessment of blood lead levels in children to evaluate the potential impact of removing lead from gasoline. In the indexed literature, we located only two publica-tions that reported information regarding blood lead levels in the general population of Lima. Ramírez et al. Reported a mean blood lead level of 26.9 µg/dl in a
sample 80 adults with non-occupational exposure.13
This value differs from the results of our study, most likely due to selection bias in the Ramírez study, or its use of poor laboratory methods, or an error in its re-porting of units for lead measurements. The second study reported a mean blood lead level of 11.7 µg/dl among 40 young children,14 a value which is in
agree-ment with our results. This last study included an ex-ternal laboratory control provided by the Center for Disease Control and Prevention in Atlanta, Georgia.
The results of our study are important for several reasons. First, they provide valuable information re-garding childrens blood lead levels and their determi-nants in Metropolitan Lima and Callao. Second, they illustrate the application of a new portable and easy-to-use technology to assess blood lead levels in the context of a large epidemiological study. This technol-ogy is a cost-effective alternative for countries that do not want to invest the funds needed to develop a full atomic absorption based laboratory for blood lead test-ing. However, the results of this study only represent the risk from lead exposure in six districts of Lima and Callao at one time of the year and should not be ex-trapolated to other child populations in Peru of differ-ent socioeconomic levels and degrees of exposure to gasoline lead or additional point sources. It also marks the first time that internationally accepted methods to evaluate blood lead levels in children have been used in Peru and provides a foundation for further popula-tion-based evaluations.
The blood lead levels in the population studied in the Lima metropolitan area were 7.1 µg/dl for children and 3.5 µg/dl for the women in the reproductive age group and demonstrate that blood lead concentrations are not as alarming as previously reported.13 The
lev-els of exposure were only slightly elevated and were within the blood lead levels recommended by the
World Health Organization which is 10 µg/dl.
None-theless, this should not discourage efforts to control exposure because available data suggest that health effects, such as reduction in IQ are still observed at lev-els below the 10 µg/dl threshold.15
Our results for children living in Lima are similar to those obtained by Romieu et al16 in a study done in
Mexico City during the time that leaded gasoline was still in use. It reported a mean blood lead level of 9.4
southern part of Mexico City (Tlalpan, a residential
area), and a mean blood lead level of 10.5 µg/dl
(S.D=5.5 µg/dl) among children living in the northern part of Mexico City (Xalostoc, an industrial area). Our results are also similar to those reported for other coun-tries like Nicaragua, 7.4 µg/dl, and Uruguay, 9.5 µg/ dl, both of which were reported by Romieu et al.17
Our results also indicate that soils contaminated with lead remain a persistent problem because of the long half-life of lead in soils. Compared with gasoline-derived lead, lead gasoline-derived from other sources propor-tionally affects a smaller number of residents in the zones studied. Such sources, however, disproportion-ately affect children of low-income families living in poverty, like those studied in Puerto Nuevo, Callao, where very high lead levels were documented. This is an important factor to bear in mind when designing intervention strategies and employing corrective mea-sures in order to avoid inequitable public health situa-tions. Programs to eliminate gasoline, in other words, are not sufficient to eliminate high blood lead levels in all sectors of the population. Additional work must be done to identify other sources of lead exposure. Efforts should be made to increase lead testing aimed at spe-cific populations and with the purpose of detecting potential problems before children develop the toxic effects of lead. Environmental screening methods avail-able at relatively low cost can now be used to help iden-tify the most immediately hazardous settings in order to speed interventions that will reduce environmental lead exposure.
Scientific reports have demonstrated the existence of different lead sources and that hand mouth activity in children is the main route of ingestion for lead con-tained in soil, dust, paint, and other mining sourc-es.9,12,17-22 There may e two pat ways of exposure for
children in the case of mine waste or mine products: one is the movement of mine wastes/products to oth-er areas, which is unlikely given that the storage areas in Callao are well kept from the population by high fences; and the other is contact with areas near homes which may have become contaminated with mine wastes or products. In the case of Callao, this second pathway is the more likely contaminator, given that ore piles are not covered and have not been humidi-fied to prevent fugitive dusts. It is therefore likely that wind-blown dust has contaminated the areas where children play for many years. This may even include the interiors of their houses, because houses in this area are not close and have a high exchange with the exter-nal environment. This hypothesis is supported by the observation of high lead concentration in dust sam-ples from residential areas and by data from the air
monitoring network. During the study period lead concentrations in PST were 7.3 µg/m3, a value well
above the recommended value of 1.5 µg/m.3 ,23
Children living close to the mineral storage areas had a mean blood lead level of 25.6 µg/dl, while chil-dren living in the same district but away from the
stor-age area had a mean blood lead of 9.6 µg/dl. This
difference (16 µg/dl) is considerably higher than what has been reported for other studies relating blood lead levels to soil lead concentrations in old mining areas contaminated with mine wastes and without any re-cent smeltering activities.24 In a review of these
stud-ies Steele et al reported either no differences or slopes of 2.2 for an increase of 500 ppm. In our study we ob-served a difference of 2 645 ppm in the soils, which suggests a higher slope. Other factors not analyzed in our study may explain this higher slope, for example the size and solubility of particles, the iron status of these children as well as the hygiene practices. In this population, not washing hands was a strong predictor of blood lead levels. Additional data will be needed to better understand the relationship observed in our study population. Bias due to external contamination is also a possible explanation for the high blood levels documented in this sample. However, all children with
blood lead higher than 20 µg/dl were confirmed by
blood lead determination in venous blood sample that was measured using atomic absorption. In addi-tion we followed a strict protocol for hand washing and we believe this source of bias does not explain our findings.
When we analyze the case of Callao, we note that there are different sources of lead apart from that of gasoline that contribute to these blood lead levels. The principal source in Callao can be attributed to the pres-ence of mineral storages near the houses or schools where the children lived or studied. The levels of lead in soil increased the closer we got to the mineral de-posits, and this was also reflected in the high blood lead levels found in these children. This finding is in accordance with that of other authors who found lead exposures to point sources.12,20,24-28 Gallacher et al.
(1984) reported that the blood lead level increases 4.5
µg/dl for each 1 000 ppm of lead in soil. In our study we cannot calculate this result because we did not ob-tain information regarding lead in environmental sam-ples from the individual households. However, Naeher
et al.29 conducted a study to assess the contributions of
mineral lead was the primary source of lead in the chil-dren living near the depository in Callao, and that this differed from the primary source of lead exposure for children in other regions.
In 1998, Peru was the eighth largest producer of lead worldwide and one of the principal users of lead in different industries, including lead in gasoline. In Lima and Callao, according to the National Informa-tion of the State of the Environment, it is reported that the motor vehicle fleet was made up of 700 000 vehi-cles, with an average lifespan of 18 years and consumed 9 thousand cubic meters of fuel on a daily basis. There is no information on how much lead was transferred to the environment.
The use of lead in gasoline as anti-knock is present only in some Latin American countries and the Carib-bean at present. Romieu et al. reported in 199430 that
lead concentrations in gasoline ranged from 1.32 µg/dl in Surinam to 0.03 µg/dl in Uruguay. At this moment, in Peru, lead contained in gasoline was 0.75 µg/l, with plans to eliminate lead in gasoline by 2005. This goal is very important as 75% of the population in Latin America and the Caribbean is urbanized, and there-fore the impact of leaded gasoline is of major im-portance for public health, as reported by Romieu et al.9,12,16,31 Finally, our study documents the presence of
inequity with regard to environmental exposures be-cause the poorest children are exposed to the greatest amount of lead. The effects of that exposure accumu-late among populations already subject to other social deprivations, making the cycle of poverty a more dif-ficult barrier for development.
References
1. Howson CP, Hernández-Avila M, Rall DP, Ed. Lead in the Americas: A call for action. Washington, DC: US National Academy of Sciences and the National Institute of Public Health of Mexico, 1996.
2. Rabinowitz M, Needleman HL. Petrol lead sales and umbilical cord blood lead levels in Boston, Massachusetts [letter].Lancet 1983; 1(8314-5):63.
3. Hernández-Avila M, Sanín LH, Romieu I et al. Higher milk intake during pregnancy is associated with lower maternal and umbilical cord lead levels in postpartum women. Environ Res 1997;74(2):116-121. 4. Rothenberg SJ, Karchmer S, Schnaas L, Perroni E, Zea F, Salinas V et al. Maternal influences on cord blood lead levels. J Exp Asses Environ Epidemiol 1996;6:211-227.
5. Schlenker TL, Fritz CJ, Mark D, Layde M, Linke G, Murphy A et al. Screening for pediatric lead poisoning: Comparability of simultaneously drawn capillary and venous blood samples. JAMA 1994;271(17): 1346-1348.
6. Sargent JD, Dalton MA. Rethinking the threshold for abnormal capillary blood lead screening test. Arch Pediatr Adolesc Med 1996;150(10):1084-1088.
7. Johnson NH, Ash KO, Nuttall KL, Ashwood ER. The adecuacy of capillary specimens for determining whole blood lead. Ann Clin Lab Sci 1997;27:179-184.
8. National Institute for Occupational Safety and Health. Manual of analytical methods. Fourth Edition. Department of Health, Education and Welfare, 1994.
9. Centers for Disease Control. Preventing lead poisoning in young children: A statement by the Centers for Disease Control. Atlanta (GA): CDC,1991:
10. Ashley K. Ultrasonic extraction and field-portable anodic stripping voltametry of lead from environmental samples. Electroanalysis 1994;7:1189-1192.
11. American Society for Testing and Materials. E1775-96 Standard guide for evaluating performance of on-site extraction and field-portable electrochemical or spectrophotometric analysis for lead. In: Ed.Annual Book of ASTM Standards. West Conshohocken (PA): ASTM, 2000. 12. Rubín CH, Esteban E, Jones R, Noonan G, Gurvich E, Utz S et al. Childhood lead poisoning in Russia: A site-specific pediatric blood lead evaluation. Int J Occup Environ Health 1997;3:241-248.
13. Ramírez AV, Paucar JC, Medina JM. Blood lead levels in the inhabitants of 4 Peruvian localities. Pan Am J Public Health. 1997;1(5):344-348.
14. Jacoby E. Environmental lead is a problem in Lima, Peru. Environ Health Perspect 1998;106: A170-171.
15. Schwartz J. Low-level lead exposure and children’s IQ: A meta-analysis and search for a threshold. Environ Res 1994;65(S1):42-55. 16. Romieu I, Carreón T, López L, Palazuelos E, Ríos C, Manuel I et al. Environmental urban lead exposure and blood lead levels in children of Mexico City. Environ Health Perspect 1995;103(11):1036:1040. 17. Romieu I et al. Lead exposure in Latin America and the Caribbean. Lead Research Group of the Pan-American Health Organization. Environ Health Perspect 1997;105(4):398-405.
18. National Academy of Sciences. Measuring lead exposure in infants, children, and other sensitive populations. Washington, DC: National Academy of Sciences Press, 1993.
19. Bjerre B, Berghend M, Harsboo K, Hellman B. Blood lead
concentrations of Swedish preschool children in a community with high lead levels from mine waste in soil and dust. Scan J Work. Environ Health 1993;19:154-161.
20. Ordóñez B, Ruiz-Romero L, Mora R. Investigación epidemiológica sobre niveles de plomo en la población infantil y en el medio ambiente domiciliario de Ciudad Juárez, Chihuahua en relación con una fundición de El Paso Texas. Bol Oficina Sanit Panam 1976:303-317.
21. Jiménez C, Romieu I, Palazuelos E, Muñoz I, Cortés M, Rivero A et al Factores de exposición ambiental y concentraciones de plomo en sangre en niños de la Ciudad de México. Salud Publica Mex 1993;35:599-606.
22. Agency for Toxic Substances and Disease ATSDR. Registry/Case studies in environmental medicine: Lead toxicity. Atlanta (GA): 1990. 23. Narciso-Chávez J, Gastañaga-Ruiz C, Espinoza-Laín R, Sánchez-Zavaleta C, Moscoso- Reátegui S, Quequejana-Condori JL et al. Environmental health project. Act Rep 2000;104:5-25. 24. Steele MJ, Beck BD, Murphy BL, Strauss H. Assessing the
contribution from lead in mining wastes to blood lead. Reg Toxic Pharm 1990;11:158-190.
moderate exposure in a major lead mining community. Sci Total Environ 1996;181:223-230.
27. Bornschein RL, Clark CS, Grote J, Peace B, Rodaa S, Succop P. Soil lead-blood lead relationships in a former lead mining town. Environ Geochem Health 1989;:140-160.
28. Gallacher JE, Elwood PC, Phillips KM, Davies BE, Jones DT. Relation between pica and blood lead in areas of differing lead exposure. Arch Dis Child 1984;59:40-44.
29. Naeher LP, Rubín CS, Hernández-Avila M, Noonan GP, Paschal D, Narciso J et al. Use of isotope ratios to identify lead sources
contributing to pediatric lead posisonnings in Callao, Peru. Arch Environ Health. In press.
30. Romieu I, Palazuelos E, Hernández-Avila M, Ríos C, Muñoz I, Jiménez C et al. Sources of lead in México City. Environ Health Perspect 1994;102:384-389.