oa
México
Publicación Digital de la Facultad de Medicina Veterinaria y Zootecnia
OA
http://veterinariamexico.unam.mx/Received: 2015-05-25 Accepted: 2017-08-31 Published: 2018-03-20 Additional information and declarations
can be found on page 12
Copyright 2018 Rodríguez Fierros Félix Leao et al.
open access
Distributed under Creative Commons CC-BY 4.0
Abstract
Hepatic lipidosis is a metabolic disorder that occurs frequently in dairy cattle. Its clinical evaluation on dairy farms is complex, as it is based on physi-cal, chemical and biological tests. The present study evaluates the practical use of hepatic cytology in dairy cattle and suggests that overall health and dairy production rates of animals are not compromised with this procedure. Cell and blood samples were obtained from 25 randomly selected multipa-rous Holstein dairy cows at three different times during the transition period (at calving and at 10 and 21 days postpartum). The values of haematocrit, plasma protein, fibrinogen, and total and differential leucocyte counts were determined, together with total protein, albumin, glutamate dehydrogenase, triacylglycerides, cholesterol and ß-hydroxybutyrate. Cytological results were classified by the detected degree of fatty infiltration, and haematological and metabolic results were compared between each sampled period. The health status and the daily milk production at each sampling stage were recorded. Obtained results indicated that the animals did not show significant clinical inflammation or a decrease in dairy production, which could be deemed secondary to the cytological sampling. This technique is thus regarded as a feasible alternative for the diagnosis of hepatic lipidosis in dairy cattle.
Keywords: Lipidosis, cytology, dairy cow, fatty infiltration.
Practical use of clinical cytology
for the diagnosis of hepatic lipidosis
in dairy cattle
Rodríguez Fierros Félix Leaoa* Quiroz-Rocha Gerardo Fb 0000-0003-4724-0936 Núñez Ochoa Luisa 0000-0003-0099-8854 Aparicio Cecilio Adolfoa Salgado Hernández Eligio Gabrielc
a Laboratorio de Patología Clínica,
Departamento de Patología; Facultad de Medicina Veterinaria y Zootecnia, Universidad Nacional Autónoma de México, Av. Universidad 3000, 04510, Ciudad de México ; México.
b Centro de Enseñanza, Investigación, and Extensión
en Producción Animal en el Altiplano, Facultad de Medicina Veterinaria and Zootecnia, Universidad Nacional Autónoma de México. Carretera Federal Tequisquiapan - Ezequiel Montes, km 8.5. 76790, Tequisquiapan, Qro. México.
c Departamento de Medicina and Zootecnia de Rumiantes Facultad de Medicina Veterinaria y Zootecnia, Universidad Nacional Autónoma de México, Av. Universidad 3000, 04510, Ciudad de México ; México. Trabajo realizado como parte del proyecto de tesis para obtener el grado de Maestría en Ciencias de la Producción y Salud Animal del primer autor en la FMVZ-UNAM.
*Corresponding author:
Tel: (045) 4421940385 Email address: felixleao@hotmail.com
Cite this as:
Introduction
Dairy cows present an energy imbalance between the first and fourth week after calving.1 When their diet does not fulfil the requirements for milk production, nu-tritional insufficiency forces the animal to activate the mobilization of fatty acids from the fatty tissue reserve to the liver, for their metabolism as an energy source.1
Hepatic lipidosis (LH), or fatty liver, is the accumulation of triacylglycerides (TAG) in liver tissue due to the excessive flow of fatty acids (FA) and their excessive oxidizing and retention in the liver as TAG.2,3 This disease brings out problems in the general condition of the animal: loss in production and fertility, an increase in peripartum disorders, and an early slaughter of the animal.4-7 This disorder may present itself in 60 % of Friesian cows and in 33 % of Guernsey cows, either to a moderate or a severe degree.8 It has been detected that 45.9 % exhibit LH to a mild degree, 39.9% to a moderate degree and 14.2 % to a severe degree.9
Clinical evaluation of the liver in dairy cattle is complex because other organs may be altered in the process, exhibiting a variety of symptoms of a multifactorial nature.10 In farm conditions, the diagnosis is based mostly on anamnesis, signs and response to treatment.11 At the same time, it is possible to determine FA (two to seven days prior to calving) and ß-hydroxybutyrate (BHB) levels in the first two to three weeks after calving.12,13 Additionally, it is possible to assess hepatocellular integrity through elements such as glutamate dehydrogenase (GDH) and ornithine carbamoyl transferase (OCP).11 Bilirubin, albumin, cholesterol and TAG are indica-tors of liver function.12 Establishing these parameters is very useful upon identifying the process or disease present in the liver; nonetheless, they are insufficient to ren-der a definite diagnosis and degree of the disease, and it is necessary to use other supplementary means like a liver biopsy.14
Currently, histology is the most widespread and trustworthy technique for the diagnosis of liver lipidosis in dairy cattle,5,15 and the use of aqueous copper sulfate solutions at different densities makes it possible to determine the degree of accu-mulation of lipids according to the flotation of liver tissue.16 Nonetheless, both tests are based on the usage of a liver biopsy, which is invasive and requires surgical procedures that are difficult to carry out in regular clinical practice.
In small species, liver cytology is a feasible alternative diagnostic tool that is minimally invasive, with low risk for health and low cost, and which offers accurate and definite diagnostic results.14 The present study encompassed a clinical and metabolic follow-up process to test the effectiveness of liver cytology in dairy cattle as a feasible diagnostic tool in farm conditions, giving certainty that this procedure would not adversely affect either the health or the milk production of the dairy herd.
Methods
Medicina Veterinaria y Zootecnia at Universidad Nacional Autónoma de México (PAPIIT 216409-3 DGAPA, UNAM 2009), based on the mexican standards NOM-062-ZOO-1999 and NOM-032-Z00-1999.
Blood samples were taken from the coccygeal vein using 10 mL vacuum plane tubes with and ethylenediaminetetraacetic acid (EDTA) anticoagulant. To determine the general health condition of the animals during the cytological sampling, haema-tocrit, total solids (plasma proteins), fibrinogen, and total and differential leucocyte counts, were determined within 4 hours after sampling, in refrigerated-preserved tubes. Tubes were spun within 30 to 60 minutes after sampling; serum was separated and frozen until analysed in the Clinical Pathology Laboratory of the Faculty of Veterinary Medicine and Zootechnics, UNAM. Biochemical analytes in-cluded glutamate dehydrogenase (GDH), triacylglycerides (TAG), cholesterol and ß- hydroxybutyrate (BHB), total protein (TP) and albumin (ALB), and were mea-sured using a Junior semiautomatic spectrophotometer (Vital Scientific®, Model: #6-9151 software 1.0, Netherlands); and RANDOX® reagents according to the manufacturer’s instructions.
Cytology samples were taken through the right, eleventh intercostal space above the intermediate third of the rib at the same time that blood samples were taken and following recommendations issued by Bohn et al.17 The area was first sanitized with clean water, then a spray application of ethyl chloride was used as a local anaesthetic (Traumazol®) was given. A metallic 16 G × 25 mm hypodermic needle was introduced as a guide to pass through skin and muscles to enter the abdominal cavity. Then, a 22 G × 150 mm epidural needle was introduced through the first guide needle. It was directed slightly towards the cranium-medial area to reach the liver. Aspiration was done using 10 or 20 mL syringes, moving the needle slightly back and forth inside the liver without altering the direction (Figure 1). Prior to withdrawing the epidural needles, the embolus, or plug of the needle, was al-lowed to clean up the vacuum free of pressure, and its extraction was done softly. Liver
Gall bladder Omasum
Once the syringe was removed, the needle was disconnected; the syringe was then loaded with air and once again the needle was connected to empty the ma-terial collected. This was then placed on a microscope slide, and the corresponding cells spread was done. The slide was then immediately dried by shaking. Aqueous Romanowsky staining was used afterwards. Cytological evaluation was done as per Table 1, obtained from a previous study for standardization and evaluation of liver cells in dairy cattle livers.28 Blood results were classified according to the corre-sponding degree of fatty infiltration observed in the cytological assessment. Only cows with adequate cytological retrieval of material for evaluation were included in the final analysis.
In most animals, enough cell material was obtained to make a cytological evaluation. Sampling was conducted without restraining other than headlocks and local spray analgesic to secure unaltered results. In most animals, no cytological disorders were detected (Figure 2). Some animals exhibited microvesicular steatosis (Figure 3), but several cows were found with fatty infiltrations of mild to moderate degrees (Figures 4 and 5). Metabolism of lipids in cow livers after calving is very ac-tive, and this does not necessarily trigger a pathological process because the liver. Together, the liver, the adipose tissue and the mammary gland, are the main sites of metabolism of FA in dairy cattle.3,18,19,20
Data analysis
Throughout the study, the milk production of the sampled cows was compared to that of 25 other randomly selected cows of the same herd, under the same conditions, that did not undergo hepatic cytology evaluations. The haemogram and the metabolic biochemical profile were compared using U Mann-Whitney and Kru-skal-Wallis tests as not parametric statistics between each sampling period to deter-mine the health conditions and possible metabolic disorders present in those cows.
Results and discussion
Haematology
The number of circulating leucocytes in cows was similar during the three sampled periods (c2 = 3.57, p = 0.168), and lymphocytosis was detected in most cows, except for those with mild lipidosis at 10 and 21 days after calving. It has been established that dairy cattle exhibiting fatty liver in a subclinical manner show ele-Table 1. Classification of the degree of fatty infiltration in dairy cattle liver by cytological examination.
Degree Infiltration in cytoplasmVacuoles Size of Vacuoles Other observations Affected cells
0 Without steatosis < 4 vacuoles Small - < 15%
1 Microvesicular Steatosis < 8 vacuoles Small - 15-60%
2 Mild steatosis < 10 vacuoles Small and medium Slightly amorphous
Cytoplasm 60-75%
3 Moderate < 10 vacuoles Small and medium Few cells with displacement of nucleus
75-85%
Figure 2. Liver cytology from a healthy cow with no alteration of hepatocytes.
Figure 3. Cells obtained from liver aspiration showing microvesicular steatosis. Small vacuoles, amorphous cytoplasm without the formation of complete vacuoles in some cells; others without modifications in their structure may be observed.
vated lymphocytes. 21,22 Increases in lymphocyte counts in some cases were highly suggestive of bovine leucosis virus (BLV) infection; however, no clinical signs of this disease were noticed. Investigation about the BLV status of the farm was beyond the scope of this study and was not further investigated.
At calving
Cattle are characterized by having poor granulocyte reserves, which causes a decrease in circulating neutrophils in the case of an initial inflammatory re-sponse. Once the granulocyte response is accelerated, neutrophils increase in the blood flow, and it is possible to observe a left shift (i.e., circulating band neutrophils).23
In accordance with these results, the haemogram revealed a mild neutrophilia in cows without abnormalities and microvesicular steatosis. In early postpartum cows, this change was related to a physiological neutrophilia commonly observed in parturient mammals. Therefore, the clinical diagnosis might be associated with a mild inflammatory process by a left shift that did not affect the overall clinical performance, health records and milk production (Table 2).
Two animals were found with haemolactia, which could have a negligible influ-ence on the values of haematocrit. On the other hand, one of the animals exhibited signs of hypocalcaemia, which could interfere only in the release of neutrophils by endogenous steroids. The mean colostrum production of the 25 cows in the study at calving was 1.8 ± 2.8 kg/day.
10 days after calving
In cows without fatty infiltration, but with microvesicular steatosis and moder-ate lipidosis, mature neutrophilia was detected (Table 3). However, according to the clinical monitoring, this did not represent a significant difference (z = -1.86, p = 0.06) from the number of neutrophils at calving or 21 days after calving (z = -1.07, p = 0.20). Also, there was a slight increase in the number of
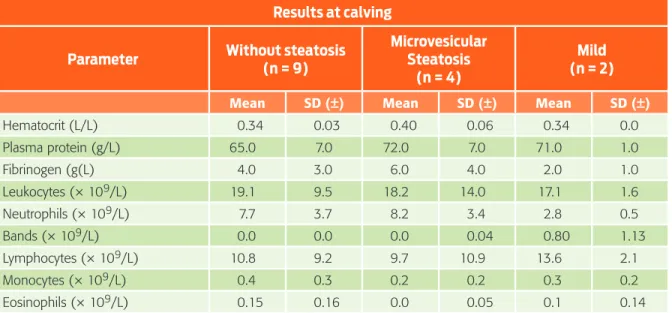
Table 2. Hematologic values per degree of fatty infiltration, through cytological observation in dairy cattle at calving.
Results at calving
Parameter Without steatosis(n = 9) Microvesicular Steatosis (n = 4)
Mild (n = 2) Mean SD (±) Mean SD (±) Mean SD (±)
Hematocrit (L/L) 0.34 0.03 0.40 0.06 0.34 0.0
Plasma protein (g/L) 65.0 7.0 72.0 7.0 71.0 1.0
Fibrinogen (g(L) 4.0 3.0 6.0 4.0 2.0 1.0
Leukocytes (× 109/L) 19.1 9.5 18.2 14.0 17.1 1.6
Neutrophils (× 109/L) 7.7 3.7 8.2 3.4 2.8 0.5
Bands (× 109/L) 0.0 0.0 0.0 0.04 0.80 1.13
Lymphocytes (× 109/L) 10.8 9.2 9.7 10.9 13.6 2.1
Monocytes (× 109/L) 0.4 0.3 0.2 0.2 0.3 0.2
Eosinophils (× 109/L) 0.15 0.16 0.0 0.05 0.1 0.14
Reference intervals: Hematocrit (0.30-0.40 L/L), plasma protein (60-80 g/L), fibrinogen (1-6 g/L), leukocytes (5.0-10 × 109/L), neutrophils (1.0-4.0 × 10⁹/L), bands (0-0.2 × 10⁹/L), lymphocytes (2.0-6.5 × 10⁹/L), monocytes
(0-0.8 × 10⁹/L), eosinophils (0.02- 0.84 ×10⁹/L) SD. Standard deviation. *The cows from which no cell samples were taken
were not considered in this study.
Table 3. Mean hematologic values per degree of fatty infiltration, through cytological observation in dairy cattle at 10 days after parturition.
Results 10 days after calving
Parameter Without steatosis(n = 9) Steatosis (n = 5)Microvesicular ( n = 5)Mild Moderate(n = 3) Mean SD (±) Mean SD (±) Mean SD (±) Mean SD (±)
Hematocrit (L/L) 0.27 0.10 0.30 0.03 0.22 0.13 0.31 0.02
Plasma protein (g/L) 68.0 27.0 76.0 6.0 57.0 32.0 73.0 2.0
Fibrinogen (g(L) 2.0 2.0 4.0 3.0 3.0 2.0 4.0 0.0
Leukocytes (× 109/L) 19.3 14.7 15.6 8.5 9.0 5.5 21.0 21.0
Neutrophils (× 109/L) 6.5 5.3 5.50 2.8 3.6 3.0 5.2 2.7
Bands (× 109/L) 0.06 0.11 0.0 0.0 0.06 0.09 0.04 0.07
Lymphocytes (× 109/L) 12.4 10.9 9.7 5.7 4.9 3.2 15.4 18.7
Monocytes (× 109/L) 0.4 0.4 0.4 0.4 1.3 2.4 0.3 0.1
Eosinophils (× 109/L) 0.07 0.14 0.14 0.20 0.20 0.31 0.0 0.0
Reference intervals: Hematocrit (0.30-0.40 L/L), plasma protein (60-80 g/L), fibrinogen (1-6 g/L), leukocytes (5.0-10 × 109/L), neutrophils (1.0-4.0 × 10⁹/L), bands (0-0.2 × 10⁹/L), lymphocytes (2.0-6.5 × 10⁹/L), monocytes
(0-0.8 × 10⁹/L), eosinophils (0.02-0.84 ×10⁹/L) SD. Standard deviation. *The cows from which no cell samples were taken
cytes in cows that exhibited mild lipidosis (from 0.3 to 1.3 × 10⁹/L). According to some authors, monocytes may increase if the animal is recovering from an inflammatory process.24 However, according to our observations, the mean val-ue of monocytes in the three sampling periods remained unchanged (c2= 1.96, p = 0.375) and within reference limits for most cows (0-0.8 × 10⁹/L).
Between calving and the 10 days afterwards, four animals were identified with episodes of endometritis, and one with pneumonia. The day when cell and blood samplings were conducted, only two animals were found exhibiting endometritis and mastitis. This could alter the values of mature neutrophils and monocytes after recovery from inflammation. The dairy production mean was 34.9 ± 14.0 kg/day; 4.9 kg over the expect value as minimum for this farm.
21 days after calving
In cows with mild and moderate lipidosis, neutrophils were within the reference limits and did not present any other significant alterations (Table 4). The neutro-phil mean value at this stage was significantly different (z = -2.62, p = 0.009) compared to that at the time of calving. Neutrophilia detected at calving and 10 days after calving may be related to the endogenous steroid effect due to partu-rition.21 Moreover, no increase in fibrinogen was detected during the three sampling periods (c2= 1.20, p = 0.550).
Hyperfibrinogenaemia may be a better indicator of severe inflammation than the count of neutrophils present in the blood.23 Cows with fatty liver exhibit a signif-icant decrease of neutrophils, lymphocytes and eosinophils.21 Therefore, all values obtained through the haemogram rule out the presence of hepatic lipidosis, and an inflammation process that might be of clinical significance. There were no signs of significant clinical abnormalities in any of the 25 sampled animals 21 days after calving. Just a single cow was detected with subclinical mastitis with appropriate Table 4. Mean hematologic values per degree of fatty infiltration, through cytological observation
in dairy cattle at 21 days after parturition.
Results 21 days after calving
Parameter Without Steatosis(n = 10) Steatosis (n = 5)Microvesicular (n = 5)Mild Moderate(n =1 ) Mean SD (±) Mean SD (±) Mean SD (±) Mean SD (±)
Hematocrit (L/L) 0.27 0.10 0.29 0.01 0.27 0.03 0.32
-Plasma protein (g/L) 72.0 26.0 79.0 5.0 82.0 5.0 78.0
-Fibrinogen (g(L) 3.0 2.0 5.0 4.0 5.0 3.0 4.0
-Leukocytes (× 109/L) 23.0 19.0 17.4 11.5 13.8 6.1 11.0
-Neutrophils (× 109/L) 5.5 5.3 7.6 4.0 2.3 2.1 3.1
-Bands (× 109/L) 0.0 0.0 0.12 0.27 0.0 0.0 0.0
-Lymphocytes (× 109/L) 17.0 16.4 9.3 8.9 5.3 7.8 7.7
-Monocytes (× 109/L) 0.2 0.2 0.3 0.2 0.2 0.2 0.2
-Eosinophils (× 109/L) 0.12 0.32 0.12 0.13 0.06 0.09 0.0
-Reference intervals: Hematocrit (0.30-0.40 L/L), plasma protein (60-80 g/L), fibrinogen (1-6 g/L), leukocytes (5.0-10 × 109/L), neutrophils (1.0-4.0 × 10⁹/L), bands (0-0.2 × 10⁹/L), lymphocytes (2.0-6.5 × 10⁹/L), monocytes
(0-0.8 × 10⁹/L), eosinophils (0.02- 0.84 ×10⁹/L) SD. Standard deviation.*The cows from which no cell samples were taken
therapy response. Dairy production at this stage reached 37.6 ± 16.8 kg/day; which meant an increase compared to the previous mentioned period.
Blood biochemistry
According to the metabolic profiles, some cows were identified with a slight in-crease in the hepatospecific enzyme GDH in cows with mild and moderate lipi-dosis. GDH indicates liver damage with precision, in this case correlating to acute hepatocellular damage due to steatosis. 11,25 At calving, there was no increase in GDH in any of the cytology categories (Table 5). Ten days after calving, a slight in-crease was observed in this enzyme in cows without abnormalities and with mild lipidosis (Table 6). However, the mean value of GDH at 10 days was significant in cows at calving (z = -2.79, p = 0.005) and not significant 21 days after calving (z = -0.31, p = 0.756). No other significant metabolic changes were detected.
Ten days after calving, there was only a slight drop in total proteins (TP) in the cows without fatty infiltration. This represented no statistical significance com-pared to cows at the moment of calving (z = -1.54, p = 0.125). TP may decrease in cases of liver disease,10 and their concentration in cows with clinical ketosis and subclinical lipidosis may significantly decrease in comparison to those of cows without steatosis.26
At 21 days, there was a slight increase in GDH in cows with microvesicular steatosis and with mild lipidosis, and there was only one cow that was detected with a considerable increase in this enzyme (Table 7). This matches the cytological observation in cases of moderate infiltration. Nonetheless, there is not statistical significance in the mean value of GDH in cases of cows at the moment of calving (z = 1.86, p = 0.06). It should be mentioned that this same cow showed marked hypoproteinaemia (Table 3) causing a significant difference of TP between the time of calving (z = -3.50, p = 0.00) and 10 days after calving (z = -2.37, p = 0.01). Concentrations of albumin and proteins decrease in cows that have more than 20 % of fat accumulated in the liver27 because the capacity of the endoplasmic Table 5. Mean biochemical values as per the degree of fatty infiltration through cytological observation
in dairy cattle at calving.
Results at calving
Parameter Without steatosis(n = 9) Microvesicular Steatosis (n = 4)
Mild (n = 2) Mean SD (±) Mean SD (±) Mean SD (±)
ß-hydroxybutyrate (mmol/L) 0.5 0.1 0.6 0.3 0.4 0.1
Total Proteins (g/L) 55.0 7.0 66.0 9.0 63.0 1.0
Albumin (g/L) 32.0 1.0 33.0 3.0 32.0 3.0
Glutamate dehydrogenase (U/L) 12.0 8.0 13.0 12.0 6.0 3.0
Cholesterol (mmol/L) 2.0 0.4 2.1 0.5 2.1 0.2
Triacylglycerids (mmol/L) 0.2 0.1 0.1 0.02 0.2 0.1
Dairy production (kg/day) 2.54 2.54 0.73 1.20 1.55 0.35
Table 6. Mean hematologic values per degree of fatty infiltration, through cytological observation in dairy cattle at 10 days after parturition.
Results 10 days after calving
Parameter Without Steatosis(n = 9) Steatosis (n = 5)Microvesicular ( n = 5)Mild Moderate(n = 3) Mean SD (±) Mean SD (±) Mean SD (±) Mean SD (±)
ß-hydroxybutyrate (mmol/L) 0.4 0.2 0.5 0.2 0.5 0.2 0.5 0.2
Total Proteins (g/L) 52.0 25.0 62.0 14.0 61.0 4.0 59.0 10.0
Albumin (g/L) 27.0 12.07 33.0 3.39 33.0 1.34 30.0 5.0
Glutamate dehydrogenase (U/L) 38.0 79.0 21.0 20.0 37.0 18.0 21.0 9.0
Cholesterol (mmol/L) 2.3 1.3 3.0 2.7 2.7 0.3 2.2 0.4
Triacylglycerids (mmol/L) 0.1 0.04 0.1 0.1 0.1 0.03 0.3 0.2
Dairy production (kg/day) 35.34 11.38 33.46 8.22 42.24 10.10 41.23 8.68
Reference intervals: BHB (< 1.4 mmol/L), Total Proteins (60-80 g/L), albumin (30-36 g/L), GDH (< 31U/L), cholesterol (2.3-6.0 mmol/L), TAG (0-0.2mmol/L). SD. Standard deviation. * The cows from which no cell samples were taken were not considered in this study
Table 7. Mean hematologic values per degree of fatty infiltration, through cytological observation in dairy cattle at 21 days after parturition.
Results 21 days after calving
Parameter Without Steatosis(n = 10) Steatosis (n = 5)Microvesicular (n = 5)Mild Moderate(n = 1) Mean SD (±) Mean SD (±) Mean SD (±) Result SD (±)
ß -hydroxybutyrate (mmol/L) 0.44 0.19 0.73 0.16 0.94 0.52 0.43
-Total Proteins (g/L) 67.0 25.0 67.0 5.0 69.0 12.0 46.0
-Albumin (g/L) 32.0 11.75 35.0 2.59 34.0 4.15 25.0
-Glutamate dehydrogenase (U/L) 23.9 35.13 40.80 29.89 56.8 80.24 99.0
-Cholesterol (mmol/L) 3.43 1.63 4.51 1.30 3.92 1.26 2.7
-Triacylglycerids (mmol/L) 0.15 0.11 0.24 0.17 0.11 0.02 0.12
-Dairy production (kg/day) 31.62 15.76 51.38 10.08 35.96 12.31 54.4
reticulum of the hepatocyte is compromised, inasmuch as the damage or the in-filtration of fat increases within hepatic tissue. The remaining biochemical results did not show relevant variations indicating that overall, the animals were in proper health conditions, without displaying evidence of pathological lipomobilization.
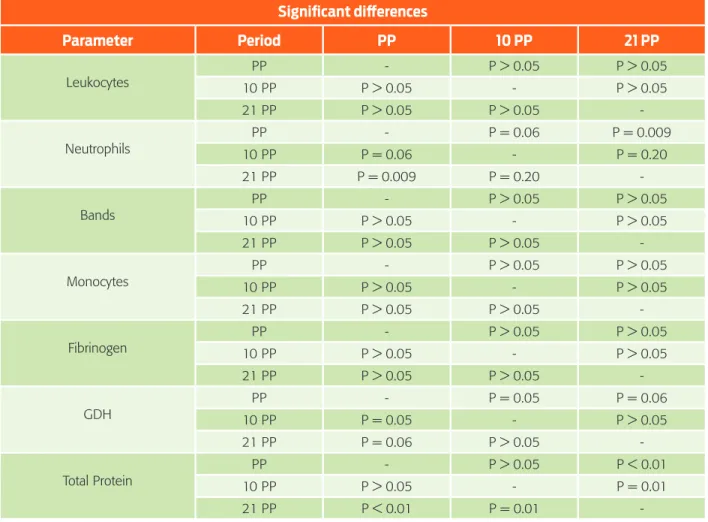
Table 8 summarizes those analytes with significant differences among the re-spective sampling times. Cytological observations between the three different sam-pling periods did not show significant differences (c2 = 8.08, p = 0.018). This might be attributable to the absence of other metabolic diseases despite some of them showing cytologic changes in accordance with hepatic lipidosis to a mild and moderate degree. Markedly infiltrated livers or severely sick cows were not present during the study.
Comparing the milk production of the sampled cows with that from the cows that did not undergo hepatic cytology evaluations, there were no significant dif-ferences between the two groups, in calving (z = -0.64, p = 0.523), at 10 day postpartum (z = -0.20, p = 0.839) and 21 day postpartum (z = -1.34, p = 0.181). Table 8. Significant differences of the most relevant parameters in the study
Significant differences
Parameter Period PP 10 PP 21 PP
Leukocytes
PP - P > 0.05 P > 0.05
10 PP P > 0.05 - P > 0.05
21 PP P > 0.05 P > 0.05
-Neutrophils 10 PPPP P = 0.06- P = 0.06- P = 0.009P = 0.20
21 PP P = 0.009 P = 0.20
-Bands
PP - P > 0.05 P > 0.05
10 PP P > 0.05 - P > 0.05
21 PP P > 0.05 P > 0.05
-Monocytes
PP - P > 0.05 P > 0.05
10 PP P > 0.05 - P > 0.05
21 PP P > 0.05 P > 0.05
-Fibrinogen 10 PPPP P > 0.05- P > 0.05- P > 0.05P > 0.05
21 PP P > 0.05 P > 0.05
-GDH 10 PPPP P = 0.05- P = 0.05- P = 0.06P > 0.05
21 PP P = 0.06 P > 0.05
-Total Protein
PP - P > 0.05 P < 0.01
10 PP P > 0.05 - P = 0.01
21 PP P < 0.01 P = 0.01
Conclusion
Hepatic cytology, in productive species, such as dairy cattle, offers practitioners a favourable alternative for diagnosing hepatic lipidosis. The technique did not exhibit risks upon sampling and constituted an adequate diagnostic tool. Results may be obtained in a rapid, precise and reliable manner with a low cost compared to the traditional liver biopsy for histological examination.
There was no clinical or laboratory evidence that observed inflammation was attributable to the sampling process. Milk yield comparisons indicated that cytologi-cal sampling did not affect milk production of the cows. Therefore, hepatic cytology through aspiration with a thin needle represents a feasible option for the special-ized veterinarian, as they may be able to diagnose liver diseases faster than through the currently available tools. Further studies are recommended regarding hepatic cytology using control groups (running the same clinico-pathological tests in cows without cytological sampling) and comparing them to other diagnostic tools for dairy cattle. However, the obtained result give a promissory future in the advance of diagnosing hepatic lipidosis with a minimally-invasive technique.
Acknowledgements
Authors thanks to staff of the pathology department of the FMVZ-UNAM. To MVZ EPAB Raúl Flores Arámbula, MVZ EPAB Jaime Rendón Villamil and MVZ EPAB Jesús Quintero Cedeño and CONACyT for the facilities during to study in CDMX and Torreón Coahuila, México.
Special thanks to Dr. Jan Bouda for his advice, experience and support.
Conflicts of interest
The authors declare that they have no conflict of interest with persons or institutions.
Author contributions
Rodriguez Fierros Felix Leao and Quiroz Rocha Gerardo F designed study, ana-lyzed data and wrote manuscript. Salgado Hernandez Eligio Gabriel, Aparicio Cecilio Adolfo and Nuñez Ochoa Luis, did the experimental works, analytical techniques and analyzed information.
References
1. Stöber M. Enfermedades del hígado. In: Dirksen G, Gründer HD, Stöber R, ed-itors. Medicina interna y cirugía del bovino. 4th edition, vol. 1(1). Buenos Aires (AR): Inter-Médica, 2005; p. 589-605.
2. den Boer M, Voshol P, Kuipers F, et al. Hepatic Steatosis: A Mediator of the Met-abolic Syndrome. Lessons From Animal Models. Arterioscler Thromb Vasc Biol. 2004;24:644-9. doi: /10.1161/01.ATV.0000116217.57583.6e
3. Vernon RG. Lipid metabolism during lactation: A review of adipose tissue-liver interactions and the development of fatty liver. J Dairy Res, 2005;72:460-9. doi: 10.1017/S0022029905001299
5. Bobe G, Young JW, Beitz DC. Invited review: Pathology, etiology, prevention and treatment of fatty liver in dairy cows. J Dairy Sci, 2004;87:3105-24. doi: 10.3168/jds.S0022-0302(04)73446-3
6. Quiroz-Rocha GF, Bouda J. Patología clínica de hígado. In: Nuñez Ochoa L, Bou-da J, editors. Patología clínica veterinaria. DF (MX): UNAM, 2007; p. 122-37. 7. Starke A, Haudum A, Weijers G, et al. Technical note: analysis of total lipids
and triacylglicerol content in small liver biopsy samples in cattle. J Anim Sci, 2010;88:2741-50. doi: 10.2527/jas.2009-2599
8. Jorritsma R, Jorritsma H, Schukken YH, et al. Prevalence and indicators of post partum fatty infiltration of the liver in nine commercial herds in the Netherlands. Livest Prod Sci, 2001;68:53-60. doi: 10.1016/S0301-6226(00)00208-6 9. Reid IM. Incidence and severity of fatty liver in dairy cows. Vet Rec,
1980;107:281-4. doi: 10.1136/vr.107.12.281
10. Eddy RG. Metabolics disease. In: Andrews AH, Boyd H, Eddy RG, Blowey RW, editors. Bovine medicine disease and husbandry of cattle. Oxford (UK): Black-well Science, 2004;801-3.
11. Kalaitzakis E, Roubies N, Panousis N, Pourliotis K, Kaldrymidou E, Karatzias H. Clinicopathologic evaluation of hepatic lipidosis in periparturient dairy cattle. J Vet Intern Med, 2007;21:835-45. doi: 10.1111/j.1939-1676.2007.tb03029.x 12. Quiroz-Rocha GF, Leblanc S, Duffield T, et al. Evaluation of prepartum serum
cholesterol and fatty acids concentrations as predictors of pospartum retention of the placenta in dairy cows. J Am Vet Med Assoc, 2009;234:790-793. doi: 10.2460/javma.234.6.790
13. LeBlanc S. Monitoring metabolic health of dairy cattle in the transition period. J Reprod Dev, 2010;56:S29-35.
14. Rosciani AS, Merlo WA, Insfrán RM, Ruíz Díaz Benitez, Locket M, Koscinkzu P. Caracterización citológica de hepatopatías en perros y gatos. Rev Vet, 2007;18:111-116.
15. Rosendo O, Mcdowell LR. Liver dry matter and liver lipids in periparturient dairy cows. Act Vet Brno, 2003;72:541-546.
16. Herdt TH, Goeders L, Emery RS, et al. Test for estimation of bovine hepatic lipid content. J Am Vet Med Assoc, 1983;182:953-955.
17. Bohn AA, Callan RJ. Cytology in food animal practice. Vet Clin N Am-Food A P, 2007;23:443-479. doi: 10.1016/j.cvfa.2007.07.007
18. Bauchart D. Lipid absorption and transport in ruminants. J Dairy Sci, 1993;76:3864-3881. doi: 10.3168/jds.S0022-0302(93)77728-0
19. Bauchart D, Gruffat D, Durand D. Lipid absorption and hepatic metabolism in ruminants. P Nutr Soc, 1996;55:39-47. doi: 10.1079/PNS19960010
20. Engelking LR. Lipid metabolism. In: Engelking LR, editor. Physiological chemistry: textbook of veterinary. Oxford (UK): Jackson, 2004:298-410.
21. Reid IM, Dew AM, Williams LA. Hematology of subclinical fatty liver in dairy cows. Res Vet Sci, 1984;37:63-65.
23. Wood D and Quiroz-Rocha GF. Normal hematology of cattle. In: Weiss DJ and Wardrop J, editors. Schalm’s veterinary hematology. Iowa (US): Blackwell, 2000:829-834.
24. Weiss DJ and Perman V. Assessment of the hematopoietic system in ruminants. Vet Clin N Am Food A P, 1992;8:411-428. doi: 10.1016/S0749-0720(15)30732-5 25. West HJ. Effect on liver function of acetonaemia and the fat cow syndrome in
cattle. Res Vet Sci, 1990;48:221-227.
26. Sevinc M, Basoglu A, Oztok I, Sandikci M, Birdane F. The clinical-chemical pa-rameters, serum lipoprotein and fatty infiltration of the liver in ketotic cows. Turk J Vet Anim Sci, 1998;22:443-447.
27. Reid IM, Roberts CJ. Subclinical fatty liver in dairy cows. Irish Vet J, 1983;37:104-110.