COULD AN ARRAY OF MEMS MICROPHONES
BE USED TO MONITOR MACHINERY
CONDITION OR DIAGNOSE FAILURES?
Lara del Val, Marta Herráez
University of Valladolid, School of Industrial Engineering, Mechanical Engineering, Valladolid, ES email: [email protected]
Alberto Izquierdo, Juan José Villacorta
University of Valladolid, School of Telecommunication Engineering, Signal Theory and Communications Department, Valladolid, ES
Luis Suárez
University of Burgos, Superior Technical School, Engineering, Civil Engineering Department, Burgos, ES
During the last decades, vibration analysis has been used to evaluate condition monitoring and fault diagnosis of complex mechanical systems. The problem associated with these analysis methods is that the employed sensors must be in contact with the vibrant surfaces. To avoid this problem, the current trend is the analysis of the noise, or the acoustic signals, which are directly related with the vibrations, to evaluate condition monitoring and/or fault diagnosis of mechani-cal systems. Both, acoustic and vibration signals, obtained from a system can reveal information related with its operation conditions. Using arrays formed by digital MEMS microphones, which employ acquisition/processing systems based on FPGA, allows creating systems with a high number of sensors paying a reduced cost. This work studies the feasibility of the use of acoustic images, obtained by an array with 64 MEMS microphones (8x8) in a hemianechoic chamber, to detect, characterize and, eventually, identify failure conditions in machinery. The resolution obtained to spatially identify the problem origin in the machine under test. The acous-tic images are processed to extract different feature patterns to identify and classify machinery failures.
Keywords: MEMS microphone array, fault diagnosis
1. Introduction
An array is an arranged set of identical sensors, fed in a specific manner. The beampattern of the array can be controlled by modifying the geometry of the array (linear, planar...), the sensor spacing and the beampattern, the amplitude and phase excitation of each sensor [1]. Microphone arrays are a particular case, used in applications such as speech processing, echo cancellation, localization and sound sources separation [2]. By using beamforming techniques [3], the array beampattern can be electronically steered to different spatial positions, allowing spatial filtering, i.e. the discrimination of acoustic sources on the basis of their position.
the acoustic sensors and the associated hardware. The extension from a 1D to a 2D array increases exponentially the number of channels required, directly related with the complexity and the cost of the system.
The acronym MEMS refers to mechanical systems with a dimension smaller than 1 mm manu-factured with tools and technology arising from the integrated circuits (ICs) field. These systems are mainly used for the miniaturization of mechanical sensors [4]. The application of MEMS technolo-gy to acoustic sensors has allowed the development of high-quality microphones with high SNR (Signal to Noise Ratio), low power consumption and high sensitivity [5].
A typical acquisition and processing system for acoustic arrays based on analog microphones has four basic elements: sensors, signal conditioners, acquisition devices and signal processor. Digital MEMS (Micro-Electro-Mechanical System) microphones include a microphone, a signal condition-er and an acquisition device incorporated in the chip itself. For this reason, an acquisition and pro-cessing system for an acoustic array based on MEMS microphones is reduced to two basic ele-ments: MEMS microphone and a processing system. The integration of the microphone preamplifi-er and the ADC in a single chip significantly reduces costs and the space occupied by the system.
In recent years, techniques for obtaining acoustic images have been developed greatly and rapid-ly. At present, acoustic images are associated with a wide variety of applications, such as non-destructive testing of materials, medical imaging, underwater imaging, SONAR, geophysical explo-ration, etc. [6]. These techniques are based on the RADAR principles, forming an image of an ob-ject from reflected radio waves. RADAR systems require high-cost hardware and their application on people and specific materials is difficult, due to their low reflectivity. Acoustic images, in the other hand, represent a simple low cost alternative in such cases.
Arrays of MEMS microphones are specially designed for acoustic source localization; however, they are also used in other applications such as DOA (direction of arrival) estimation for vehicles in motion, speech processing, turbulence measurements, identifying geometric dimensions and inter-nal defects of concrete structures, or acoustic imaging. Due to the high diversity of the applications of these arrays, the authors try to widen these uses to other fields, such as the acquisition and pro-cessing of acoustic images of a fan matrix, using a planar array [7].
A fan matrix, fan array or fan wall is a system formed by several fans located on a surface, work-ing together in order to improve the performance of one alone large fan with lower power consump-tion. Any type of application that requires specific temperature conditions is a candidate for a fan matrix. Fan matrices are used in very different applications, such as mine ventilation, radiator cool-ing in vehicles, ventilation systems, airflow control in plant factories, air handlcool-ing in buildcool-ings, or wind tunnels.
2. Processing and acquisition system
This section shows the acquisition and processing system used in this study [7], based on a 2D array of MEMS microphones.
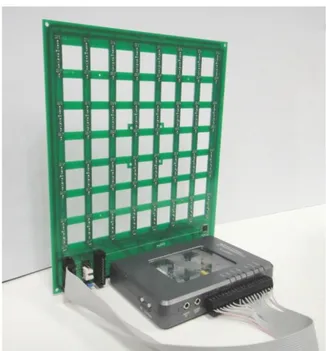
The acoustic images acquisition system used in this paper is based on a Uniform Planar Array (UPA) of MEMS microphones. This array, which has been entirely developed by the authors, is a square array of 64 (8 × 8) MEMS microphones that are spaced uniformly, every 2.125 cm, in a rec-tangular Printed Circuit Board (PCB), as shown in Figure 1.
This array was designed to work in an acoustic frequency range between 4 and 16 kHz. The 2.125 cm spacing corresponds to λ/2 for the 8 kHz frequency. This spacing allows a good resolution for low frequencies, while avoiding grating lobes for high frequencies in the angular exploration zone of interest.
Figure 1. Array module with myRIO and MEMS array board.
A MyRIO platform [8] is the base unit for this system. This platform belongs to the Reconfigu-rable Input-Output (RIO) family of devices from National Instruments, that is oriented to sensors with nonstandard acquisition procedures. The embedded processor included in myRIO is capable of running all the software algorithms to generate acoustic images, so it can be used as a standalone array module formed by a myRIO connected to a MEMS array board as shown in Figure 1. Alt-hough myRIO can work as a standalone system, the lack of display means that it is usually con-trolled from a PC connected using a Wi-Fi interface. In a global hardware setup, as shown in Figure 2, the system includes a PC and one or more array modules.
Figure 2. Global hardware setup.
The algorithms implemented in the system, shown in Figure 3, can be divided into three blocks: MEMS acquisition, signal processing, and image generation (wideband beamforming and image storage). The programming language used is LabVIEW 2015, along with its Real Time, FPGA, and GPU modules, which allows developing applications on different hardware platforms like those used in the system: FPGA, Embedded Processor (EP), PC, and GPU.
In the acquisition block, each MEMS microphone with a PDM interface performs signal acquisition.
Finally, in the image generation block, based on wideband beamforming, a set of N × N steering directions are defined, and the beamformer output are assessed for each of these steering directions. The images generated are then displayed and stored in the system. A processing platform enabled to work at a low level -to acquire signals- and at a high level -to implement spatial processing algorithms-, using low cost commercial systems, was defined. The processing algorithms are shared between the FPGA and the PC, excluding beamforming, which is implemented on the GPU, as shown in Figure 3. The embedded processor is used to control and transfer data between the PC and FPGA.
Figure 3. System framework
3. Fault diagnosis of a fan matrix
The system shown in previous sections has multiple applications: localization and characteriza-tion of noise or vibracharacteriza-tion sources, spatial filtering and eliminacharacteriza-tion of acoustic interference, etc. This case study is focused on obtaining acoustic images of a fan matrix.
3.1 Test fan matrix
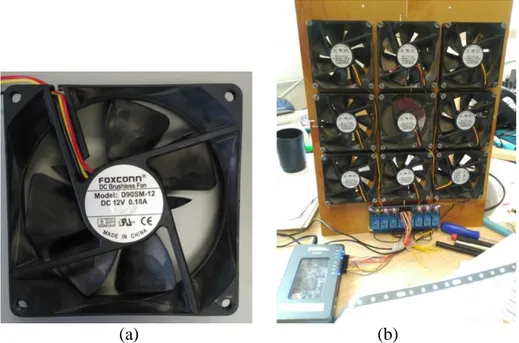
This study case has been carried out with a 3x3 fan matrix, specifically built to these tests with 9 coherent axial PC fans, which move the air in the direction of the fan axis. Each of the fans used to build the fan matrix is a Foxconn D90SM- 12 3-Pin with 7 blades, with a size of 92x92mm. The size of the used fans allows them to move a great amount of air without rotating at a high speed -related with a high noise level- and to use a reduced-sized engine - the turbulence noise will be con-trolled. One of this fans is shown in Figure 4 (a), and Figure 4 (b) shows the fan matrix implement-ed for the tests.
(a) (b)
As it can be observed in Figure 4 (b), the fans of the matrix are controlled by a Kkmoon 8-channel relay interface board, controlled by the ARM microcontroller of a MyRIO platform. The interface board of the control system allows turning on and off the fans of the matrix independently, in order to simulate faulty fans in fault diagnosis tests.
3.2 Acoustic images
The tests developed to obtained acoustic images of a fan matrix have been carried out inside an anechoic chamber, using the system shown in [7]. The fan matrix has been placed 30 cm opposite the MEMS array. These tests have allowed the authors to obtain acoustic images of the fan matrix with only one of the fans working, as well as acoustic images of the whole fan matrix, i.e. with the nine fans working at the same time.
Before showing the obtained acoustic images, the acoustic signals received by the microphones of the array have been analysed in order to understand better the noise generated by the fans. It was observed that fan noise isn’t stationary or periodic and it shows a high harmonic around 1100Hz. Working with non-stationary signals is not ideal, so the authors decided to capture 1500 signals for each specific test, in order to obtain the averaged signal in each case and analyse it to obtain the averaged behaviour of the fans.
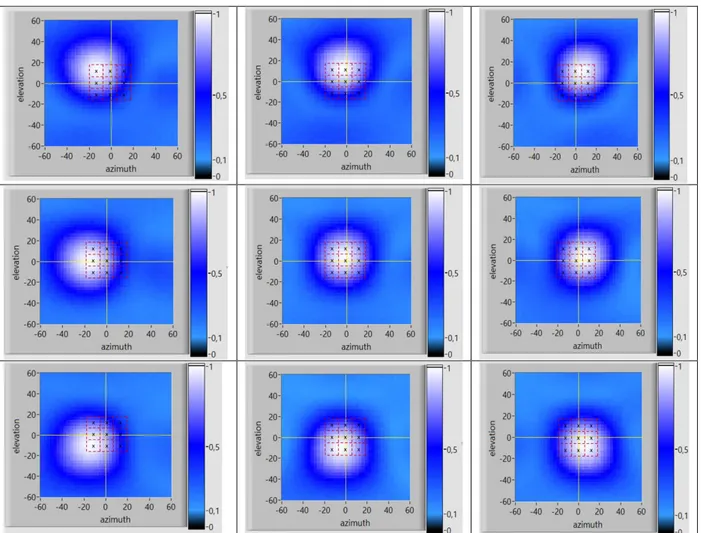
The acoustic images of each one of the 9 fans of the matrix running alone were obtained with us-ing the array of MEMS microphones together with wideband beamformus-ing techniques, usus-ing a work frequency of 1100Hz. For each fan, 1500 acoustic images were generated, in order to obtain 9 consistent averaged acoustic images, which are shown in Figure 6. Analysing these images, it can be observed that the centre of each image seems to be placed in the same position of the matrix where the real fan is (x).
These centres are the ones of the averaged acoustic images. For each fan, the centre of each of the 1500 acoustic images used to obtain the averaged one are shown in Figure 7 (a), where it can be observed that the centres of the acoustic images of each fan are scattered around the corresponding “averaged centre”.
(a) (b)
Figure 7. (a) Calculated centres of the acoustic images of each fan of the matrix running alone. (b) Real vs. Estimated centre coordinates
Thanks to the “averaged centres”, the positions of the fans in the matrix could be estimated. In Figure 7 (b), the “averaged centres” can be compared with the real ones. It can be observed that the estimated positions of the centres are rather near of the real ones, with errors lower than 2.5º. So, the averaged acoustic images of the fans could be used to estimate their positions.
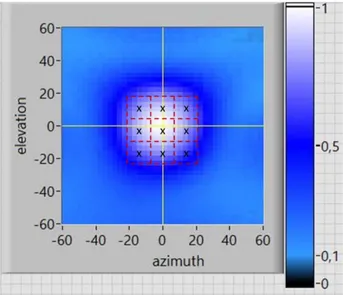
The last acoustic image that was obtained with the system based on the array of MEMS micro-phones was the one of the whole fan matrix. This acoustic image is shown in Figure 8. It can be observed that this image seems to be the acoustic image of an only one fan, which is exactly the objective of a fan matrix: several small fans working as a big one in order to produce a certain air flow.
3.3 Fault diagnosis
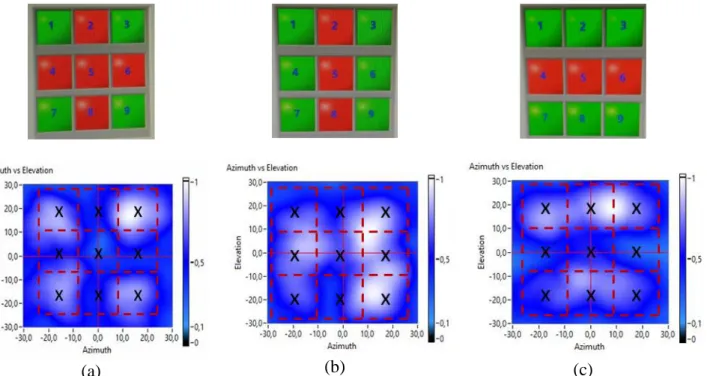
Some tests have been carried out, simulating a faulty fan matrix, i.e. with some fans working and the others damaged, in order to obtain the acoustic images of the fan matrix in these certain circum-stances. The fans of the matrix are controlled by the relay interface board, which allows to switch on and to switch off each fan independently. The first row in Figure 9 shows captures of the inter-face of the relay board, where a green square represents a working fan, and a red square represents a faulty one, i.e. a fan that has been switched off.
The second row in Figure 9 shows the acoustic images of three different faulty fan matrix situa-tions:
a) Only the fans on the corners of the matrix are working. b) The fans of the middle column of the matrix are faulty. c) The fans of the middle row of the matrix are faulty.
Analysing these images, it can be observed that if several fans of the matrix are not running, i.e. are faulty, the acoustic image reveals in some way this effect.
(a) (b) (c)
Figure 9. Acoustic images of faulty fan matrices
In Figure 9 (a), it can be observed that the acoustic image shows sound only in the positions of the fans that are working. In Figure 9 (b) and (c), the acoustic images show an absence of sound in the positions of the faulty fans, on the middle column in figure (b) and on the middle row in figure (c).
Some tests simulating a matrix with only one faulty fan have been carried out and the corre-sponding acoustic images have been obtained. The problem with these images is that they don’t reveal at a first glance if there is a faulty fan, as the images in Figure 9 do.
The fact that the acoustic images of matrices with several faulty fans reveal the faulty character of the matrix, the acoustic images of matrices with only one faulty fan would include information about the fault character of the matrix, although this information is not visible.
4. Conclusions
The results obtained in this study show that the acoustic system based on a planar array of MEMS microphones allows the acquisition of acoustic images of a fan matrix, as well as the acous-tic images of each fan individually. The averaged acousacous-tic images of the individual fans could be used to estimate their real position inside the matrix.
This work can be considered a previous step of a future study based on fault diagnosis of a fan matrix by means of the analysis of the acoustic images obtained with a MEMS microphone array using classification techniques based on machine learning.
For future work, it could be pointed that the tests carried out in this study must be widen with other tests including background noise or even objects near the assembly, in order to create surfaces where the sound generated by the fans could be reflected. These tests would simulate a more real operation situation, because an operative fan matrix it is not isolated of the surroundings, nor even placed inside an anechoic chamber.
A MyRIO platform is used associated to the fan matrix and the relay interface board because it includes an accelerometer that could be useful in the analysis of the acoustic signals obtained with the MEMS microphones of the array, in comparison with the vibrational signals obtained with the accelerometer.
Acknowledgements
This work has been funded by the Spanish research project SAM (MINECO: TEC 2015-68170-R).
REFERENCES
1 Van Trees, H. Optimum Array Processing: Part IV of Detection, Estimation and Modulation Theory, John Wiley & Sons: New York, USA (2002).
2 Brandstein M.; Ward D., Microphone arrays, Springer: New York, USA (2001).
3 Van Veen, B.D.; Buckley K.M. Beamforming: A Versatile Approach to Spatial Filtering. IEEE ASSP Magazine, 1988, 4-24, (1988).
4 Beeby, S. et al. MEMS Mechanical Sensors; Artech House Publishers: Norwood, MA, USA (2004).
5 Scheeper, P.R. et al. A review of silicon microphones, Sens Actuat A Phys, 44 (1), 1-11, (1994).
6 Siong Gan W., Acoustic Imaging: Techniques and Applications for Engineers, John Wiley & Sons: New York, USA (2012).
7 Izquierdo, A. et al. Design and Evaluation of a Scalable and Reconfigurable Multi-Platform System for Acoustic Imaging. Sensors, 16 (10), 1671, (2016).
8 National Instruments (2016). Acoustic System of Array Processing Based on High-Dimensional MEMS Sensors for Biometry and Analysis of Noise and Vibration. [Online] available: