E
ngineering
C
hemestry
Optical
R
esources
F
ood Technology
A
natomy
N
utrition
Journal-Bolivia
Indexing
Academic Google
ECORFAN Journal-Bolivia, Volume 1, Issue 1, July-December -2014, is a journal edited four- monthly by ECORFAN. 21 Santa Lucía street, Postcode: 5220. Libertadores –
Sucre (Bolivia) WEB:
www.ecorfan.org/bolivia/,[email protected] g. Editor in Chief: Ramos Escamilla- María. ISSN-On line: (in process) Responsible for the latest update of this number ECORFAN
Computer Unit.Escamilla
Bouchán-Imelda,Luna Soto-Vladimir. 21 Santa Lucía
street, Postcode: 5220. Libertadores -Sucre (Bolivia), last updated December 31, 2014.
The opinions expressed by the authors do not necessarily reflect the views of the editor of the publication.
It is strictly forbidden to reproduce any part of the contents and images of the publication without permission of the National Institute of Copyright.
ECORFAN-Bolivia
Directory
CEO
RAMOS ESCAMILLA- María, PhD.
CAO
SERRUDO GONZALES- Javier, BsC
Director of the Journal
ESPINOZA GÓMEZ- Éric, MsC
Institutional Relations
TREJO RAMOS-Iván, BsC
IGLESIAS SUAREZ- Fernando, BsC
Editing Logistics
DAZA CORTEZ- Ricardo, BsC
LARA RAMOS- Paola, BsC
HERNANDEZ VARGAS-Mariana, BsC
Designer Edition
(Instituto Politécnico Nacional), México
Enrique-NAVARRO FRÓMETA, PhD.
(Instituto Azerbaidzhan de Petróleo y Química Azizbekov), Rusia
David-BARDEY, PhD.
(University of Besançon), Francia.
Darío-IBARRA ZAVALA, PhD.
(New School for Social Research),U.S.
Amalia-COBOS CAMPOS, PhD.
(Universidad de Salamanca), España
Francisco-ALVAREZ ECHEVERRÍA, PhD.
(University José Matías Delgado), El Salvador.
Luis Felipe Beltrán Morales, PhD.
(Universidad de Concepción, Chile), Chile.
Claudia -BELTRÁN MIRANDA, PhD.
(Universidad Industrial de Santander- Colombia), Colombia
Enrique-ROCHA RANGEL, PhD.
(Oak Ridge National Laboratory),U.S.
(University of Iowa), U.S.
Joaquín-TUTOR SÁNCHEZ, PhD.
(Universidad de la Habana), Cuba.
José-VERDEGAY GALDEANO, PhD.
(Universidad de Granada), España.
María-SOLIS SOTO, PhD.
(Universidad San Francisco Xavier de Chuquisaca), Bolivia
Rodrigo-GOMEZ MONGE, PhD.
(Universidad de Santiago de Compostela), España.
Sergio-ORDÓÑEZ GUTIÉRREZ, PhD.
(Université Paris Diderot-Paris), Francia.
Tania-ARAUJO BURGOS, PhD.
(Universita Degli Studi Di Napoli Federico II), Italia.
Vladimir-SORIA FREIRE, PhD.
México
Eber-OROZCO GUILLÉN, PhD.
(Instituto Nacional de Astrofísica Óptica y Electrónica), México
María-SALAMANCA COTS, PhD.
(Universidad de Granada), España.
AH, PhD.
(Simon Fraser University), Canadá.
AG, PhD.
(Economic Research Institute - UNAM), México.
MKJC MsC.
(Universidad San Francisco Xavier de Chuquisaca), Bolivia.
MRCY, PhD.
(Universidad de Guadalajara), México.
MEC, PhD.
(Universidad Anáhuac), México.
AAB, PhD.
(Universidad Autónoma de Sinaloa), México.
EDC, MsC.
(Instituto Tecnológico y de Estudios Superiores de Monterrey), México.
JRB, PhD.
(Universidad Panamericana), México.
(Instituto de Biotecnología UNAM), México.
ACR, PhD.
(Universidad Nacional Autónoma de México), México.
ETT, PhD.
(CICATA-Instituto Politécnico Nacional), México.
FVP, PhD.
GHC, PhD.
JTG, PhD.
MMG, PhD.
(Instituto Politécnico Nacional-Escuela Superior de Economía), México.
FNU, PhD.
(Universidad Autónoma Metropolitana), México.
GLP, PhD.
(Centro Universitario de Tijuana), México.
GVO, PhD.
IGG, MsC.
(Centro Panamericano de Estudios Superiores), México.
TCD, PhD.
(Universidad Autónoma de Tlaxcala), México.
JCCH, MsC.
(Universidad Politécnica de Pénjamo), México.
JPM, PhD.
(Universidad de Guadalajara), México.
JGR, PhD.
(Universidad Popular Autónoma del Estado de Puebla), México.
JML, PhD.
(El Colegio de Tlaxcala), México.
JSC, PhD.
(Universidad Juárez del Estado de Durango), México.
LCL Ureta, PhD.
(Universidad de Guadalajara), México.
MLC, PhD.
(Centro de Investigación Científica y de Educación Superior de Ensenada), México.
MSN, PhD.
(Escuela Normal de Sinaloa), México.
MACR, PhD.
(Universidad de Occidente), México.
MAN, MsC.
(Universidad Tecnológica del Suroeste de Guanajuato), México.
MTC, PhD.
(Instituto Politécnico Nacional -UPIICSA), México.
MZL, MsC.
(Universidad del Valle de México), México.
MEC, PhD.
(Universidad Autónoma de San Luis Potosí), México.
NGD, PhD.
OSA, PhD.
(Universidad Tecnológica Emiliano Zapata del Estado de Morelos), México.
OGG, PhD.
(Universidad Autónoma Metropolitana), México.
PVS, PhD.
(Universidad Politécnica de Tecámac), México.
MJRH, PhD.
(Universidad Veracruzana), México.
SCE, PhD.
(Universidad Latina), México.
México.
VIR, PhD.
(Instituto Mexicano del Transporte), México.
WVA, PhD.
(Universidad Politécnica Metropolitana de Hidalgo), México.
YCD, PhD.
(Centro Eleia), México.
ZCN, MsC.
ECORFAN Journal-Bolivia is a research journal that publishes articles in the areas of:
E
ngineeringC
hemestryO
pticalR
esourcesF
ood TechnologyA
natomy andN
utrition.In Pro-Research, Teaching and Training of human resources committed to Science. The content of the articles and reviews that appear in each issue are those of the authors and does not necessarily the opinion of the editor in chief.
In Number 1st presented in Section of Engineering an article Relationship between renewable and non renewable electricity production and economic growth in Cameroon by CHIATCHOUA- C, PEGOU- S., MONTES- P., MEGNE- M. with adscription in the Tecnológico de Estudios Superiores de Chimalhuacán, Universidad de Dschang- Camerún, and Centro Universitario UAEM Texcoco respectively, in Section of Chemestry an article Effect of essential oil of cymbopogon citratus on physico-chemical properties, mechanical and barrier films of Chitosan by VÁZQUEZ- M., GUERRERO- J., MATA- M. with adscription in the Universidad de las Américas, in Section of Optical an article Intelligent system voice translator to a bolivian sign language by PACHECO- Carlos, CAMACHO- Francisco, LABRANDERO- Juan, with adscription in the Universidad Mayor Real y Pontificia de San Francisco Xavier de Chuquisaca,in Section of Resources an article Evaluation of constructs to integrate a legislative Code of Ethics in México by ARANGO- X., BALDEMAR- J.,
economic growth in Cameroon
CHIATCHOUA- C., PEGOU- S., MONTES- P., MEGNE- M.
Effect of essential oil of cymbopogon citratus on physico-chemical properties, mechanical and barrier films of Chitosan
VÁZQUEZ- M.., GUERRERO- J., MATA- M.
12-20
Intelligent system voice translator to a bolivian sign language
PACHECO- Carlos, CAMACHO- Francisco, LABRANDERO- Juan
21-29
Evaluation of constructs to integrate a legislative Code of Ethics in México
ARANGO- X., BALDEMAR- J.
30-48
Monitoring of contamination of microorganisms in local food outlets in the city of Sucre
GUMUCIO- Ricardo
49-54
Diabetes Mellitus 2 and its prevalence in physical health, oral and employment of teachers from the Autonomous University of Campeche
QUIJANO- Román, ROSADO- Graciela, CARRILLO- Olivia, AVILA- Román
55-69
Sodium and nitrite reduction in ham by home hydric methods
GÁLVEZ- F., SALINAS- Tania, FRANCO- Talía, NAVARRO- Gerardo, PAREDES- Adrian, RODRÍGUEZ- Lizbeth, ROSAS- M., SALCEDO- Paty, GALLEGOS- Saúl
70-79
Instructions for Authors
Originality Format
Relationship between renewable and non renewable electricity production and
economic growth in Cameroon
CHIATCHOUA- C.*†`, PEGOU- S.``, MONTES- P.```, MEGNE- M.``
`Tecnológico de Estudios Superiores de Chimalhuacán
``Universidad de Dschang- Camerún
```Centro Universitario UAEM Texcoco
Received January 10, 2014; Accepted June 27, 2014
The purpose of this study is to assess the long run relationship between electricity production and economic growth in Cameroon. This was done using the Johansen Cointegration test and the fully modified OLS method. Our results show that economic growth and electricity production are cointegrated thus has a long run association-ship. Furthermore the FMOLS output reveals that, electricity production from hydroelectricity plant (electricity produced from renewable source) significant and positively contribute to economic growth whereas electricity produced from oil (electricity produced from non-renewable source) negatively contribute to economic growth.
Johansen Cointegration Test, FMOLS, Cameroon, Electricity Production, Economic Growth.
Citation: Chiatchoua C, Pegou S., Montes P., Megne M. Relationship between renewable and non renewable electricity production and economic growth in Cameroon. ECORFAN Journal-Bolivia 2014, 1-1: 1-11
* Correspondence to Author (email: [email protected])
† Researcher contributing first author.
Chiatchoua C, Pegou S., Montes P., Megne M. Relationship
Introduction
Cameroon is a country situated in Central Africa. Its population growth has been increasing at an average yearly rate of 2.6% within the past two decades. As a result of increasing population, electricity consumption has also been increasing. The country is
endowed with a gigantic hydroelectric
potential, which places it second potential hydroelectric producer in Sub Saharan Africa after Democratic Republic of Congo. For the past three decades the country has been struggling to impulse sustainable economic growth, regardless of its hydroelectric potential to generate green and renewable energy, to supply industries in other to boost economic growth.
The recently construction projects of hydroelectric dams and that of thermal energy generators in Cameroon has been of great concern to businesses and to the government as well, most effectively due to the fact that for more than 20 years as from today, many companies in Cameroon have been operating under capacity due to rampant electricity outages resulting from unstable supply of electricity as a result of increasing demand,
droughts and crumbling of existing
installations. This has put the country into a difficult situation of social unrest as
unemployment among youths has been
increasing year after year. The government of Cameroon has engaged itself into heavy investment projects to build many dams with the prospect to soar electricity production, which are waiting to become fully operational.
Political debates are focused on the solution of economic growth and job creation in Cameroon, and some analyst of the civil society have been urging the government to encourage investment such that electricity supply should be increased through production. Thus arises three different views:
1) There is a bidirectional relationship between electricity consumption and economic growth.
2) Electricity consumption does not have a causal relationship with growth.
3) There is a uni-directional causal relationship between electricity consumption.
To understand this dilemma, we decided to look at the contribution of electricity production (renewable and non-renewable) to national output in Cameroon from 1975 to 2013. This leads us to ask the main question this paper is to resolve: Does electricity production influence economic growth in Cameroon? We then proceed to hypothesise on the research question by stating that: Ho: Electricity production from renewable sources positively impact on economic growth; while Electricity production from oil sources negatively impact on economic growth in Cameroon.
Then the Electric power transmission and distribution losses versus Electricity production from oil sources in Cameroon will be compared. After that we will end up with the Conclusion and recommendations.
An Overview of Electricity production and Economics Growth
Cameroon is blessed with numerous sources of electricity supply but most of these sources are not being used and in this cornucopia, there is the monopolization of a single source hydropower. Of all the electricity produced and sold in Cameroon, hydropower accounts for about 95%. Within the Sub-Saharan African states, Cameroon ranks second with a potential of about 55.2 GW per a producible potential of 294 TWH/year behind the Democratic Republic of Congo in hydropower production. Despite the heavy reliance on hydropower, only about 20% of Cameroonian has access to the grid network. Most of the people connected to the grid are urban residents while rural electrification in Cameroon remains on a staggering rate of less than 15% (Wirsliy, 2010).
Another principle source of energy used in Cameroon for electricity production is fuel which accounts for about 11% of the total electricity produced in the country. Cameroon is blessed with sunlight and where by the average sunlight intensity is 2,327.5 TWH. This gives the country a good potential of biomass with its 20 million hectares of tropical forest, and its natural gas reserve is estimated at 110 thousand million . Despite these numerous sources, little investments have been made to develop their uses (Egbe, 2010).
Presently, Cameroon has three
hydropower production dams, namely
Songloulou, Edea and Lagdo with respective installed generating capacities of 387 MW, 263MW, 72 MW. There are also three other dams devoted to reinforce the Edea and Songloulou plants. These three retaining dams are Mbakaou constructed on river Djerem, Bamendjin constructed on river Noum and Mape constructed on river Mbam. The three retaining dams constructed on the main tributaries of the river Sanaga are aimed to augment the power generated of the Edea and Songloulou power stations during the period of low water mark. Due to the high cost of production, transportation and distribution of electricity during drought period many Cameroonians are been disconnected from the grid due to price increment by the energy company AES-SONEL Cameroon (Tchouaha, 2012).
Electric power transmission and distribution losses versus Electricity production from oil
sources.
Table 1 Electric power transmission and Distribution losses vs Electricity production from oil Sources
This graph shows the frequency of electricity power transmission and distribution losses compare to that of electricity production from oil sources from 1975 to 2013. We have decided to divide this histogram into three parts that is: 0.00E+00 5.00E+08 1.00E+09 1.50E+09 1 9 7 5 1 9 7 8 1 9 8 1 1 9 8 4 1 9 8 7 1 9 9 0 1 9 9 3 1 9 9 6 1 9 9 9 2 0 0 2 2 0 0 5 2 0 0 8 2 0 1 1
Electric power transmission and distribution losses (kWh) (ELPO) vs Electricity production from oil
sources (kWh) (ELPO)
Chiatchoua C, Pegou S., Montes P., Megne M. Relationship
1) 1975 to 1980 (electricity power
transmission and distribution losses is almost equal to electricity production from oil sources)
2) 1981 to 2006 (electricity power
transmission and distribution losses is more than thrice as large electricity production from oil sources)
3) 2007 to 2013 (electricity power
transmission and distribution losses is almost equal to three quarter of electricity production from oil sources)
From this graph it is evident that electric power transmission and distribution losses have been extremely greater than electricity production from oil sources in Cameroon. It is only as from 2006 that the situation was reversed; yet electricity production from oil sources has almost never account for twice of electricity losses, to overshadow these losses. This led us to say electric power transmission and distribution losses may be so important in Cameroon such that it could wipe out the effect of electricity production from oil sources.
Literature review
A majority of studies found that there exist a unidirectional causality between electricity consumption and economic growth, other studies such as Ogundipe and Apata (2013) , Bildirici and Kayikci (2012), Gurgul and Lach (2011), Hu and Lin (2013), and even Nazlioglu et al. (2014) found that there was bidirectional causality between electricity consumption and economic growth.
Another sets of studies such as Altinay and Karagöl (2005), Shiu and Lam (2004), and Atif and Siddiqi (2010) have found that there was unidirectional causality from electricity consumption to economic growth, on the opposite other studies going from Ozun and Cifter (2007), Ciarreta and Zarraga (2007), Hye and Riaz (2008), Adom (2011) to Akinwale et al. (2013) found that there was unidirectional causality from economic growth to electricity consumption. The findings of Asaduzzaman and Billah (2008) also found positive relationship between energy consumption and economic growth for Bangladesh using data spanning from 1994– 2004 and reported that higher level of energy use led to higher level of growth. The study conducted by Lean and
Shahbaz (2012) claim that electricity
consumption has positive impact on economic growth and bi-directional Granger causality has been identified between electricity consumption and economic growth in Pakistan. Akinlo (2009) conducted a study in Nigeria to investigate relationship between economic growth and electricity consumption during the period 1980 to 2006. The result exhibits that there is unidirectional Granger causality running from electricity consumption to real GDP and suggested use of electricity could
stimulate the Nigerian economy
(Masuduzzaman, 2013). Relatively few studies such as Yu and Hwang (1984) and Aktaş and Yılmaz (2008) have reached there
were no causality between electricity
The authors found no unique evidence of long-run equilibrium relationship between electricity consumption and economic growth in Iran, Morocco and Syria. However, the study found the existence of level relationship between electricity consumption and economic growth for Egypt, Israel, Oman, and Saudi Arabia. The test of causality revealed a one- way short-run Granger causality from economic growth to electricity consumption in Israel. In Egypt, Oman, and Saudi Arabia, the causality test revealed the existence of one-way both short and long-run Granger causality from electricity consumption to economic growth. Generally, the authors concluded that their results suggest that there is weak evidence on the long-run and causal relationship between electricity consumption and economic growth in MENA countries (Adom, 2011). It therefore becomes evident that the direction of causalit y between electricity consumption or production depends mostly on the country in which the study is undertaken. Thus the existing literature reveals that due to the application of different econometric methodologies and different sample sizes, the empirical results are very mixed and even vary for the same country and are not conclusive.
Data and Methodology
In this section we present first of all the choice of the model, the data collection process, the statistical tests and the results and interpretations.
Choice of model
The model we use in this study is a development of the well-known Cobb-Douglas model. This model has been chosen because it enables us to assess the elasticity of economic growth relative to electricity production.
We decided to look at electricity production impact on economic growth rather than consumption because very few studies have related electricity production to economic growth. Cobb-Douglas from their model of economic growth propounded that:
They develop this model in such a way as to explain that, in an economy there are two main factors that are substitutable (capital and labour), and they significantly influence economic growth. Their model also includes the productivity factor A, which can deter or boost economic growth, thereby playing as a counter force to one of the two main substitutable factors (capital and labour); there come the introduction of electricity production as an element of the productivity factor to fit into our model. Therefore we can extend the Cobb-Douglas model to become:
(2)
We introduce the logarithm function in other to make equation 2 linear in the parameters, so that we can use the regression technique to determine the elasticity of economic growth on electricity production. Therefore we obtain:
(3)
Where
is national output in current local currency (CFA Franc), is the productivity factor less electricity production component, is Gross fixed capital formation in current local currency (CFA Franc), is the total labour force, is Electricity production from
renewable sources (kWh) and is
Chiatchoua C, Pegou S., Montes P., Megne M. Relationship
Data collected process
The data we used in this study are collected from the online world development indicator database. We used Eviews 8 econometric software to analyse the data and to perform the fully modified ordinary least squares regression technique.
Statistical test Unit root test
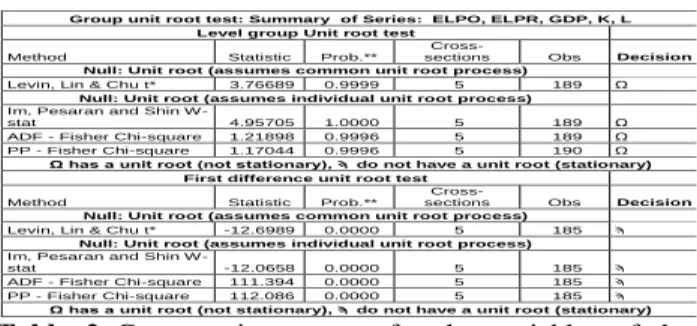
Table 2 Group unit root test for the variables of the model
From table 2 we can conclude that the series are not stationary at level, so we proceed to look if they are at first difference, which turns out to be conclusive; therefore we proceed to test for the cointegration of the unit rooted variables, this is done using the Johansen cointegration test, we choose to use the panel unit root test rather that the individual unit root test because recent literature suggests that panel-based unit root tests have higher power than unit root tests based on individual time series Levin et.al (2002).
Cointegration test
It is well known that many economic time series are difference stationary. In general, a regression involving the levels of these I(1) series like in this study, will produce misleading results, with conventional Wald tests for coefficient significance spuriously showing a significant relationship between unrelated series (Phillips 1986).
Engle and Granger (1987) note that a linear combination of two or more I(1) series may be stationary, or I(0), in which case we say the series are cointegrated. Such a linear combination defines a cointegrating equation
with cointegrating vector of weights
characterising the long-run relationship between the variables. We will work with the standard triangular representation of a regression specification and assume the existence of a single cointegrating vector (Hansen 1992b, Phillips and Hansen 1990). Consider the ( dimensional time series vector process , with cointegrating equation (4)
Where deterministic
trend regressors and the stochastic regressors are governed by the system of equations:
ET (5)
The -vector of regressors enter into both the cointegrating equation and the regressors equations, while the -vector of
are deterministic trend regressors which are included in the regressors equations but excluded from the cointegrating equation (if a non-trending regressor such as the constant is present, it is assumed to be an element of so it is not in ).
From table 5 at the appendix we performed the Johansen cointegration test to assess if the series are cointegrated, that is to know if the variables of interest have long run association-ship. We came out with the conclusion that given the result of the Trace test and the Max-eigenvalue test statistics values, it is evident that the null hypothesis of no cointegration of the variable is rejected at 5%, stipulating the presence of at most 2 cointegrated equations.
Group unit root test: Summary of Series: ELPO, ELPR, GDP, K, L Level group Unit root test
Method Statistic Prob.**
Cross-sections Obs Decision Null: Unit root (assumes common unit root process) Levin, Lin & Chu t* 3.76689 0.9999 5 189 Ω
Null: Unit root (assumes individual unit root process) Im, Pesaran and Shin W
-stat 4.95705 1.0000 5 189 Ω ADF - Fisher Chi-square 1.21898 0.9996 5 189 Ω PP - Fisher Chi-square 1.17044 0.9996 5 190 Ω
Ω has a unit root (not stationary), Ϡ do not have a unit root (stationary) First difference unit root test
Method Statistic Prob.**
Cross-sections Obs Decision Null: Unit root (assumes common unit root process) Levin, Lin & Chu t* -12.6989 0.0000 5 185 Ϡ
Null: Unit root (assumes individual unit root process) Im, Pesaran and Shin W
-stat -12.0658 0.0000 5 185 Ϡ
ADF - Fisher Chi-square 111.394 0.0000 5 185 Ϡ
PP - Fisher Chi-square 112.086 0.0000 5 185 Ϡ
To be able to come out with reliable long run estimate of the parameters given that the variables of interest are cointegrated at first difference I (1), the Fully Modified Ordinary Least Square regression is employed. The estimator employs preliminary estimates of the symmetric and one-sided long-run covariance matrices of the residuals. Let be the residuals obtained after estimating
the may be obtained indirectly as from the levels regressions
.
Phillips and Hansen (1990) propose an estimator which employs a semi-parametric correction to eliminate the problems caused by
the long run correlation between the
cointegrating equation and stochastic regressors innovations. The resulting Fully Modified OLS (FMOLS) estimator is asymptotically unbiased and has fully efficient mixture normal asymptotic allowing for standard Wald tests using asymptotic Chi-square statistical inference.
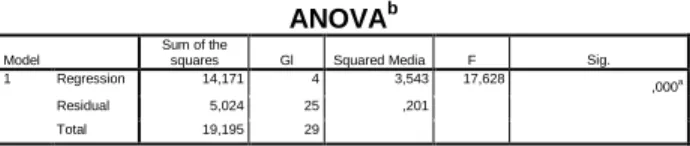
Results and interpretation
(6)
The estimated coefficients are presented in table 6. Of central importance are the
coefficients which imply that the
estimated cointegrating vector for and
electricity production from renewable and non renewable are 1.73, and -0.013. The P-values of all these estimated parameters are highly statistically significant as they portray values equal to zero, except for the case on non-renewable electricity elasticity which is statistically significant at the threshold of 5%.
We proceed to test if effectively the elasticity coefficient is different from zero, since it is weakly significant. This is done using the Wald test as can be seen on table 10, from which we are able to reject the null hypothesis of the parameter being equalled to zero. Therefore we conclude that electricity production from non-renewable sources do contribute negatively to economic growth in Cameroon.
The Durbin-Watson statistic is 1.64 which is closed to 2, as an indication of the absence of autocorrelation of the unobserved parameter and the independent variables; but we cannot rely solely on this result in the case of FMOLS Pedroni (2000); without further investigation so we proceed, with the VIF test on table 9, to conclude that their centred values are all below 10 as an indication of the absence of multi-collinearity among the variables, which confirm the absence of serial correlation. Also the fit is very strong with a value of 98.4% to indicate that the independent variables of our model explain national output variable in Cameroon with an accuracy 98.4% as can be seen on table 6 and table 7.
Chiatchoua C, Pegou S., Montes P., Megne M. Relationship Therefore electricity production has a
positive relationship with economic growth depending upon the source of electricity production in Cameroon. Yet we want to be sure if there is causality between these variables of interest and economic growth in Cameroon, so we proceed with the granger causality test. The results are on table 8, from which we conclude that there is no causality between electricity production and economic growth in Cameroon. But there exist unidirectional causality going from GDP to electricity production from non-renewable sources. The test of causality shows that it is national output that causes electricity production from non-renewable source, meaning that the country needs to use a good portion of its output to convert into electricity of non-renewable sources, thereby playing as a counter force to economic growth.
Conclusion and recommendations
The main objective of this study is to question the contribution of electricity production on economic growth in Cameroon between 1975 and 2013. From the ongoing, it is evident that globally taken electricity production contributes significantly and favourably to economic growth in Cameroon.
Therefore it should be reminded that electricity is being produced from two main sources in Cameroon (Electricity production from oil sources and Electricity production from renewable sources). Our results show that electricity produced from oil sources impact significantly and negatively on growth in Cameroon, while electricity produced from hydroelectricity plan (Electricity production from renewable sources) significantly and positively impact on economic growth in Cameroon.
Though electricity production
significantly impact on economic growth in Cameroon, we found that it does not cause economic growth. The causality goes instead from economic growth to electricity production from non-renewable sources, proving that the government of Cameroon is under using its resources by allocating a consistent portion of its national output to produce electricity from non-renewable sources, which in return contributes to deter economic growth in the country. This conclusion and remarks drive us to recommend to policy makers to reduce resources allocated to the production of electricity from oil sources and convert it into investment on solar energy which is abundant and less costly to be produced in Cameroon. It
has been noticed that Electric power
transmission and distribution losses for the past three decades has been accounting for an average of 14% of electricity production in Cameroon, this should be reduced. To be done, the electricity distribution and transportation department should work to reduce these losses by using well adapted cables and logistic materials for transportation purposes; and also to constantly checking the plants and machineries (such as poles and cables, transformers etc.) in such a way as to replace them as soon as before they start showing signs of complete worn out. Most importantly the electricity regulation board from its French acronym (Agence De Régulation De L’énergie
At last but not the least we recommend that the cost of domestic electricity which cost about 50% more as compare to unit cost of industrial connectivity should be reduced, in other to enable the rural population and the greatest portion of the population to have access to electricity, which would definitely improve standard of living and create more jobs among youths.
Due to this we expect that since the government of Cameroon is claiming to work in other to boost economic growth in other to be two digits in the coming years such as to become an emerging economy is a near future, it has to augment its production of renewable electricity such that the percentage increase in production should be around 5%.
References
Adom, P, K. (2011), “Electricity Consumption-Economic Growth Nexus: The Ghanaian Case”, International Journal of Energy Economics and Policy, Vol. 1, No. 1, pp. 18-31.
Akinlo, A.E. (2009), “Electricity Consumption and Economic Growth in Nigeria: Evidence from Co-integration and Co-feature Analysis”, Journal of Policy Modeling, Vol. 31, pp. 681– 693.
Akinwale, Y., Jesuleye, O., and Siyanbola, W., (2013), Empirical Analysis of the Causal Relationship between Electricity Consumption and Economic Growth in Nigeria, British Journal of Economics, Management & Trade, 3(3), pp. 277-295.
Aktaş, C. and Yılmaz, V., (2008). Causal Relationship between Electricity Consumption and Economic Growth in Turkey, ZKÜ Sosyal Bilimler Dergisi, 4(8), pp. 45-54.
Altinay, G., and Karagol, E., (2005), Electricity consumption and economic growth: evidence from Turkey, Energy Economics 27, 849-856.
Asaduzzaman, M., Billah, A.H.M., (2008), Emerging Issues in Bangladesh Economy: A Review of Bangladesh’s Development 2005– 06, Chapter 14: Energy for future Bangladesh; Centre for Policy Dialogue (CPD), pp. 361– 392.
Atif, S.M., Siddiqi, M.W., (2010), The Electricity Consumption and Economic Growth
Nexus in Pakistan: A New Evidence,
http://www.econstor.eu/handle/10419/65688 (20.01.2014).
Bildirici, M, E.; and Kayıkçı, F. (2012), "Economic growth and electricity consumption in former Soviet Republics," Energy Economics, Elsevier, vol. 34(3), pages 747-753.
Ciarreta, A., and Zárraga, A., (2007), Electricity consumption and economic growth: evidence from Spain, BILTOKI 2007-01, Universidad Del País Vasco, pp.1-20.
Egbe Tah Franklin (2010), AES-Sonel
Cameroon.
Engle, R. F., and C. W. J. Granger (1987).
“Co-integration and Error Correction:
Representation, Estimation, and Testing,” Econometrica, 55, 251-276.
Chiatchoua C, Pegou S., Montes P., Megne M. Relationship Hansen, Bruce E., (1992b), “Tests for
Parameter Instability in Regressions with I(1) Processes,” Journal of Business and Economic Statistics, 10, 321-335.
Hu, X. and Lin., X, (2013). Study of the Relationship between Electricity Consumption and GDP Growth in Hainan International Tourism Island of China. Research in World Economy, 4(1), pp. 109- 115.
Hye, Q.M.A. and Riaz, S., (2008), Causality between Energy Consumption and Economic Growth: The Case of Pakistan, The Lahore Journal of Economics, 13(2), pp. 45-58.
Lean, H. H. and Shahbaz, M. (2012), “The dynamics of electricity consumption and economic growth: A revisit study of their causality in Pakistan”, Energy, 39, 146-153.
Levin, A., C. F. Lin, and C. Chu (2002). “Unit Root Tests in Panel Data: Asymptotic and
Finite-Sample Properties,” Journal of
Econometrics, 108, 1–24.
Masuduzzaman, M., (2013), “Electricity
Consumption and Economic Growth in
Bangladesh: Co-integration and Causality Analysis”. Research Study Series No. – FDRS.
Nazlioglu, S., Kayhan, S. and Adiguzel, U., (2014). Electricity Consumption and Economic Growth in Turkey: Cointegration, Linear and Nonlinear Granger Causality, Energy Sources, Part B: Economics, Planning, and Policy, 9:4,
pp. 315-324, DOI:
10.1080/15567249.2010.495970.
Ogundipe, A.A., Apata, A., (2013), Electricity Consumption and Economic Growth in Nigeria. Journal of Business Management and Applied Economics, 2(4), pp. 1-14.
Ozturk, I., Acaravci, A., (2011), Electricity
consumption-real GDP causality nexus:
Evidence from ARDL Bounds testing approach for 11 MENA countries. Applied Energy, 88(8), 2885-2892.
Ozun, A., Cifter, A., (2007), Multi-Scale Causality between energy consumption and GNP in Emerging Markets: Evidence from Turkey, Investment Management and Financial Innovations, 4(2), pp. 60-70.
Pedroni, Peter (2000), “Fully Modified OLS for
Heterogeneous Cointegrated Panels,” in
Baltagi, B. H. ed., Nonstationary Panels, Panel Cointegration and Dynamic Panels, 15, Amsterdam: Elsevier, 93–130.
Phillips, Peter C. B. and Bruce E., Hansen (1990), “Statistical Inference in Instrumental Variables Regression with I(1) Processes,” Review of Economics Studies, 57, 99-125.
Phillips, Peter C. B. and Hyungsik R. Moon (1999), “Linear Regression Limit Theory for Nonstationary Panel Data,” Econometrica, 67, 1057-1111.
Phillips, Peter C. B. and Mico Loretan (1991), “Estimating Long-run Economic Equilibria,” Review of Economic Studies, 59, 407-436.
Shiu, A., Lam, P.L. (2004), Electricity Consumption and Economic Growth in China. Energy Policy 32, 47-54.
Wirsliy Emannuel Binyug. (2010), “Energy and climate change campaigner”, Global village Cameroon.
Effect of essential oil of cymbopogon citratus on physico-chemical properties,
mechanical and barrier films of Chitosan
VÁZQUEZ- M. *†, GUERRERO- J., MATA- M.
Departamento de Ingeniería Química, Alimentos y Ambiental, Universidad de las Américas Puebla. Ex hacienda Sta. Catarina Mártir S/N, San Andrés, Cholula, Puebla. C.P. 72810.México
Received January 21, 2014; Accepted July 3, 2014
The effect of essential oil (AE) lemongrass (Cymbopogon citratus) at concentrations of 0.05, 0.1 and 0.25% by physico-chemical, mechanical and barrier properties on chitosan films was investigated. The results showed that films made with the essential oil of Cymbopogon citratus at concentrations of 0.1 and 0.25% Tween show a significant impact on the film thickness with respect to control and films with 0.05% AE. Chitosan films with essential oil and Tween 20 showed an increase in the solubility values from control. The addition of the essential oil on chitosan films reveals an effect on the values of tensile strength and elongation. The addition of the essential oil of Cymbopogon citratus stable in the properties of water vapor permeability of films made based on Chitosan.
Edible Films, Chitosan, Cymbopogon Citratus, Mechanical Properties, Barrier Properties.
Citation: VÁZQUEZ- M., GUERRERO- J., MATA- M. Effect of essential oil of cymbopogon citratus on
physico-chemical properties, mechanical and barrier films of Chitosan. ECORFAN Journal-Bolivia 2014, 1-1:12-20
* Correspondence to Author (email: [email protected])
† Researcher contributing first author.
Introduction
The Cymbopogon citratus, commonly known as lemongrass, is a plant that is cultivated in most tropical and subtropical countries, belongs to the grass family, is consumed as aromatic beverage and is used in traditional medicine (Schaneberg and Khan, 2002). Wannissorn et al. (1996) reported that citral is the main active component of lemongrass oil, giving it a characteristic odor (Parikh and Desai, 2011). Studies have shown that some components of the oil have antimicrobial effects (Bassolé et al., 2011) and antifungal (Wannissorn et al., 1996; Sánchez-García et al., 2007; Nguefack et al., 2009); in this context the essential oil of Cymbopogon citratus has been added in formulations of chitosan films (Ojagh et al., 2010).
Although some AE have been shown to provide a positive effect in the mechanical and water vapor permeability properties in edible films (Souza et al, 2011;.. Abdollahi et al, 2012), there is still little information (Peng et al ., 2013) to be added in chitosan films. To consider an edible film of good quality should have low water vapor permeability and good mechanical properties in addition to preventing moisture loss or absorption of water through the food matrix (Dotto et al., 2011).
Currently, chitosan is a polymer that plays an important role in the global economy, as it is biocompatible, biodegradable, edible and antimicrobial (Martelli et al., 2013). It also has the ability to form films that are used in preserving fruits and vegetables, (Jiang et al, 2011;. Mura et al, 2011;. Jirukkakul, 2013), which have low oxygen permeability (Moreno Osorio et al, 2010;. Kim et al., 2003; and Korkhov Kerch, 2010;. De Moura et al, 2011), however the main drawback of their high permeability is water vapor, which could be improved by adding components such as AE (Cháfer et al, 2012;. Krkic et al, 2012.).
Target
The purpose of this study was to evaluate the physicochemical, mechanical and barrier properties of chitosan films adding citratus
lemongrass essential oil at different
concentrations.
Materials and methods Materials
Chitosan, commercial grade, deacetylation greater than 80% and less than 0.5% insoluble material, glycerol and acetic acid were purchased from Sigma-Aldrich, St. Louis, USA The Cymbopogon citratus was acquired from the coarse center of Puebla.
Extraction of essential oil
The plants were dried at room temperature for one week, extending in trays, turning three times daily for ventilation and accelerate
drying, preventing the growth of
microorganisms. The essential oil of
Cymbopogon citratus was obtained by the method of hydrodistillation from 50 g of plant material, the extraction time was 60 minutes (Baizabal, 2010).
Preparation of the film forming solution
Filming
Films were formed by the casting technique used by Eum et al. (2009), 200 mL of the chitosan solution was emptied containers in nonstick 20 x 20 cm and dried at 30 ° C for 48 h. Once dried, they were detached from the plate by keeping them at a relative humidity of 50 ± 5% for 48 hours to be analyzed subsequently. Each treatment was performed in triplicate
Film thickness
The thickness of the films was measured with a micrometer Bag (Mitutoyo No. 2412F, USA) with a resolution of 0.001 in. The films were measured in 8 points of the same sample was considered the average value.
Solubility
A modified method Andreuccetti et al. (2011) was used to measure the solubility of the film; pieces of film (2 x 2 cm) were cut dried at 70 ° C for 24 to 18 h in Hg for the initial dry mass. The films were placed in beakers containing 50 mL of 30 mL distilled water. The beakers were covered with plastic and stored at room temperature for 24 h. Then the remaining water in the beakers was discarded and the residual film was rinsed with distilled water. Waste film pieces were dried at 70 ° C to 18 in Hg to determine the dry mass. The solubility was calculated using the following equation:
(1)
Where: Mi and Mf are the initial and final mass of sample in grams.
Mechanical Properties
Tensile properties were determined using a model TA-TX2 texture analyzer (Texture Technologies Corp., USA) according to the method of Leerahawong et al. (2011) with some modifications. The films were cut into squares of 9 x 9 cm parameters for tensile strength, plastic circular cell diameter of 3.9 cm were used to maintain the fixed and stretched films. Strips of 6 x 1 cm were used to determine the percent elongation at break. For measuring the parameters described above a load cell of 25 kg, a cylindrical probe with diameter 0.4 cm, at a speed of 1 mm / s and the distance traveled by the needle was 20 mm was used. The tensile strength and elongation percentage were calculated using the following equations:
(2)
Transversal area= Film thickness(mm) x film width (mm)
Where f is the breaking force (N) and A is the cross sectional area of the film in m2.
(3) Where: L is the increase in length in the breaking point (mm) and L is the length of 20 mm initial attachment.
Water vapor permeability
Weights were recorded every two hours for ten hours. Weight change of PS is plotted against time, the slope of each line by linear regression were calculated. The coefficient of water vapor transmission (WVTR) was calculated from the slope (gh-1) divided by the cell area (cm2), The permeaza WVTR was obtained by dividing the difference of water vapor pressure through the film (g / h.cm2.Pa). Thickness (mm) was measured and this determination permeability (WVP) (g.mm/h.cm2.kPa) was calculated. Three replicates were performed for each treatment.
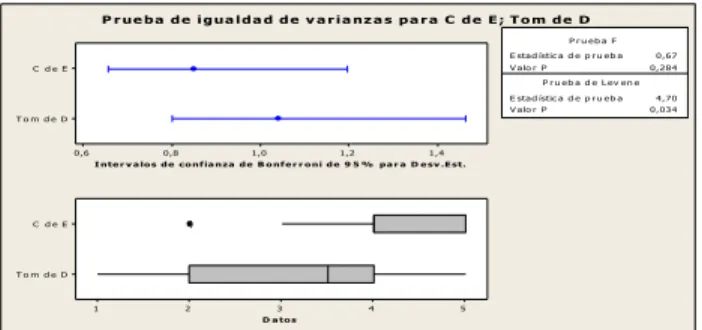
Statistical Analysis
An analysis of variance and Tukey tests were performed to assess differences between treatment means using the Minitab 16 software (LEAD Technologies Inc., NJ). A P <0.05 was considered statistically significant.
Results and discussion Solubility
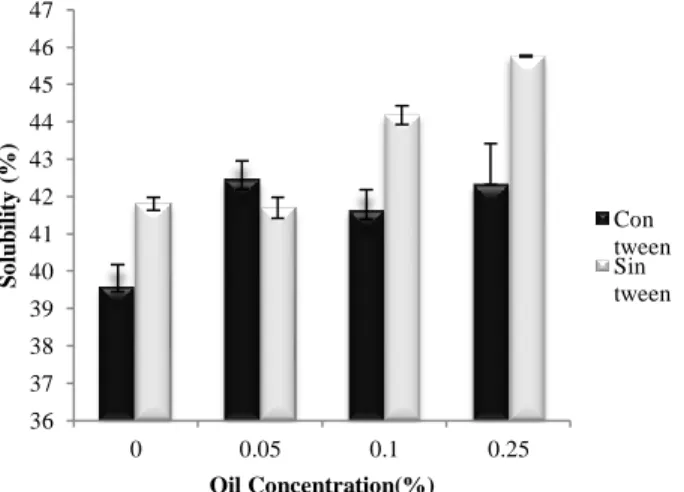
Edible films solubility is an important feature because it can influence the stability of the film in humid environments. The films made without tween 20, showed increased solubility values with increasing concentration of AE, presented the highest value of 45,759 ± 0021 at a concentration of 0.25%, as shown in Graphic 1. It showed a decrease solubility values in control and film AE 0.05%, this behavior may be attributed to the effects of crosslinking between the chitosan and the AE (Peng et al., 2013). Movies with tween AE showed increased solubility values from control. This is attributed to the weak interactions tween chitosan with AE, oil droplets migrate to the surface of the film, the film contacting with water the oil droplets which are in the surface of the film are released in the water, increasing the contact area of the film with water leading to increased solubility in the film, this effect was reported by Zhong and Li in 2011.
Significant difference (p <0.05) was found in films made with 0.05, 0.1 and 0.25% tween 20 with respect to control. In films made without tween at concentrations of 0.1 and 0.25% AE significant difference (p <0.05) was observed compared to the control and movies with 0.05% AE. The values obtained in this study are similar to those reported by Rhim et al., (1997) based films carrageenan. Higher solubility values of 92.3 ± 1.3 to 97.3 ± 1.5 were reported by Moura et al., (2011) films based on cellulose with chitosan. Moreover Rawdkuen et al., (2012) reported values of 43.96 ± 2.57 to 57.51 ± 2.04 in gelatin based films.
Graphic 1 Solubility of Chitosan films with
essential oil of Cymbopogon citratus at concentrations of 0, 0.05, 0.1 and 0.25 with and without Tween AE. a-c
Different letter indicates significant difference between treatments, determined by the Tukey test (P0.05).
Elongation
Elongation is a measure of the stretchability of the film before breaking; this property is related to the intermolecular forces of the film. (Atares, et al., 2010).
36 37 38 39 40 41 42 43 44 45 46 47
0 0.05 0.1 0.25
In Graphic 2 a significant (p <0.05) is observed in the elongation values by increasing the concentration of AE in films made with tween, indicating a loss of the macromolecular mobility. Sánchez-González et al., 2010; Ojagh et al., 2010; Peng and Li, 2014, reported that the elongation at break decreases on chitosan films by incorporating essential oils of bergamot, cinnamon, lemon and thyme, these authors report that chitosan composition, the plasticizer type and the presence of surfactants have an effect on the mechanical properties of the films. In films made without tween increased elongation values by increasing the oil concentration from 0.1 to 0.25% present. Higher elongation values were obtained by Leerahawong et al., 2011, in protein-based films obtained from squid, because the formulation of the film-forming solution.
Graphic 2 Elongation chitosan films with
essential oil of Cymbopogon citratus at concentrations of 0, 0.05, 0.1 and 0.25 of EO with and without Tween. a-c
Diferent letters indicates significant difference between treatments, determined by the Tukey test (p ˂ 0.05).
Tensile strength
The effect of increasing concentrations of AE in films with and without Tween shown in Graphic 3, the results showed a decrease in the values of tensile strength with increasing concentration of AE, with and without Tween. This behavior is considered because of a strong interaction between chitosan and AE producing a crosslinking effect, decreasing the free volume and molecular mobility of the polymer. Having the lowest value of 0.5960 ± 0.011 in films with 0.25% Tween EO, showing significant difference (p <0.05) compared to films made with 0.05 and 0.1% of EO. Peng, et al., (2013) reported a decrease in the TS values AE lemon incorporate chitosan films relative to the control. However Ojagh, et al., (2010) reported an increase in TS values by adding cinnamon AE films, this behavior is attributed to the type of chitosan, plasticizer type and interactions between the AE and chitosan.
Graphic 3 Tensile Strength on films of
chitosan with essential oil of Cymbopogon citratus at concentrations of 0, 0.05, 0.1 and 0.25 of EO with and without Tween. a-c
Diferent letters indicates significant difference between treatments, determined by the Tukey test (p ˂ 0.05).
0 5 10 15 20 25 30
0 0.05 0.1 0.25
El o n g a ti o n (% ) Oil Concentration(%) Con tween Sin tween 0 0.2 0.4 0.6 0.8 1 1.2 1.4 1.6 1.8
0 0.05 0.1 0.25
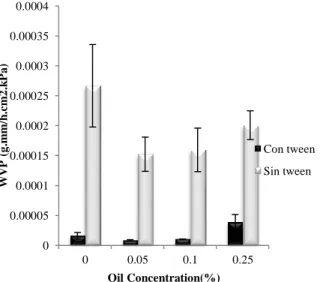
Water vapor permeability
One of the main functions of edible films is to minimize moisture transfer between the food and the atmosphere surrounding it. Therefore the water vapor permeability should be as low in order to increase the shelf life of the food (Hosseini et al., 2013). Lower permeability values are presented in movies with tween compared with the values displayed in movies without tween. AE adding chitosan films without tween improved barrier properties to water vapor in the films, this effect was reported by Ojagh et al., (2010) AE chitosan films with cinnamon. Movies made with 0.05% Tween AE and had lower permeability values of 0.8309 ± 0.11 × 10⁻⁵ g.mm/h.cm2.kPa.
Graphic 4 Water vapor permeability in
chitosan films with essential oil of
Cymbopogon citratus at concentrations of 0, 0.05, 0.1 and 0.25 of EO with and without Tween. a-b
Diferents letters indicates significant difference between treatments determined by the Tukey test (p ˂ 0.05).
Conclusions
This study shows that chitosan films formulated with essential oil of Cymbopogon citratus at concentrations of 0.25% Tween have a significant effect on the film thickness. Films with AE and tween showed increased solubility values from control. A significant decrease in elongation values to increase the concentration of AE in films made with Tween was shown. Adding chitosan films AE has an effect on the values of tensile strength. The essential oil of
Cymbopogon citratus showed stability
properties of water vapor permeability of films made based on chitosan. Chitosan is a biopolymer promising for food packaging, the moisture sensitivity can be improved by adding AE of Cymbopogon citratus.
References
Abdollahi, M., Rezaei, M. y Farzi, G. (2012). Improvement of active chitosan film properties with rosemary essential oil for food packaging.
International Journal of Food Science and Technology, 47(4), 847–853.
Andreuccetti, C., Carvalho, R., Galicia, G. T., Martínez, B. F. y Grosso, C. R. F. (2011). Effect of surfactants on the functional properties of gelatin-based edible films. Journal of Food Engineering. 103(2), 129–136.
ASTM (American Society for Testing and Materials). (1996). Standard test methods for water vapor transmission of materials E96–80. En: Annual book of ASTM. Philadelphia, PA. pp: 771–778.
Atarés, L., Bonilla, J. y Chiralt, A. (2010). Characterization of sodium caseinate-based edible films incorporated with cinnamon or ginger essential oils. Journal of Food Engineering. 100, 678-687.
0 0.00005 0.0001 0.00015 0.0002 0.00025 0.0003 0.00035 0.0004
0 0.05 0.1 0.25
W
V
P
(g
.m
m
/h
.c
m
2
.k
P
a
)
Oil Concentration(%)
Baizabal, C. R. H. (2010). Evaluación de la capacidad antioxidante y antimicrobiana del aceite esencial y del polvo de romero (rosmarinus officinalis l.) en queso fresco de vaca. Tesis de Licenciatura. Universidad de las Américas, Puebla. México.
Bassolé, I. H. N., Lamien-Meda, A., Bayala, B., Obame, L. C., Ilboudo, a J., Franz, C. y Dicko, M. H. (2011). Chemical composition and antimicrobial activity of Cymbopogon citratus
and Cymbopogon giganteus essential oils alone
and in combination. Phytomedicine :
International Journal of Phytotherapy and Phytopharmacology, 18(12), 1070–1074.
Cháfer, M., Sánchez-González, L., González-Martínez, Ch. y Chiralt, A. (2012). Fungal decay and shelf life of oranges coated with chitosan and bergamot, thyme, and tea tree essential oils. Journal of Food Science, 77(8), E182–E187.
De Moura, M. R., Lorevice, M. V. Mattoso, L. H. C. y Zucolotto, V. (2011). Highly stable, edible cellulose films incorporating chitosan nanoparticles. Journal of food science, 76(2), N25–N29.
Dotto, G. L., Souza, V. C., De Moura, J. M., De Moura, C. M., De Antonio, L. y Pinto, D. A. (2011). Influence of drying techniques on the characteristics of chitosan and the quality of biopolymer films. Drying Technology, 29, 1784–1791.
Eum, H., Hwang, D., Linke, M., Lee, S. y Zude, M. (2009). Influence of edible coating on quality of plum (Prunus salicina Lindl. cv. ‘Sapphire’). European Food Research and Technology,229(3), 427-434.
Hosseini, S. F., Rezaei, M., Zandi, M. y Ghavi, F. F. (2013). Preparation and funtional properties of fish gelatin-chitosan blend edible films. Food Chemistry, 136, 1490-1495.
Jiang, Z., Neetoo, H. y Chen, H. (2011). Control of Listeria monocytogenes on
cold-smoked salmon using chitosan-based
antimicrobial coatings and films. Journal of food science, 76(1), M22–M26.
Jirukkakul, N. (2013). A study of Mu Yor
sausage wraps using chitosan films
incorporating garlic oil, lemon grass oil and galangal oil. International Food Research Journal, 20(3), 1199–1204.
Kerch, G. y Korkhov, V. (2010). Effect of storage time and temperature on structure, mechanical and barrier properties of chitosan-based films. European Food Research and Technology, 232(1), 17–22.
Kim, M., Jeon, S. y Kim, H. (2003). Physical properties and degradability of PHB/chitosan blend films. International Journal of Consumer Studies, 27,3(June), 218–251.
Krkic, N., Lazi, V., Savatic, S., Sojuc, B., Petrovi, L. y Suput, D. (2012). Application of chitosan coating with oregano essential oil on dry fermented sausage. Journal of Food and Nutrition Research, 51(1), 60–68.
Martelli, R. M., Barros, T. T., De Moura, R. M., Maltoso, L. H. y Assis, O. B. (2013). Effect of chitosan nanoparticles and pectin content on
mechanical properties and water vapor
permeability of banana puree films. Journal of Food Science, 78(1), N98–N103.
Moreno-Osorio, L., Garcia, M. y Villalobos-Carvajal, R. (2010). Effect of polygodial on mechanical, optical and barrier properties of chitosan films. Journal of Food Processing and Preservation, 34(2), 219–234.
Moura, R. M., Lorevice, V. M., Mattoso, H. C. L. y Zucolotto, V. (2011). Highly Stable, Edible
Cellulose Films Incorporating Chitosan
Nanoparticles. Journal of Food Science. 76 (2), N25-N29
Mura, S., Corrias, F., Stara, G., Piccinini, M., Secchi, N., Marongiu, D. y Greppi, G. F. (2011). Innovative composite films of chitosan, methylcellulose, and nanoparticles. Journal of food science, 76(7), N54–60.
Nguefack, J., Dongmo, J. B. L., Dakole, C. D., Leth, V., Vismer, H. F., Torp, J. y Nkengfack, A. E. (2009). Food preservative potential of essential oils and fractions from Cymbopogon citratus, Ocimum gratissimum and Thymus vulgaris against mycotoxigenic fungi.
International Journal of Food Microbiology,
131(2-3), 151–156.
Ojagh, S. M., Rezaei, M., Razavi, S. H. y Hosseini, S. M. H. (2010). Effect of chitosan coatings enriched with cinnamon oil on the quality of refrigerated rainbow trout. Food chemistry, 120(1),193-198.
Parikh, J. K. y Desai, M. A. (2011). Hydrodistillation of essential oil from
Cymbopogon flexuosus. International Journal of Food Engineering, 7(1), 1–8.
Peng, Y. y Li, Y. (2014). Combined effects of two kinds of essential oils on physical, mechanical and structural properties of chitosan films. Food Hydrocolloids. 36, 287-293.
Peng, Y., Yin, L. y Li, Y. (2013). Original article Combined effects of lemon essential oil and surfactants on physical and structural properties of chitosan films. International Journal of Food Science and Technology, 48, 44–50.
Rawdkuen, S., Suthiluk, P., Kamhangwong, K. y Benjakul, S. (2012) Mechanical, physico-chemical, and antimicrobial properties of gelatin-based film incorporated with catechin-lysozyme. Chemistry Central Journal. 6, 2-10.
Rhim, J. W., Park, S. T. y Jung, H. J. (1997). Formation and properties of corn zein coated k-carrageenan films. Korean Journal of Food Science and Technology. 29, 1184-1190.
Sánchez-garcía, C., Cruz-martín, M., Alvarado-capó, Y., Pérez, M. y Medinilla, M. (2007).
para el control de microorganismos
contaminantes del cultivo in vitro de plantas.
Biotecnología vegetal, 7(3), 187–190.
Sánchez-González, L., Cháfer, M., Chiralt, A. y
González-Martínez, C. (2010). Physical
properties of edible chitosan films containing bergamot essential oil and their inhibitory action on Penicillium italicum. Carbohydrate Polymers. 82, 277-283.
Souza, V. C., Monte, M. L. y Pinto, L. A. A. (2011). Preparation of biopolymer film from chitosan modified with lipid fraction.
International Journal of Food Science and Technology, 46(9), 1856–1862.
Wannisornor, B., Jarikasem, S. y
Soontorntanasart, T. (1996). Antifungal activity of lemon grass oil and lemon grass oil cream. Phytotherapy research, 10(7), 551-554.
Zhong, Y. y Li, Y. (2011). Effects of surfactants on the functional and structural properties of kudzu (Pueraria lobata) starch/ascorbic acid films. Carbohydrate
Intelligent system voice translator to a bolivian sign language
PACHECO- Carlos†, CAMACHO- Francisco, LABRANDERO- Juan
Universidad Mayor Real y Pontificia de San Francisco Xavier de Chuquisaca, Facultad de Tecnología, Carreras de Ingeniería de Sistemas e Ingeniería en Telecomunicacione, Sucre, Bolivia.
Received January 31, 2014; Accepted July 3, 2014
The present work of scientific research employs a model of neuronal Red Sequential Activation (SAN), which was developed by the research team based at the Space Network Contract, as a mechanism that transforms the result of the noise emission of a word in a symbolic graphical representation for the Bolivian alphabet signs, employing deaf people to communicate in Bolivia.
To materialize this research oriented software components to the capture and processing of words based on mathematical, physical, logical and algorithmic for the study of voice principles were developed. The sound processing and neural networks were implemented in a software component that allows in principle to memorize a set of words, then the noise emission of the same graph is represented graphically through a set of symbols sign language Bolivia .
The investigation detect the basic patterns that form the words, besides Fourier analysis for signals was used, allowing extract features in the frequency domain of the original audio signal, to be jointly used as patterns of a sequence neural network model most advanced voice detection. A study and evaluation of various neural network models allowed, taking into account the sequence of a word is the most important thing to design a neural network capable of recognizing the degree of approximation of a given sequence learned by the network sequence designated by SAN research team.
Neural Networks, Voice Recognition, Voice Translation, Sign Language for the Deaf, Deaf.
Citation: PACHECO- Carlos, CAMACHO- Francisco, LABRANDERO- Juan. Intelligent system voice translator to a
bolivian sign language. ECORFAN Journal-Bolivia 2014, 1-1:21-29
† Researcher contributing first author.
Introduction
The publication of the article entitled "Deaf people require more work and interpreters" developed by Roxana Escobar N., by the newspaper "El Deber" dated September 27, 2010, the points, conclusions and decisions taken are published by "Boliviana Federation of Deaf - Febos "in its global week that took place at that time, of which the following are rescued:
- The Febos considers that the
implementation of the law against racism and discrimination, never let you call them deaf, but deaf, considering as a challenge to overcome the biggest barrier that means
communicating without losing their
identity, (make through sign language), equal access to school education, higher and work.
- In the event the president of the Bolivian Federation of the Deaf, held that the hearing population assumed a deal of discrimination on the deaf community and called sensitization. "They call us deaf, but we have our own identity and culture; we communicate through sight and sign; our eyes are our ears, "he said.
- It was also recognized that at that time and even today there is no current figures on how many deaf people exist at national level, the only thing that counts is the census of 2001 based on only 3 disabilities
yielded the following data: 61,145
households reported having one or more persons with disabilities of this Total 26 016 belong to urban areas and 35,129 in rural areas.
- The need for a greater number of
professionals and renowned performers was established as the biggest barrier is that they cannot communicate with the hearing population, nor know, because most TV channels do not broadcast the news on language sign and cell use it only to send text messages. The limiting communication is an obstacle to access to employment; they can only access lower and non-hierarchical work.
- Was informed of the opening of the Central Bureau of Investigation Sign Language in Santa Cruz, with a focus on education of deaf children in the country objectives.
- Bolivia recognizes sign language and this adds to the 36 languages that exist in Bolivia.
- In the event became known the provision of 40 million Bolivians who receive this sector of the government, to invest in training programs for the deaf.
According to information obtained from the results of the national meeting of deaf people in the country and the information
displayed on the official site
Social inclusion and rehabilitation of these people is important to live in a society without discrimination, where each and every one has the same access to different training and work opportunities. Currently, there are specialized institutions for people with hearing
disabilities and verbal communication;
However, their capabilities are outpaced by limited infrastructure and the limited number of staff available regarding the number of people who come to these, a situation that definitely conviction, to a large part of the deaf population in Bolivia, to make it look limited in their personal, human, educational and professional development.
The limitations and adverse situations that affect this group of people, who as human beings with every right that society offers them, means and ways to overcome their limitations, and combined with the fact that the various departments have not worked something specific, but they have only sought solutions in traditional mechanisms that have in no way officially improved conditions recognized since 2010 to date, has prompted a research group considering the possibilities that currently provide us TICS settle, find a solution to this problem from the Artificial Intelligence in the area of neural networks, considering the creation of a neuronal model that allows real-time interpreting the sounds emitted by people in relation to letters, words and expressions and transform them immediately in graphical representations of Bolivian sign language.
The interest in science is essential because the research considers various neural models and a set of variables that govern the auditory recognition in real time, regardless of a specific voice, mathematical models - that generate their respective algorithmic language interpretation Bolivian signs, and takes into account the different features that it has.
Studies on speech recognition began between 1950 and 1959, studies that sought to explore the ideas of phonetic - acoustic but without satisfactory results. Since 1960, begins an explosion in speech recognition research, with significant contributions from the Japanese. Undoubtedly the most expressive technique developed at this time was the analysis by Zero Crossing (Zero-Crossing Analysis) getting distinguish between various regions of the auditory stimulus facilitating largely recognition. Another technique, not least, developed in the 60s, is the Dynamic Programming for time alignment, developed by Russian scientist Vintsync, although the basis of the concept was considered rudimentary, more advanced versions of the algorithm are well known widely used in the West that this algorithm to the early 80s Bell labs in a series of experiments began with the goal of creating a speech recognition system irrespective of speech. [Rabiner et ai, 1979].
In 1980 Artificial Neural Networks (ANN) [Morgan, 1995] apply, [Jelinek, 1976] for recognizing speech patterns. The RNA initially was introduced during the 50s; however, their results were not considered satisfactory due to a number of operational
problems were corrected as advanced
recognition. The 80 is, admittedly, the decade where progress in seeking speech recognition presents its best results. As an example we mention the system developed by the Projects Agency Defense Advanced Research (DARPA-USA) which accurately recognizes thousand words in continuous communication. These are
keywords used to control and missile