Are nuclear insertions of mitochondrial origin pseudogenes?
83
0
0
Texto completo
(2) Esta obra está sujeta a una licencia de Reconocimiento-NoComercial-SinObraDerivada 3.0 España de Creative Commons. 1.
(3) FICHA DEL TRABAJO FINAL. Título del trabajo:. Are Nuclear Insertions of Mitochondrial Origin Pseudogenes?. Nombre del autor: Marta Sanchez Delgado Nombre del consultor/a: Xavier Jordana Comin Nombre del PRA: David Merino Arranz Fecha de entrega (mm/aaaa): 06/2018 Titulación::. Máster Universitario en Bioinformática y Bioestadística (UOC-UB). Área del Trabajo Final: M0.128 TFM-Estadística y Bioinformática 29 Idioma del trabajo: Inglés Palabras clave. Human NUMTs; pseudogenes; ontology and expression study. Gene. Resumen del Trabajo (máximo 250 palabras): Con la finalidad, contexto de aplicación, metodología, resultados y conclusiones del trabajo. Las secuencias nucleares procedentes de DNA mitochondrial (NUMTs), son el resultado de una transferencia continua de fragmentos de DNA mitocondrial al núcleo. Durante estos años, se han realizado principalmente estudios filogenéticos de estas regiones pero, ¿Hay genes expresándose en estas regiones? En 2011, en un estudio liderado por C. Santos [11], se identificaron 755 NUMTs en el genoma humano. El principal objetivo de este trabajo final de máster ha sido la creación in-silico de una base de datos que contiene la lista de genes anotados dentro de estas 755 secuencias de NUMTs y su correspondiente perfil de expresión. Con este trabajo pretendemos mejorar nuestro conocimiento sobre el impacto de los NUMTs en el DNA nuclear mediante su potencial contribución en su transcriptoma. La información de la base de datos se ha obtenido de las anotaciones en ENSEMBL y Gene Ontology (GO) mediante la combinación de Scripts de R personalizados y el uso del paquete BioMart (del repositorio Bioconductor). Por otro lado, los datos de expresión provienen del portal GTEx (RNA-seq). La mayoría de estos genes se encuentran anotados como pseudogenes en ENSEMBL, pero con este trabajo mostramos que 65 de estos genes se expresan al menos, en un tejido humano. En conclusión, nuestros resultados muestran que no todos los genes codificados en los NUMTs son pseudogenes y que se requiere un cambio manual de, al menos, 63 genes clasificados como “pseudogenes” en Ensembl-Biotype puesto que son genes activos.. 2.
(4) Abstract (in English, 250 words or less): Nuclear mitochondrial DNA sequences (NUMTs) are the result of a continuous DNA transfer from mitochondria to the nucleus. Over the years, lots of studies had performed in NUMTs sequences at the DNA level but, are these regions encoding genes? In 2011, in a published work led by C. Santos [11], it was identified 755 NUMTs in the human genome. The main objective of the present master's final project has been the in-silico creation of a database containing the list of annotated genes within these 755 NUMTs sequences and their expression profile. With this work, we want to improve our knowledge about NUMTs impact on nuclear DNA by its potential contribution to the transcriptome. The database information was extracted first from the ENSEMBL and Gene Ontology (GO) annotations by a combination of in-house R scripts and the use of BioMarts package (from Bioconductor project package repository). Additionally, by using the public information of RNA-seq from GTEx Portal database and in-house R script, we show the expression profile of our list of genes. Most of these genes are currently annotated as pseudogenes in ENSEMBL, but we show that a total of 65 genes are expressed in at least, one human tissue. In conclusion, our results show that not all genes within NUMTs are pseudogenes and it is needed the manual change of at least, 63 genes classified as “pseudogene” in the Ensembl Biotype since these genes are expressed.. 3.
(5) Índice. List of Figures. 6. List of Tables. 7. 1.. 2.. 3.. 4. 5.. 6. 7. 8.. Introduction 1.1. Context and justification of the Work 1.1.1. General description 1.1.2. Justification of the Project 1.2. Objectives of the Work 1.2.1. General objectives 1.2.2. Specific objectives 1.3. Approach and method followed 1.4. Working plan 1.4.1. Tasks 1.4.2. Calendar 1.4.3. Deadlines 1.4.4. Risk analysis 1.5. A brief summary of products obtained 1.6. A brief description of the additional chapter in the memory Bioinformatics, genome browser and dataset resources used 2.1. Bioconductor 2.2. Ensembl genome browser and the BioMart project 2.3. Gene Ontology Consortium 2.4. Genotype-Tissue Expression Portal (GTEx) 2.5. The initial data and the mitochondrial DNA Results 3.1. General workflow and data filtering 3.1.1. Filtering our annotated genes 3.1.2. Original mitochondrial genes 3.2. General descriptive analysis of our datasets 3.3. Gene ontology analysis 3.4. Expression profiling 3.4.1. Genes within NUMTs 3.4.2. Mitochondrial Genes Discussion Conclusiones 5.1. The general conclusion of the technical work 5.2. The general conclusion of the scientific results 5.3. Achieved objectives 5.4. Follow-up fo the working plan 5.5. Future work Glossary Bibliography Supplementary information. 4. 8 8 8 8 9 9 9 10 11 11 12 13 13 14 16 18 18 18 19 20 20 23 23 23 24 24 27 27 27 32 34 36 36 36 36 37 37 38 39 41.
(6) 5.
(7) List of Figures. Figure 1. Gantt diagram. 12. Figure 2. Mitochondrial origin of our NUMTs. 21. Figure 3. Circular human mitochondrial DNA. 22. Figure 4. Example of filtering genes within NUMTs. 23. Figure 5. Ensembl-Biotype classification. 25. Figure 6. Heat map with all expressed genes. 28. Figure 7: Medium and highly expressed genes. 29. Figure 8. Ensembl-Biotype classification of expressed genes. 31. Figure 9. Heat map with the expression profile of all mitochondrial genes. 33. Figure 10. Visualising NUMT_01.001 in UCSC genome browser. 34. 6.
(8) List of Tables Table 1. Tasks and deadlines. 11. Table 2. Genes annotated by chromosome. 25. Table 3. NUMTs classified by gene content. 25. Table 4. Genes annotated by NUMT. 25. Table 5. List of genes in Biotype not classified as pseudogenes. 26. Table 6. GO term and definition associated with some MTRNR2L proteins. 27. Table 7. The expression level of the 452 genes included in GTEx. 27. Table 8. Genetic features of medium and high expressed genes. 30. Table 9. Genetic features of four low expressed genes. 32. 7.
(9) 1.. Introduction 1.1.. Context and justification of the Work 1.1.1.. General description. This Master’s project focussed on the study of Nuclear mitochondrial DNA sequences (NUMTs). NUMTs are the result of a continuous DNA transfer from mitochondria to the nucleus [1], [2]. These sequences vary in number and size through eukaryotic species, being a perfect tool for phylogenetic studies. Since mitochondrial and nuclear DNA have different mutation ratios, by studying the differences between NUMTs and mitochondrial DNA (mtDNA), evolutionary researchers reconstructed the approximate evolutionary moment when these sequences were inserted into the nucleus [3], [4]. Additionally, the polymorphisms of NUMTs are also a commonly used tool in human population genetic studies [5]. It is also important for the scientific community to be able to identify these regions in the reference genome browsers to avoid cross-contamination of mtDNA in nuclear DNA studies and vice versa [6]–[11]. Although these regions were reported for the first time more than thirty years ago, little is known about their insertion mechanism and its impact on the nuclear DNA [12]. Over the years, several studies were performed in NUMTs sequences at the DNA level but, are these regions encoding genes? More exhaustive studies are necessary to determine if there are genes within these regions and the impact on the genomic context caused by NUMTs insertions.. 1.1.2.. Justification of the Project. In 2011, in a published work led C. Santos [11], 755 NUMTs were identified in the human genome using BLAST. The authors compared the human mtDNA (NC_012920) against the human genome (GRCh37/hg19 assembly) and they described different aspects of this comparisons like frequency, distribution and size of NUMTs for each chromosome or % identity between NUMTs and mtDNA sequence. Based on this information and NUMTs coordinates, in the present master’s final project, we want to clarify whether or not these NUMTs origin pseudogenes. As a result of this study, we want to generate a dataset with all relevant genetic content to be able to answer this question.. 8.
(10) 1.2.. Objectives of the Work 1.2.1.. General objectives. I.. Apply the knowledge acquired during the master's degree in the big data management and the correct use of R bioinformatic repositories. II.. Elucidate if NUMTs are originating pseudogenes. 1.2.2. I.. Specific objectives. To manage and study the initial information into its genetic context and annotated information: A. Explore and get familiar with initial data used in this work (from Ramos et al. [11]) B. Define genetic context to be considered in our analysis C. Evaluate and select the online databases (UCSC genome browser tracks) relevant for the genetic study (selecting the most informative ones) D. Explore and evaluate Bioconductor and CRAN-R-project repositories for UCSC genome browser Tracks management. packages. E. Create R scripts to generate our data tables F. Perform a descriptive statistical analysis of our dataset G. Determine the main biological functions of NUMTs pseudogenes (Gene Ontology study) II.. To directly elucidate if genes within NUMTs are originating expressed genes and not only pseudogenes: A. Determine the main target tissues were NUMTs pseudogenes are expressing (GTEx) B. Classify and plot all data information to elucidate the degree of expression in the different tissues C. Compare expression profile of NUMTs genes with mitochondrial genes. 9.
(11) 1.3.. Approach and method followed. Different strategies could be addressed to elucidate if NUMTs contain active genes. First, to generate the list of annotated genes within these sequences, different gene databases could be used (e.g. RefSeq genes, UCSC genes, Ensembl genes...). We have decided to generate a set of manageable data tables to facilitate consultation by future researchers unfamiliar with bioinformatics. For the same reason, the R Script created to generate the dataset will be easily adaptable to obtain a new list of annotated genes within the new coordinates (Human Assembly GRCh37/hg19). For this propose, Bioconductor packages repository has been the main resources to manage and download information from BioMart project, including Ensembl ID and Gene Ontology annotations. Our election of Ensembl gene database is based on its continuous updating and its connection with GTEx, which contains the gene expression information in 53 tissues from RNA-seq of 8555 samples. The dataset generated at the end of this project comprise additional relevant information from genes containing in the corresponding mitochondria donor regions; location of NUMTs (intergenic, partial genes, introns); and GTEx information for expression means in each tissue. All these information will be relevant to elucidate the potential role of the identified expressed genes in the case of having expression data from GTEx.. 10.
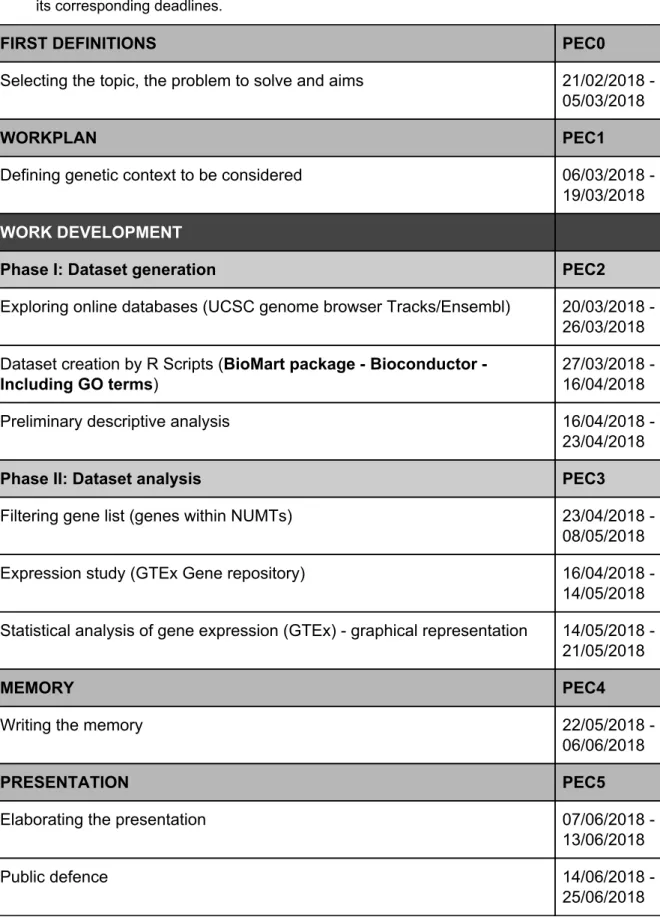
(12) 1.4.. Working plan 1.4.1.. Tasks. Table 1. Tasks and deadlines. List of tasks performed for this Final Master Project and its corresponding deadlines.. FIRST DEFINITIONS. PEC0. Selecting the topic, the problem to solve and aims. 21/02/2018 05/03/2018. WORKPLAN. PEC1. Defining genetic context to be considered. 06/03/2018 19/03/2018. WORK DEVELOPMENT Phase I: Dataset generation. PEC2. Exploring online databases (UCSC genome browser Tracks/Ensembl). 20/03/2018 26/03/2018. Dataset creation by R Scripts (BioMart package - Bioconductor Including GO terms). 27/03/2018 16/04/2018. Preliminary descriptive analysis. 16/04/2018 23/04/2018. Phase II: Dataset analysis. PEC3. Filtering gene list (genes within NUMTs). 23/04/2018 08/05/2018. Expression study (GTEx Gene repository). 16/04/2018 14/05/2018. Statistical analysis of gene expression (GTEx) - graphical representation. 14/05/2018 21/05/2018. MEMORY. PEC4. Writing the memory. 22/05/2018 06/06/2018. PRESENTATION. PEC5. Elaborating the presentation. 07/06/2018 13/06/2018. Public defence. 14/06/2018 25/06/2018. 11.
(13) 1.4.2.. Calendar. Figure 1. Gantt diagram. Temporal planning for all tasks performed in this final project. Each task is represented in a colour filled box: grey if it is already achieved, light blue if it is active, dark blue for future tasks and red if it is critical. The diagram is divided into three sections. The first section contains the general activities (blue shaded section), the second section includes dates of each delivery (white section with red boxes for each PEC), and the final section includes specific tasks carried out throughout the semester (orange shaded section). At the bottom, it is indicated the week year numbering. Grey vertical lines indicate the Monday of each week. The first line is 26/02/2018 (week 8). Updated: 05/06/2018. 12.
(14) 1.4.3.. Deadlines. PEC0. First definitions: selected topic, the problem to solve and aims (21/02/2018 - 05/03/2018) PEC1. Workplan: definition of genetic context to be considered (06/03/2018 - 19/03/2018) PEC2. Work development (Phase I): dataset generation (20/03/2018 - 23/04/2018) PEC3. Work development (Phase II): dataset analysis (24/04/2018 - 21/05/2018) PEC4. Writing the memory (22/05/2018 - 06/06/2018) PEC5a. Elaborating the presentation (07/06/2018 - 13/06/2018) PEC5b. Public defense (14/06/2018 - 25/06/2018). 1.4.4.. Risk analysis. I.. Inability to generate a script to generate any of the data tables. In this case, we will try to find alternative databases. II.. Negative results: NUMTs do not contain genes or pseudogenes. If we do not find genes in these regions (or we find very few genes) this project should change completely. Instead of mainly focus our study on to the expression analysis, we will focus it on the conservation study, the presence of repetitive sequences and epigenetic analysis.. 13.
(15) 1.5.. A brief summary of products obtained. At the end of this project you will get the following products: I.. NUMTs-ID-bed.txt. This file contains the coordinates of all NUMTs including its localisation in mitochondrial genome adapted to bed format to its uploaded in UCSC genome browser. Once you upload this file in the UCSC genome browser, you will visualise it in a new track on your screen together with other genomic data from all tacks activated. This document is available in GitHub platform: https://github.com/msanchezd/UOC-Bioinformatics/tree/TFM-documents II.. DynamicReport.Rmd (.html). This document (also in the supplementary section of this memory) contains the description of all data tables and its content, together with some figures describing Ensembl Biotype, GO Terms and expression profile (GTEx) from all genes within the given initial coordinates. Following its instructions, by changing the name of the input document and download this .Rmd file together with .bib and your new .cvs containing the coordinates, it is easy to generate a new .html dynamic report and all data-tables with the new input information. This document is available in GitHub platform: https://github.com/msanchezd/UOC-Bioinformatics/tree/Dynamic-Report III.. Scripts.R. Document with all scripts designed for these project (all the code in this document is the scrips in the last part of the Supplementary section). The first part contains all scripts to generate the tables and data in DynamicReport document and the second part is adapted specially for our data, including all figures and additional data filtering. This document is available in GitHub platform: https://github.com/msanchezd/UOC-Bioinformatics/tree/TFM-documents IV.. Data tables: A total of 16 data tables containing the output of analysis. All of them also available in GitHub platform:. https://github.com/msanchezd/UOC-Bioinformatics/tree/TFM-documents Tables obtained from the Dynamic Report (dimensions in Row x Col) File 1 - All_attributes.txt (1416 x 3): list of attributes included in BioMarts Bioconductor package. File 2 - All_filters.txt (303 x 2): list of filters included in BioMarts Bioconductor package. File 3 - gene_results.txt (1155 x 9): table of all genes identified before our filtering. The table includes id NUMT, chromosome coordinates for each gene, strand (+ or -), HGNC symbol, Ensembl Gene ID with and without version and transcript count.. 14.
(16) File 4 - up_gene_results.txt (891 x 9): table of all genes identified upstream genes in “gene_results.txt” (between 100-1000 bp upstream). The table includes id NUMT, chromosome coordinates for each gene, strand (+ or -), HGNC symbol, Ensembl Gene ID with and without version and transcript count. File 5 - down_gene_results.txt (905 x 9): table of all genes identified downstream genes in “gene_results.txt” (between 100-1000 bp downstream). The table includes id NUMT, chromosome coordinates for each gene, strand (+ or -), HGNC symbol, Ensembl Gene ID with and without version and transcript count. File 6 - genes.txt (456 x 1): Ensembl Gene ID of all genes within our NUMTs after filtering. File 7 - go_results.txt (22 x 5): GO id and descriptions for our genes. File 8 - phenotype_results.txt (456 x 5): table of all genes within NUMTs (after filtering) including HGNC symbol, Ensembl Gene ID version, Transcript count, Gene Biotype, Gene description (from different sources). File 9 - mean_tpm_GTEx.txt (452 x 58): genes within NUMTs (after filtering) that have expression information in GTEx portal. The table includes the expression in Transcripts per Million (TPM) of all 53 tissues, a mean per gene and the sum of all TPM per gene including all tissues. File 10 - subset_expressed.txt (72 x 58): genes within NUMTs (after filtering) that are expressed in at least one tissue ( >= 0.5 TPM). The table includes the expression in TPM of all 53 tissues, a mean per gene and the sum of all TPM per gene including all tissues. File 11 - FINAL_OUTPUT_TABLE.txt (998 x 75): the final table including the 756 genes, its coordinates, its expression data, different nomenclatures, Ensembl-Biotype and GO term. Additional tables especifically obtained for this master thesis The following tables are obtained from the second part of the Script.R (showed in supplementary section): File 12 - gene_result_mt.txt (3954 x 9): table of all mitochondrial genes overlapping with original mitochondrial NUMT sequences. Since generally, most NUMTs are originated by several mitochondrial genes, the table have 3954 rows (and the mitochondria have 38 annotated genes). The table includes id NUMT, chromosome coordinates for each gene, strand (+ or -), HGNC symbol, Ensembl Gene ID with and without version, transcript_count and Ensembl biotype classification. File 13 - total_overlaping.txt (1007 x 11): all nuclear and mitochondrial genes which partially overlaps (without any cutoff). The table contains HGNC symbol for nuclear and mitochondrial genes and adapted coordinates for nuclear and mitochondrial genes. The start and end position of coordinates are: the first four (NUMTs in chromosomes 1 to 9) or five numbers (NUMTs. 15.
(17) in chromosomes 10 to 22, 23 for X and 24 for Y) indicates the id NUMT (11001XXXXX) the last five numbers corresponds to the position of the gene within the NUMT (XXXXX00352). The length of each gene and the full overlapping region is indicating, together with % of overlap respect the mitochondrial or nuclear gene. File 14 - all_data_70.txt (1007 x 11): combination of table “FINAL_OUTPUT_TABLE.txt” with all new data from comparing nuclear genes and mitochondrial genes from “total_overlaping” but after filtering. We only include overlapping genes if 70% of the nuclear gene is formed by the corresponding mitochondrial gene or the cases that at least the 70% of a mitochondrial gene it is present in the nuclear gene. File 15 - mito_genes.txt (37 x 1): Ensembl Gene ID of all mitochondrial genes annotated. File 16 - mean_tpm_GTExMITO.txt (37 x 58): Mitochondrial genes with expression data in GTEx portal. The table includes the expression in TPM of all 53 tissues, a mean per gene and the sum of all TPM per gene including all tissues.. 1.6.. A brief description of the additional chapter in the memory. ★ Bioinformatics, genome browser and dataset resources used General description of all online and bioinformatic resources used during this work, their potential and accessibility and the origin of the initial dataset (original study [11]): I.. Bioconductor. II.. Ensembl genome browser and the BioMart project. III.. Gene Ontology Consortium. IV.. Genotype-Tissue Expression Portal. V.. The initial dataset and the mitochondrial DNA. ★ Results I.. General workflow and data filtering. Description of the steps followed for filtering our data by in-house R-scripts to generate the final list of genes within the NUMTs and determine the mitochondrial gene contribution to them. II.. General descriptive analysis of our datasets. Before to determine if the genes are expressed or not, in this subsection it is shown an initial analysis of general characteristics (e.g. number of genes annotated per chromosome and NUMT or the classification of these genes in Ensembl-Biotype). III.. Gene ontology analysis. Once we got a list of genes, we generated a list of GO Terms and determine if there are biological functions overrepresented in potential genes originated by NUMTs.. 16.
(18) IV.. Expression profiling. The key analysis performed in this study was to determine if any of these annotated genes within NUMTs is expressed in at least, one tissue. In this subjection, the annotated genes were classified in low, middle and high expressed. Additionally, it was also shown expression profile of all mitochondrial genes in the different human tissues. ★ Discussion Once we finish all our expression analysis, we discussed the biological and technical implications of our results. ★ Conclusions List of main conclusions we can draw from the present work.. 17.
(19) 2.. Bioinformatics, genome browser and dataset resources used 2.1.. Bioconductor. The Bioconductor project started in 2001 and it was mainly created to provide a supervised tool for the analysis and comprehension of high-throughput genomic data [13]. Bioconductor uses the R statistical programming language and its content is updated twice each year. It is an open source and open development software project and is overseen by a core team at Roswell Park Cancer Institute and by other members of US and other international institutes [14]. The last updated version of Bioconductor contains 1560 software packages and the goals of this project are related to the power of R statistical programming: -. To provide access to powerful statistical and graphical methods for the analysis of genomic data.. -. To facilitate the inclusion of biological metadata (annotated in public genome browsers or databases) in the analysis of genomic data.. -. To provide a common software platform.. -. To further scientific understanding by producing high-quality documentation and reproducible research.. -. To train researchers on computational and statistical methods for the analysis of genomic data.. Additionally, Bioconductor has an active user community continuously interacting with its content and anyone could become a developer, by contributing to packages resource or associated documentation. All these applications will be supervised by Bioconductor experts. But Bioconductor also facilitates the interaction between scientific community by organizing every year a conference to show the current developments within and beyond Bioconductor, and by linking together different groups with common goals to facilitate collaborations.. 2.2.. Ensembl genome browser and the BioMart project. The Ensembl genome database project is the result of a collaborative work between the European Bioinformatic Institute and the Wellcome Trust Sanger Institute (EMBL-EBI) started in 1999. Nowadays, Ensembl is a genome browser for vertebrate genomes and its annotate genes are continuously updated and linked with other genomic tools like Bioconductor or the GTEx database. The current genome assembly is GRCh38, however, we use the previous assembly since it is the most complete: GRCh37 Full Feb 2014 archive with BLAST, VEP and BioMart The GRCh37 assembly contains 20,805 coding genes, 196,501 gene transcripts, 48,597 Genscan gene predictions, 328,852,510 short variants and 5,806,176 structural variants. Additionally, the Ensembl automatic annotation system classifies genes and transcripts into biotypes including protein-coding, pseudogene, processed pseudogene, micro RNA. 18.
(20) (miRNA), ribosomal RNA (rRNA), small-nuclear RNA (snRNA) and small-nucleolar RNA (snoRNA). In the GRCh37 assembly, 14,181 annotated genes are classified as pseudogenes. Although in some cases, for human, mouse, rat and pig, Ensembl incorporate manual annotation from Havana, in most of the cases it is in-silico automatic classification. Finally, it is important to highlight that Ensembl has an online tool with a user-friendly interface: the BioMart tool. In this webpage you can select: -. Dataset: Specific genome assembly. -. Filters: Here you will introduce your input data and indicate how you want to filter your output (from a list of gene IDs, chromosomes…). -. Attributes: Here you will select the information you want to extract from your input data. Attributes include data from Ensembl and external data from other databases like Gene Ontology Consortium, EntrezGene ID, HUGO Gene Nomenclature Committee ID (HGNC) or RefSeq.. This Ensembl took is based on the BioMart project, which is a community-driven project to provide unified access to distributed research by providing free software and data services to the international scientific community, facilitating scientific collaborations and helping the discovery process. But BioMart is not only integrated into Ensembl as a tool, it is also integrated into Galaxy, Cytoscape, Taverna and also in Bioconductor, as a complete R package. In this Master’s final project, the BioMart Bioconductor package has been used indicating GRCh37 assembly version and Homo sapiens Ensembl genes (version 92). Different filters and attributes were chosen depending on what we were downloading.. 2.3.. Gene Ontology Consortium. The Gene Ontology (GO) project provides a comprehensive resource currently available for computable knowledge regarding the gene functions and gene products. When you provide a large list of genes included in this database, you can perform an enrichment analysis powered by PANTHER. This analysis consists in the classification of the genes provided depending on its functional classification (given by GO) and comparing to the characteristics of all genes included in GO, you will know if there is a significant representation of a specific biological process, molecular function or cellular component (depending the analysis you chose) in your list of genes. As we will see in the Results section, there is only a single family of genes within our NUMTs included in GO, which makes the PANTHER statistical analysis impossible.. 19.
(21) 2.4.. Genotype-Tissue Expression Portal (GTEx). The portal for the Genotype-Tissue Expression (GTEx) project provides free access to gene expression and quantitative trait loci from 53 human tissues. This project was supported by the Common Fund of the Office of the Director of the National Institutes of Health, and by NCI, NHGRI, NHLBI, NIDA, NIMH, and NINDS. The GTEx Project was founded in 2015 aiming to provide to the scientific community a resource with which to study human gene expression and regulation and its relationship to genetic variation. This project is continuously collecting and analysing multiple human tissues from donors who are also genotyped, to assess genetic variation within their genomes. By analysing global RNA expression within individual tissues and treating the expression levels of genes as quantitative traits, variations in gene expression that are highly correlated with genetic variation can be identified as expression quantitative trait loci or eQTLs. To achieve its aims, the GTEx Consortium is continuously incorporating new working groups, facilitating scientific collaborations and increasing the available datasets. The current data provided by GTEx Portal is associated with coordinates and IDs fromhg19/GRCh37 human genome reference and the 1000 genomes project. The data used for the analyses described in this Master’s project were obtained from Datasets → download section in GTEx project. Specifically, the file containing the median TPM by tissue (GTEx Analysis V7) in RNA-Seq Data subsection. The access to GTEx files is free, but you need to sign in. The name of the document used is: GTEx_Analysis_2016-01-15_v7_RNASeQCv1.1.8_gene_median_tpm.gct.gz In the Datasets → download section from GTEx Portal you can also download other expression data (e.g. gene read counts or transcripts TPM) to locally work on your computer. However, to fully access to this GTEx subsection, the user needs to sing in, which normally is automatically identified if you already sign in your web browser.. 2.5.. The initial data and the mitochondrial DNA. In the initial work published in 2011 by Ramos et al [11], it was performed a BLAST by comparing The Human mtDNA Reference Sequence (NC_012920) against the human RefSeq Genomic database at NCBI (GRCh37). It was detected NUMTs in all human chromosomes but with different freqüency. For example, chromosome 2 is where more NUMTs insertions were described, but the size of these insertions was lower than the mean. As we can see in Figure 2 showing the corresponding mitochondrial regions that originate the 755 NUMTs described in the initial study, the insertions were generated from all the extension of mtDNA, being some specific regions highly represented.. 20.
(22) Figure 2. Mitochondrial origin of our NUMTs. Screenshot of our custom track (UCSC Genome browser) containing all NUMTs coordinates and its corresponding mitochondrial origin regions. The full extent of the mitochondrial DNA is represented.. This NUMTs identified are the most recent insertions from the mtDNA and some of them could be human or primate-specific. Thought evolution, the eukaryotic DNA has been receiving different mtDNA insertions, in some cases, the mitochondria have lost the corresponding DNA sequence and nowadays, some mitochondrial origin genes are exclusively in the eukaryotic nucleus [15]. The modern human mtDNA contain genes encoding for 13 proteins (Figure 3), which are structural subunits of the mitochondrial respiratory chain (to produce ATP). Additionally, since the genetic code of the mitochondria is different from the genetic code of the nuclear genome, the mitochondrial DNA includes corresponding transfer RNAs (tRNAs). The 22 tRNA and 2 rRNA genes are located between the peptide-encoding genes [16]. However, our mitochondria contain about 1000 proteins, most of them are nuclear-encoded which are translated on cytosolic ribosomes and actively imported and sorted into mitochondrial subcompartments [17], [18].. 21.
(23) Figure 3. Circular human mitochondrial DNA. Representation of all genes annotated in the human mitochondrial DNA and the initiation sites for both heavy and light strands transcription [16].. 22.
(24) 3.. Results 3.1.. General workflow and data filtering 3.1.1.. Filtering our annotated genes. By using BioMart package (from Bioconductor), all the genes annotated in Ensembl which coordinates overlap with our initial coordinates are selected. However, since this list also includes large gene coding proteins where the NUMTs are probably located in intronic regions, we decide to perform a first filtering to obtain an accurate list of genes (Scripts in PART 1 of the supplementary data). For this propose, an additional two other lists were generated with new coordinates obtained from the upstream or downstream part of the original NUMTs coordinates (between 100 - 1000 bp from the initial coordinates). Once we get this two new list of genes, we eliminate from the initial list those genes also present upstream and downstream the initial coordinates. In figure 4, SPTLC1 (pink names) is the only one present in all lists, so is the only one deleted. In the case of MTC03P29 (pink names), its coding region is formed by two different NUMTs, as a consequence, this gene will be in the upstream least of NUMT_09.025 and the downstream list of NUMT_09.026. However, we conserve this gene because we consider the possibility of having a gene formed by more than one NUMTs and we delete exclusively “paired annotations,” i.e., genes present in upstream and downstream part of a specific NUMTs. With this approach, if we have a gene originated from more than three different NUMTs, we will not lose this gene because it is not in one of the downstream or upstream lists for the initial and final NUMT.. Figure 4. Example of filtering genes within NUMTs. Screenshot of our custom track (UCSC Genome browser) containing all NUMTs coordinates and its corresponding mitochondrial origin regions. In the example, our first approach will recognise a total of 6 Ensembl genes (in dark red). With our filtering, we eliminate the big gene where our NUMTs are overlapping with the intronic region and keep the other 5 genes. (A) In green,. 23.
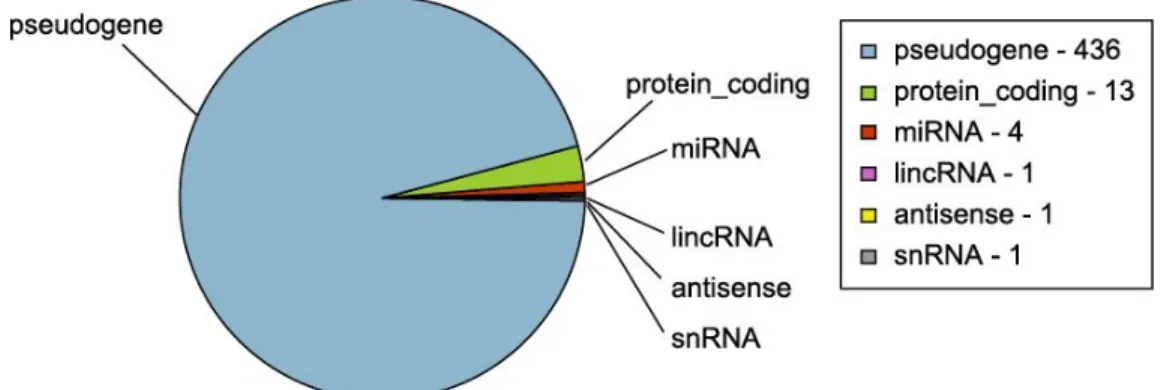
(25) upstream and downstream region for NUMT_09.025 and (B) In purple, upstream and downstream region for NUMT_09.026.. 3.1.2.. Original mitochondrial genes. In parallel, the coordinates of the different mitochondrial genes were also extracted and associated with its corresponding NUMT. Using the information from NUMTs coordinates and the direction of the genes (strand + or -), a search for overlap in NUMTs genes and its corresponding mitochondrial genes were performed (Scrips in PART 2 of supplementary data): ➔ If gene is strand is +1: START: (gene start - NUMT start) and END: (gene end - NUMT start) ➔ If gene is strand -1: START: (NUMT end - gene end) and END: (NUMT end - gene start) To accurate the analysis and to focus on nuclear genes that are mainly originated from mitochondrial genes, we filtered for regions where, the 70% of the nuclear gene is formed by the corresponding mitochondrial gene or the cases that at least the 70% of a mitochondrial gene it is present in the nuclear gene.. 3.2.. General descriptive analysis of our datasets. Before the filtering, in “gene_results.txt”, 733 different genes were detected in our analysis. After discriminating big genes included in our first list and between 100-1000 bp upstream and downstream each NUMT, we obtain a list of 456 genes differently distributed in the chromosomes, being the chromosome 2 the one with more genes (Table 2). The genes annotated are differently distributed within NUMTs, being in total, 468 NUMTs which do not contain any gene (see Table 3). In general, a single gene is annotated for those NUMTs containing genes, but exceptionally, it is identified 1 NUMT with 8 annotated genes (NUMT_17.013), 1 NUMT with 10 (NUMT_02.043) annotated genes and 2 NUMTs with 11 annotated genes (NUMT_04.035 and NUMT_05.022). Finally, we also identified some genes formed by more than one NUMT (Table 4). After eliminating 277 genes before the filtering, 401 genes are included in only 1 NUMT, 50 genes are originated from 2 different NUMTs, only 4 genes are included in three NUMTs (MTND5P28, MTND5P1, RP3-433F14.2 and Z95114.7) and a single gene is originated by 4 different NUMTs (MTND4P31). For our list of 456 genes within NUMTs, we additionally search for annotated classifications of gene features. Since our search was focussed on Ensembl annotations, we check the corresponding Biotype classification for our list of genes (Figure 5).. 24.
(26) Table 2. Genes annotated by chromosome. Chr. 1 Chr. 2 Chr. 3 Chr. 4 Chr. 5 Chr. 6 Chr. 7 Chr. 8 Chr. 9 Chr. 10 Chr. 11 Chr. 12 45. 80. 24. 36. 32. 16. 39. 19. 23. 16. 14. 4. Chr. 13 Chr. 14 Chr. 15 Chr. 16 Chr. 17 Chr. 18 Chr. 19 Chr. 20 Chr. 21 Chr. 22 Chr. X Chr. Y 8. 5. 9. 13. 18. 2. 3. 5. 4. 8. 28. 5. Table 3. NUMTs classified by gene content. The table indicates how many NUMTs contains a specific number of genes (starting with the number of NUMTs without genes and finishing with the number of NUMTs containing eleven genes). Any gene. One gene. 468. 183. Two Three Four Five Six Seven Eight Nine Ten Eleven genes genes genes genes genes genes genes genes genes genes 59. 19. 11. 3. 3. 6. 1. 0. 1. 1. Table 4. Genes annotated by NUMT. The table indicates how many genes are annotated in one, two, three or four NUMT (any gene is formed by five or more NUMTs). Genes in one NUMT 401. Genes in two NUMTs Genes in three NUMTs Genes in four NUMTs 50. 4. 1. As we can see in Figure 5, 436 genes (95.6% of our filtered list of genes) within NUMTs are classified as pseudogenes (they are similar to known proteins but contain a frameshift and/or stop codon(s) which disrupts the ORF) by Ensembl Biotype. These genes are probably initially annotated by in-silico approaches due to its similarity with mitochondrial genes and are classified as pseudogenes due to its different genomic code, but in the following section we compare this information with GTEx data to elucidate if all of them are pseudogenes or some of them are expressed (even though if they are translated with nucleus machinery, these genes will encode proteins with different structure than the corresponding mitochondrial proteins).. Figure 5. Ensembl-Biotype classification. Only 436 out of 456 genes identified are classified as pseudogenes in Ensembl-Biotype. For the other annotated genes, 13 corresponds to protein-coding genes, 4 miRNAs, 1 antisense, 1 lincRNA and 1 snRNA.. 25.
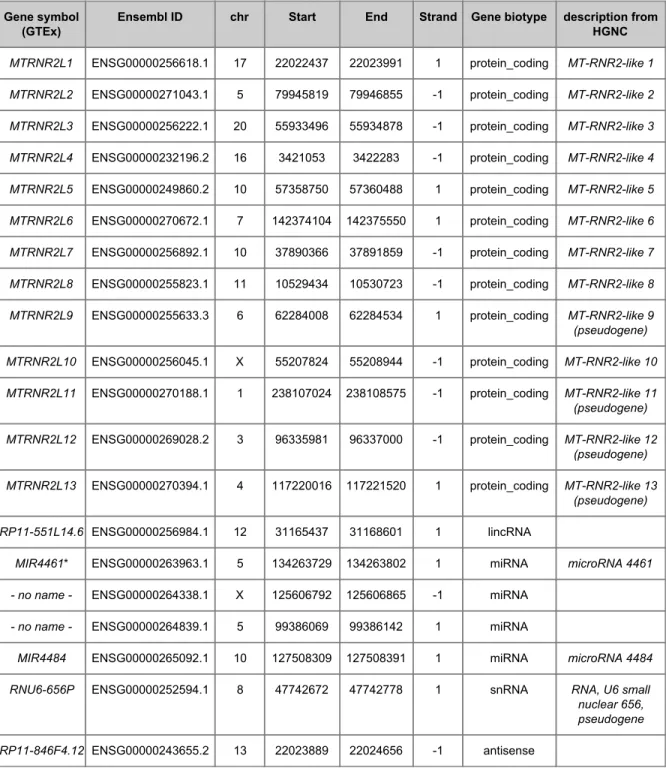
(27) From the genes annotated in Biotype, the only genes not classified as pseudogenes are the Humanin-like genes (MTRNR2L), four miRNA, a small nuclear RNA (snRNA) and a large intergenic non-coding RNAs (lincRNAs). However, some of these annotated genes are specifically described as pseudogenes in HGNC (see Table 5). Table 5. List of genes in Biotype not classified as pseudogenes. Gene symbol (GTEx). Ensembl ID. chr. Start. End. Strand. Gene biotype. description from HGNC. MTRNR2L1. ENSG00000256618.1. 17. 22022437. 22023991. 1. protein_coding. MT-RNR2-like 1. MTRNR2L2. ENSG00000271043.1. 5. 79945819. 79946855. -1. protein_coding. MT-RNR2-like 2. MTRNR2L3. ENSG00000256222.1. 20. 55933496. 55934878. -1. protein_coding. MT-RNR2-like 3. MTRNR2L4. ENSG00000232196.2. 16. 3421053. 3422283. -1. protein_coding. MT-RNR2-like 4. MTRNR2L5. ENSG00000249860.2. 10. 57358750. 57360488. 1. protein_coding. MT-RNR2-like 5. MTRNR2L6. ENSG00000270672.1. 7. 142374104. 142375550. 1. protein_coding. MT-RNR2-like 6. MTRNR2L7. ENSG00000256892.1. 10. 37890366. 37891859. -1. protein_coding. MT-RNR2-like 7. MTRNR2L8. ENSG00000255823.1. 11. 10529434. 10530723. -1. protein_coding. MT-RNR2-like 8. MTRNR2L9. ENSG00000255633.3. 6. 62284008. 62284534. 1. protein_coding. MT-RNR2-like 9 (pseudogene). MTRNR2L10. ENSG00000256045.1. X. 55207824. 55208944. -1. protein_coding. MT-RNR2-like 10. MTRNR2L11. ENSG00000270188.1. 1. 238107024. 238108575. -1. protein_coding. MT-RNR2-like 11 (pseudogene). MTRNR2L12. ENSG00000269028.2. 3. 96335981. 96337000. -1. protein_coding. MT-RNR2-like 12 (pseudogene). MTRNR2L13. ENSG00000270394.1. 4. 117220016. 117221520. 1. protein_coding. MT-RNR2-like 13 (pseudogene). RP11-551L14.6 ENSG00000256984.1. 12. 31165437. 31168601. 1. lincRNA. MIR4461*. ENSG00000263963.1. 5. 134263729. 134263802. 1. miRNA. microRNA 4461. - no name -. ENSG00000264338.1. X. 125606792. 125606865. -1. miRNA. - no name -. ENSG00000264839.1. 5. 99386069. 99386142. 1. miRNA. MIR4484. ENSG00000265092.1. 10. 127508309. 127508391. 1. miRNA. microRNA 4484. RNU6-656P. ENSG00000252594.1. 8. 47742672. 47742778. 1. snRNA. RNA, U6 small nuclear 656, pseudogene. RP11-846F4.12 ENSG00000243655.2. 13. 22023889. 22024656. -1. antisense. *MIR4461 is annotated twice in HGNC, but the other corresponding ENSEMBL code, ENSG00000198868 (chr5:134263720-134264016, negative strand) is associated with MTND4LP30 in GeneCard database and classified as “pseudogene” in Ensembl Biotype.. 26.
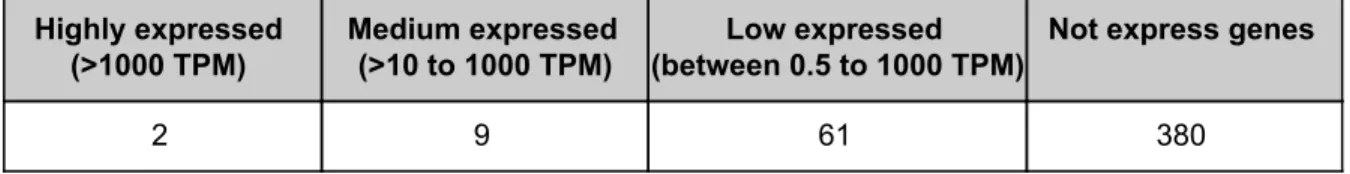
(28) 3.3.. Gene ontology analysis. From all our list of genes within NUMTs sequences, only 11 are annotated in the Gene Ontology Consorcium. These genes are most of the MTRNR2L classified as “protein-coding” in Ensembl biotype (except MTRNR2L11 and MTRNR2L13, that, in fact, as is highlighted in Table 5, are two of the ones considered as pseudogenes in HGNC). All these MTRNr2L proteins are associated with two GO terms: “Extracellular region” and “cytoplasms” (see Table 6). These means that all these proteins were detected in the extracellular space and cytoplasm. In the “localisation” section of GeneCards database, we can find the confidence of this localization, for example, for MTRNR2L1. Table 6. GO term and definition associated with some MTRNR2L proteins go_id. name_1006. definition_1006. GO:0005576. extracellular region. The space external to the outermost structure of a cell. For cells, without external protective or external encapsulating structures, this refers to space outside of the plasma membrane. This term covers the host cell environment outside an intracellular parasite. [GOC:go_curators]. GO:0005737. cytoplasm. All of the contents of a cell excluding the plasma membrane and nucleus, but including other subcellular structures. [ISBN:0198547684]. 3.4.. Expression profiling 3.4.1.. Genes within NUMTs. By using the mean of expression in Transcript per million (TPM - normalization method for RNA-seq, which means that "for every 1,000,000 RNA molecules in the RNA-seq sample, x came from this gene/transcript."-) from GTEx Portal (from the file “GTEx_Analysis_2016-01-15_v7_RNASeQCv1.1.8_gene_median_tpm.txt.gct” in download GTEx Portal section), the cutoff to define a gene expressed was 0.5 TPM in at least one tissue (see Figure 6). This is the de default minimum expression level defined by the EMBL-EBI Expression Atlas. Additionally, also following the EMBL-EBI Expression Atlas criteria, genes were classified in low expressed (between 0.5 and 10 TPM), medium expressed (>10 to 1000 TPM, see Figure 7B) and high expressed (more than 1000 TPM, see Figure 7A). In total, GTEx includes expression data for 452 of our genes and 72 are expressed (see Table 7). Table 7. The expression level of the 452 genes included in GTEx. For the 456 genes annotated in Ensembl, 452 are included in RNA-seq data from GTEx and 72 of them are expressed in at least one tissue (> 0.5 TPM). Highly expressed (>1000 TPM). Medium expressed (>10 to 1000 TPM). 2. 9. Low expressed Not express genes (between 0.5 to 1000 TPM) 61. 27. 380.
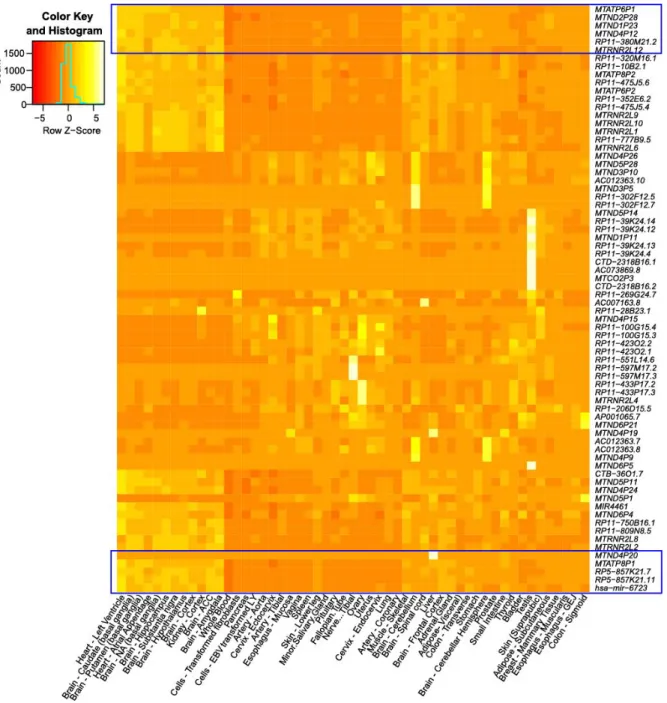
(29) Figure 6. Heat map with all expressed genes (more than 0.5 TPM in at least 1 tissue). Z-score (z = (x – μ) / σ) normalized by row, i.e. for each gene independently based on its expression profile in the different tissues. Blue boxes represents the highly and middle expressed genes.. 28.
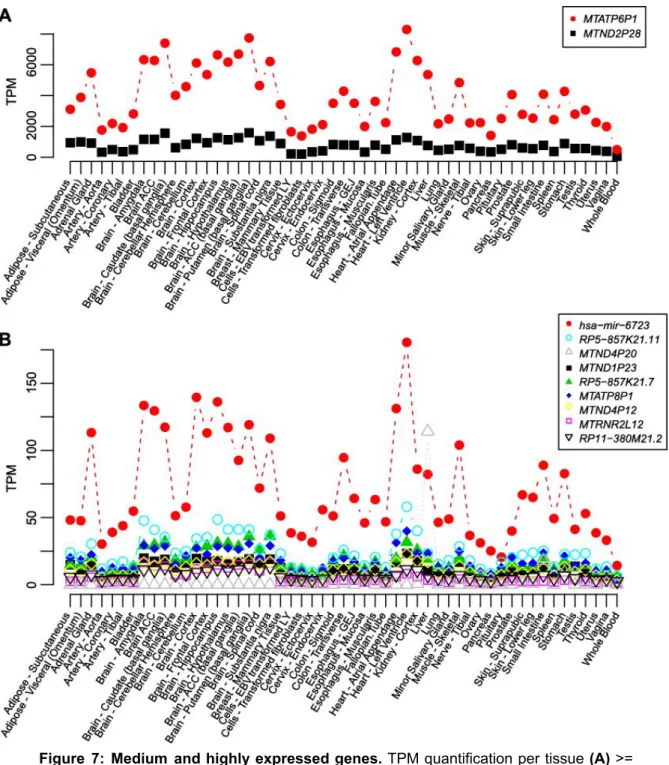
(30) Figure 7: Medium and highly expressed genes. TPM quantification per tissue (A) >= 1000.0 TPM in at least, one tissue (B) between 10 and 1000 TPM.. In the Heatmap from Figure 6, we are including all genes that have at least one tissue with > 0.5 TPM. However, focussing on the more expressed genes (Figure 7), they have a clear tendency of expression depending on the tissue, being Heart and Brain the most expressed ones. These 11 genes expressed in > 10 TPM in at least one tissue are localized in 5 different NUMTs and except MTRNR2L12, classified as a protein-coding gene, the other 10 genes are identified as pseudogenes by ENSEMBL-Biotype (see Table 8). The table also includes the corresponding mitochondrial genes which sequence are included in the nuclear gene. As we can see, NUMT_01.001 contains the 7 genes more expressed.. 29.
(31) Table 8. Genetic features of medium and high expressed genes. The table shows the corresponding NUMTs id, size, localization and the biotype classification for the nuclear-expressed genes with > 10 TPM in at least one tissue. Additionally, it is also indicated the corresponding mitochondrial gene which sequence are included in the NUMTs, its biotype classification and the % of the nuclear gene that includes each mitochondrial gene and the % of the mitochondrial gene that is present in the nuclear gene. id. NUMT localization size. Gene symbol (GTEx). Nuclear gene biotype. Mito. gene. Mito. gene biotype. % overlap nuclear gene. % overlap mt. gene. NUMT_01.001. 5843. intronic. MTATP6P1. pseudogene. MT-ATP6. protein_coding. 99.85%. 99.85%. NUMT_01.001. 5843. intronic. MTND2P28. pseudogene. MT-ND2. protein_coding. 99.81%. 100.00%. NUMT_01.001. 5843. intronic. hsa-mir-6723. pseudogene. MT-CO1. protein_coding. 99.94%. 100.00%. NUMT_01.001. 5843. intronic. RP5-857K21.11. pseudogene. MT-CO3. protein_coding. 99.82%. 69.60%. NUMT_01.001. 5843. intronic. MTATP8P1. pseudogene. MT-ATP8. protein_coding. 99.51%. 99.51%. NUMT_01.001. 5843. intronic. RP5-857K21.7. pseudogene. MT-CO2. protein_coding. 100.00%. 99.71%. NUMT_01.001. 5843. intronic. MTND1P23. pseudogene. MT-ND1. protein_coding. 99.72%. 100.00%. NUMT_05.030. 5218. intronic. MTND4P12. pseudogene. MT-ND6. protein_coding. 38.08%. 100.00%. MT-TE. Mt_tRNA. 4.94%. 100.00%. NUMT_18.003. 202. intronic. RP11-380M21.2. pseudogene. MT-CO2. protein_coding. 100.00%. 75.51%. NUMT_10.029. 862. intronic. MTND4P20. pseudogene. MT-ND4. protein_coding. 96.05%. 100.00%. NUMT_03.014. 1322. partial_gene. MTRNR2L12. protein_coding. MT-TV. Mt_tRNA. 7.02%. 100.00%. MT-RNR2. Mt_rRNA. 71.59%. 44.48%. MT-RNR1. Mt_rRNA. 21.18%. 100.00%. Table 8 shows that MTRNR2L12 is the only MTRNR2L member with >10 TPM detected in at least, one tissue. However, as we can see in Figure 8, it was detected the expression (> 0.5 TPM) of 8 genes classified as protein-coding genes, which includes the high expressed MTRNR2L12 gene and MTRNR2L1, MTRNR2L2, MTRNR2L4, MTRNR2L6, MTRNR2L8, MTRNR2L9 and MTRNR2L10. Comparing with the ones with GO term, only MTRNR2L3, MTRNR2L5 and MTRNR2L7 are missing in our expressed subset, since MTRNR2L11 and MTRNR2L13 are not in GO database. For the other genes not classified as pseudogenes in Ensembl-biotype, RP11-551L14.6 (lincRNA) is the only one detected as expressed (see Figure 8). MIR4484 (miRNA), RNU6-656P (snRNA) have shown very low expressed levels (0 for most of the tissues) and the other annotated RNAs are not included in RNA-seq data from GTEx. It is possible that due to their small size, they were not detected by the RNA-seq analysis.. 30.
(32) Figure 8. Ensembl-Biotype classification of expressed genes. Only 72 out of 452 genes with expression data in GTEx Portal are expressed (>= 0.5 TPM in at least one tissue). 62 out of these 72 genes are classified as pseudogenes in Ensembl-Biotype. For the other annotated genes, 8 corresponds to protein-coding genes, 1 lincRNA and any of the other annotated RNAs are expressed (miRNAs, antisense nor snRNA).. Focussing on the low, but expressed genes, some of the annotated genes includes the 100% of a mitochondrial tRNA (see Table 9). For example, the gene MTND5P1, which is originated mainly from the mitochondrial gene MT-ND5 (which represents the 84.66% of the nuclear gene), also contains the full sequence of three additional mitochondrial genes (MT-ND6, MT-TS2 and MT-TL2). Since in HGNC nomenclature of our total list of annotated Ensembl genes only includes two genes originated from mitochondrial tRNAs (TRNAQ41P in NUMT_17.007, which is not expressed, and TRNAS30P in NUMT_17.017, not included in GTEx dataset), maybe other tRNAs are not yet annotated as tRNAs or they are included as part of a bigger nuclear gene.. 31.
(33) Table 9. Genetic features of four low expressed genes. As an example, the table shows the corresponding NUMTs id, size, localization and the biotype classification for the nuclear-expressed genes detected in GTEx with < 0.5 TPM in all tissues. Additionally, it is also indicated the corresponding mitochondrial gene which sequence are included in the NUMTs, its biotype classification and the % of the nuclear gene that includes each mitochondrial gene and the % of the mitochondrial gene that is present in the nuclear gene. Gene symbol (GTEx). Ensembl Biotype (nuclear gene). Gene symbol (GTEx). Ensembl Biotype (mt. gene). % overlap nuclear gene. % overlap mito gene. MTND5P1. pseudogene. MT-ND6. protein_coding. 38.13%. 100%. MT-ND5. protein_coding. 84.66%. 100%. MT-TS2. Mt_tRNA. 1.19%. 100%. MT-TL2. Mt_tRNA. 11.96%. 100%. RP11-750B16.1. pseudogene. MT-CO1. protein_coding. 100%. 99.52%. RP11-28B23.1. pseudogene. MT-ATP6. protein_coding. 100%. 28.29%. RP11-269G24.7. pseudogene. MT-CO3. protein_coding. 100%. 35.48%. 3.4.2.. Mitochondrial Genes. Additionally, since the BioMart Bioconductor package also includes mitochondrial chromosome, the mitochondrial genes were also included in our analysis to see its pattern of expression through different tissues included in GTEx RNA-seq data (see Figure 9). At the expression level (online: File 16 “mean_tpm_GTExMITO.txt”), the 13 protein coding genes in mtDNA and the 2 rRNA are highly expressed, having all tissues an expression level of at least 500 TPM. However, in the case of tRNAs, some of them, are very low expressed or not expressed in some tissues. For example MT-TQ, MT-TW and MT-TD, which are 0 or < 0.5 in almost the 70% of the tissue tested. One of the most extreme cases is the ovary, where 13 tRNA are not expressed but the 15 mitochondrial proteins are highly expressed.. 32.
(34) Figure 9. Heat map with the expression profile of all mitochondrial genes. (A) Z-score (z = (x – μ) / σ) normalized by column, i.e. for each tissue independently, based on the expression profile of the different genes. (B) Z-score normalized by row, i.e. for each gene independently based on its expression profile in the different tissues.. 33.
(35) 4.. Discussion. The results of this study show that NUMTs not only originate pseudogenes, they also give rise to expressed genes in different tissues. Because of this, we emphasise the importance of its correct annotation in Ensembl Biotype and the additional gene databases. However, if the nucleus machinery translates the nuclear-expressed genes, they probably encode proteins with a different structure than its original mitochondrial proteins. In fact, Ensembl Biotype classifies most of these genes as pseudogenes due to this reason. Nevertheless, some of these genes are expressed, and deeper wet experimental studies will be needed to describe the localisation of its mRNAs, and proteins to elucidate its new or conserve function. As it is mentioned before, the mtDNA is continuously transferred to the nucleus DNA, and as a consequence, the mtDNA has been reduced since its initial fusion with eukaryotic cell two billion years ago [15]. This reduction is in part, due to the posttranslational relocalization of proteins coding within NUMTs genes. However, it is reported in yeast cells that mRNA from the nucleus can be re-localised to different organelles, including the mitochondrial, to its posterior translation [19]. If this phenomenon is also present in human cells, some of the detected genes within NUMTs may conserve its original function. However, our results also show that in the mitochondria, most tRNA are not expressed but all its protein-coding genes and rRNA are highly expressed. This observation should not surprise us since some eukaryotic mitochondrial do not have any tRNA encoded in its mtDNA [20]. That is possible due to the mitochondrial tRNA importation from old NUMTs [21]. The similar expression profile of mitochondrial genes and high and medium nuclear-expressed genes may be is a reflexion of the number of mitochondria in the cells of highly expressed tissues (heart and brain, which have a high energy demand) together with the demand to import mRNA or proteins coding from the nucleus to the mitochondria. Additionally, we suggest that some of these nuclear-expressed genes could be post-transcriptionally processed and tRNA encoded in them, could be imported to the mitochondria. Our results also highlight the importance of the genetic context where the mitochondrial origin DNA is inserted. For example, NUMT_01.001 seems to be inserted in a location where the expression is favoured since the 7 genes encoded in it, are the most highly expressed. Additional epigenetic studies will be needed to elucidate the characteristics of the chromatin in all insertions to show a possible correlation between expression and permissive or repressive histone marks or presence of DNA methylation.. Figure 10. Visualising NUMT_01.001 in UCSC genome browser. Screenshot of the seven genes within NUMT_01.001 in UCSC genome browser (hg19).. 34.
(36) The expression results we show are not complete. The fact that any annotated tRNA and miRNA were identified in GTEx as expressed may be due to the limitations of the RNA-Seq technique. Since document “Dynamic_Report_TFM.Rmd” contains all scripts needed to generate the expression tables automatically, once an updated version of RNA-seq means will be published, only by replacing the GTEx file, we can reanalyse our complete list of 456 genes.. 35.
(37) 5.. Conclusiones 5.1.. The general conclusion of the technical work. I. Bioconductor is a powerful tool to integrate different annotated gene data from different resources. II. The continuous collaboration of all bioinformatic community not only in Bioconductor but also in all repositories give us the opportunity to perform high-throughput studies impossible to perform a few years ago. III. The combination of all available data and in-home R-scripts give us the unique opportunity of downloading, filtering and classified in a relatively short-time big list of annotated features. IV. The combination of R-studio and RMarkdown allows the automatic analysis of a completely new input (in our case, genomic coordinates) by the generation of a new set of documents (tables in .txt, figures or reports in .html or .pdf...) in a simple way for people unfamiliar with programming.. 5.2.. The general conclusion of the scientific results. I. Not all genes within NUMTs are pseudogenes since we describe expression levels of more than 0.5 TPM in at least, one human tissue for 72 of these genes. II. The genetic context of the insertion influence the gene expression of genes within NUMTs since the first seven genes with higher level of expression are located within the same NUMT (NUMT_01.001). III. It is needed the manual change of at least, 63 genes classified as “pseudogene” in the Ensembl Biotype since these genes are expressed. IV. The differences in expression by tissue are similar between genes within NUMTs and mitochondrial genes. V. NUMTs insertions contribute to nuclear transcription being potentially an active source of new gene variation and evolution of eukaryotic organisms.. 5.3.. Achieved objectives. The main objective of this study was to elucidate if NUMTs are originating pseudogenes and we demonstrate that not all of them does, some NUMTs are also originated from nuclear-expressed genes. Once we get the gene expression information we expand our analysis to additionally study mitochondrial gene expression and we compare both results. This analysis was not included in the first objectives, but since high and medium expressed genes coding within NUMTs shows a clear pattern of expression in the different tissues, we consider it important.. 36.
(38) Additionally, all the specific objectives associated with bioinformatic analysis were achieved with some changes. The main technical objective was the creation of a complete list of annotated genes within our NUMTs together with different gene annotation, aim achieved during this work. The main change was not to use UCSC annotations but Ensembl annotations. We decided to focus on Ensembl annotated genes since are the ones associated with GTEx expression data. Some objectives were also not achieved. Mainly, the Gene Ontology statistical analysis due to the low number of genes in our list included in Gene Ontology Consortium. We additionally wanted to perform a conservative and epigenetic analysis if we did not get any expressed gene but as we show, 72 genes in our list are express and the bioinformatic analysis then focused on expression.. 5.4.. Follow-up fo the working plan. In general, the working plan was correctly followed-up except for the expression analysis. I had some problems to access to RNA-seq GTEx data, and I spent more time than originally planned for it. Additionally, since the genes were not included in Gene Ontology Consortium, the time investment planned for that proposed were replace for a more in-depth analysis and classification of our final dataset.. 5.5.. Future work. After this first study and with the data recollected in our output table, exists a big list of future studies, by both, wet and dry experiments, to be performed. First of all, by taking into consideration the representation of the origin mitochondrial gene, it could be proposed a description from those without gene symbol. For this propose and to better understand its functionality, other important in-silico analysis will need to study the protein structure of all expressed genes deeply. This information will give us a first idea of the potential function of this proteins. Additionally, wet experiment studying the localisation of this proteins will be needed. Other future studies could be the better characterisation of the NUMTs insertions’ genomic context. Especially, searching the epigenetic characteristics in the different tissues of NUMTs considering the gene position. A correlation between permissive histone marks and absence of DNA methylation in the corresponding gene promoters of the expressed genes but not in those tissues where the genes are silence give us the suggestion that the expression analysis from GTEx is complete. By observing these epigenetic characteristics in other parts of the NUMTs (and between 100 bp upstream and downstream the insertion) maybe suggest the existence of other genes not identified. Finally, since these NUMTs are insertions from the actual human mitochondrial DNA, an evolutionary analysis to see its conservation in other primates and mammals will be needed to elucidate its temporal insertion.. 37.
(39) 6.. Glossary ATP:. Adenosine triphosphate. bp: Base pair DNA: Deoxyribonucleic acid EMBL-EBI: European Molecular Biology Laboratory – European Bioinformatics Institute GO: Gene Ontology GTEx: HGNC:. Genotype-Tissue Expression HUGO Gene Nomenclature Committee. HUGO: Human Genome Organisation lincRNA: Long non-coding RNAs miRNA: Micro RNA mRNA: Messenger RNA mtDNA: Mitochondrial DNA ncRNA: Non-coding RNAs NUMT:. Nuclear mitochondrial DNA sequences. RNA: Ribonucleic acid RNA-seq: RNA sequencing rRNA:. Ribosomal RNA. snoRNA: Small nucleolar RNAs snRNA: Small nuclear RNA TPM: Transcripts Per Million) tRNA: Transfer RNA UCSC: University of California, Santa Cruz. 38.
(40) 7.. Bibliography. [1] P. van den Boogaart, J. Samallo, and E. Agsteribbe, “Similar genes for a mitochondrial atpase subunit in the nuclear and mitochondrial genomes of neurospora crassa,” Nature, vol. 298, no. 5870, p. 187, 1982. [2] T. Tsuzuki, H. Nomiyama, C. Setoyama, S. Maeda, and K. Shimada, “Presence of mitochondrial-dna-like sequences in the human nuclear dna,” Gene, vol. 25, no. 2, pp. 223–229, 1983. [3] E. Richly and D. Leister, “NUMTs in sequenced eukaryotic genomes,” Molecular biology and evolution, vol. 21, no. 6, pp. 1081–1084, 2004. [4] J. V. Lopez, N. Yuhki, R. Masuda, W. Modi, and S. J. O’Brien, “Numt, a recent transfer and tandem amplification of mitochondrial dna to the nuclear genome of the domestic cat,” Journal of Molecular Evolution, vol. 39, no. 2, pp. 174–190, 1994. [5] G. Dayama, S. B. Emery, J. M. Kidd, and R. E. Mills, “The genomic landscape of polymorphic human nuclear mitochondrial insertions,” Nucleic acids research, vol. 42, no. 20, pp. 12640–12649, 2014. [6] D. Bensasson, D.-X. Zhang, D. L. Hartl, and G. M. Hewitt, “Mitochondrial pseudogenes: Evolution’s misplaced witnesses,” Trends in ecology & evolution, vol. 16, no. 6, pp. 314–321, 2001. [7] A. Goios, L. Prieto, A. Amorim, and L. Pereira, “Specificity of mtDNA-directed pcr—influence of nuclear mtdna insertion (numt) contamination in routine samples and techniques,” International journal of legal medicine, vol. 122, no. 4, pp. 341–345, 2008. [8] D. Simone, F. M. Calabrese, M. Lang, G. Gasparre, and M. Attimonelli, “The reference human nuclear mitochondrial sequences compilation validated and implemented on the ucsc genome browser,” BMC genomics, vol. 12, no. 1, p. 517, 2011. [9] D. Lascaro, S. Castellana, G. Gasparre, G. Romeo, C. Saccone, and M. Attimonelli, “The rhnumts compilation: Features and bioinformatics approaches to locate and quantify human numts,” BMC genomics, vol. 9, no. 1, p. 267, 2008. [10] J. M. Kidd et al., “Mapping and sequencing of structural variation from eight human genomes,” Nature, vol. 453, no. 7191, p. 56, 2008. [11] A. Ramos et al., “Nuclear insertions of mitochondrial origin: Database updating and usefulness in cancer studies,” Mitochondrion, vol. 11, no. 6, pp. 946–953, 2011. [12] D. Mishmar, E. Ruiz-Pesini, M. Brandon, and D. C. Wallace, “Mitochondrial dna-like sequences in the nucleus (numts): Insights into our african origins and the mechanism of foreign dna integration,” Human mutation, vol. 23, no. 2, pp. 125–133, 2004.. 39.
(41) [13] Huber, Wolfgang, et al. "Orchestrating high-throughput genomic analysis with Bioconductor." Nature methods 12.2 (2015): 115. [14] Gentleman, Robert C., et al. "Bioconductor: open software development for computational biology and bioinformatics." Genome biology 5.10 (2004): R80. [15] Lane, Nick, and William Martin. "The energetics of genome complexity." Nature 467.7318 (2010): 929. [16] Stewart, James B., and Patrick F. Chinnery. "The dynamics of mitochondrial DNA heteroplasmy: implications for human health and disease." Nature Reviews Genetics 16.9 (2015): 530. [17] Neupert, Walter, and Johannes M. Herrmann. "Translocation of proteins into mitochondria." Annu. Rev. Biochem. 76 (2007): 723-749. [18] Schmidt, Oliver, Nikolaus Pfanner, and Chris Meisinger. "Mitochondrial protein import: from proteomics to functional mechanisms." Nature reviews Molecular cell biology 11.9 (2010): 655. [19] Weis, Benjamin L., Enrico Schleiff, and William Zerges. "Protein targeting to subcellular organelles via MRNA localization." Biochimica et Biophysica Acta (BBA)-Molecular Cell Research 1833.2 (2013): 260-273. [20] Adams, Keith L., and Jeffrey D. Palmer. "Evolution of mitochondrial gene content: gene loss and transfer to the nucleus." Molecular phylogenetics and evolution 29.3 (2003): 380-395. [21] Schneider, André. "Mitochondrial tRNA import and its consequences for mitochondrial translation." Annual review of biochemistry 80 (2011): 1033-1053.. 40.
(42) 8.. Supplementary information. In the next pages, the full content of “Dynamic-report-TFM.pdf” is shown, together with all scripts created to generate all datasets and graphs.. 41.
(43) Dynamic Report - TFM Marta Sanchez Delgado 5 de junio, 2018. Contents 1 Initial instructions 1.1 Downloading expression file from GTEx . . . . . . . . . . . . . . . . . . . . . . . . . . . . 1.2 General instructions to update input file . . . . . . . . . . . . . . . . . . . . . . . . . . . .. 2 2 2. 2 Context. 3. 3 Visualization of NUMTs in UCSC genome browser. 3. 4 Installing only packages we need. 4. 5 Input file format. 5. 6 All 6.1 6.2 6.3 6.4 6.5 6.6 6.7 6.8 6.9. intermediate files and the final table File 1 and 2: “All_attributes.txt” & “All_filters.txt” . . . . . . . . File 3: “gene_results.txt” . . . . . . . . . . . . . . . . . . . . . . . File 4 and 5: “up_gene_results.txt” and “down_gene_results.txt” File 6: “genes.txt” . . . . . . . . . . . . . . . . . . . . . . . . . . . File 7: “go_results.txt” . . . . . . . . . . . . . . . . . . . . . . . . File 8: “phenotype_results.txt” . . . . . . . . . . . . . . . . . . . . File 9: “mean_tpm_GTEx.txt” . . . . . . . . . . . . . . . . . . . . File 10: “subset_expressed.txt” . . . . . . . . . . . . . . . . . . . . File 11: “FINAL_OUTPUT_TABLE.txt” . . . . . . . . . . . . . .. 7 References. . . . . . . . . .. . . . . . . . . .. . . . . . . . . .. . . . . . . . . .. . . . . . . . . .. . . . . . . . . .. . . . . . . . . .. . . . . . . . . .. . . . . . . . . .. . . . . . . . . .. . . . . . . . . .. . . . . . . . . .. . . . . . . . . .. 6 6 7 7 8 8 9 10 10 17 20. 1.
(44) 1 1.1. Initial instructions Downloading expression file from GTEx. The first step to correctly generate all expression information from your initial coordinates is to download the GTEx_Analysis_2016-01-15_v7_RNASeQCv1.1.8_gene_median_tpm.gct file from: https: //gtexportal.org/home/datasets. Gene expression on the GTEx Portal are shown in Transcripts per Million (TPM), and the samples come from the 1000 genomes project. The downloaded file contains median gene counts (in TPM) by tissue (53 in total).. 1.2. General instructions to update input file. All R-scripts are in the first part of the document Scripts-TFM.R. However, the corresponding Dynamic report-TFM.Rmd can be used to generate the new set of output files automatically. IMPORTANT: Fist read ‘Dynamic report-TFM.pdf‘ for ‘input file format‘. Then, you need to copy your input document in the folder containing ‘Dynamic reportTFM.Rmd‘ and indicate in the next lines your input CVS file name. To change the input file you need to change the name of the .csv (NUMTs_coord.csv) document in the begining of this document:. Figure 1: Screenshot instruction to change the name of the ‘input file‘. In the begining of the document you have the ‘params‘ subsection, the ‘file1:‘ corresponds to the ‘input file‘ with the initial coordinates. Now all the output files and all the information on Dynamic report-TFM documents will be generated with your new .csv data-table named NUMTs_coord.csv. IMPORTANT: Once you have done this first step, you can generate your new .html, which will have all data updated by pressing ‘Knit‘ (See next figure). Maybe this will take more than an hour. The following pages will be generated with the new information. Now you have all data, statistics and tables updated with the coordinates in document NUMTs_coord.csv. 2.
(45) Figure 2: Screenshot instruction for generate the new .html file. In RStudio, by using R Markdown, we can generate the corresponding .html file by pression ‘Knit‘ (in the upper-left part of the first square in RStudio).. 2. Context. The following scripts were generated for the final master’s project in Bioinformatics and Biostatistics (Universitat Oberta de Catalunya) entitle Are Nuclear Insertions of Mitochondrial Origin Pseudogenes?. This Master’s project focussed on the study of Nuclear mitochondrial DNA sequences (NUMTs). NUMTs are the result of a continuous DNA transfer from mitochondria to the nucleus (Boogaart, Samallo, and Agsteribbe 1982; Tsuzuki et al. 1983). In 2011, in a published work led by Dr Cristina Santos, it was identified 755 NUMTs in the human genome (Ramos et al. 2011). They compared the human mtDNA (NC_012920) against human genome (GRCh37/hg19 assembly), and they described different aspects of this comparisons: frequency, distribution and size of NUMTs for each chromosome; % identity between NUMTs and mtDNA sequence. . . Based on this information and NUMTs coordinates, in the present master’s final project, we want to clarify whether or not these NUMTs origin pseudogenes. The present dynamic report generates a set of intermediate (.txt documents) and a final file called FINAL_OUTPUT_TABLE.txt with all relevant genetic content and with a more in-depth expression and gene ontology study in the genes encoded in this NUMTs. Additionally, we also perform a small conservation study of these regions in the genome of other primates. By changing the input document, and following the next instruction, it is possible to generate a new set of intermediate and final documents with the new outputs.. 3. Visualization of NUMTs in UCSC genome browser. First of all, with the NUMTs coordinates publically available by Ramos et al. (2011), we created the file bed_NUMTs-ID.txt, which can be uploaded to UCSC genome browser –> custom track to visualise our NUMTs. The bed_NUMTs-ID.txt also include the corresponding mitochondrial regions for each NUMT, with the same NUMT ID by adding “mt” in the beginning.. 3.
(46) Figure 3: Custom Track NUMNTs visualization in UCSC Genome Browser. The first track on the picture is our Custom Track from the document "bed_NUMTsID.txt".. 4. Installing only packages we need. Depending on the computer and session, we already have some R packages installed. To install only the ones we need we will use the following script: ######## PART 1: Scripts from Dynamic_report_TFM.Rmd ########## # Installing package if needed ---list.of.packages <- c("rstudioapi", "dplyr", "xlsx", "rJava", "gplots", "devtools", "ggplot2") new.packages <- list.of.packages[!(list.of.packages %in% installed.packages()[,"Package"])] if(length(new.packages)) install.packages(new.packages) However, to generate our data, we also need to download special packages from Bioconductor: IMPORTANT: If you cannot install Bioconductor’s biomaRt package by using ‘biocLite("biomaRt")‘, in Linux, if you have administrative privileges, you can write in the command line: ‘sudo apt-get install r-bioc-biomart‘ to install it.. 4.
(47) 5. Input file format. The document must be .csv with comma (",") separator, which is the one automatically used in most programmes like Excel or LibreOffice Calc when we save the data as .csv. The first line of the document will be the Column names. The First column will name as id (with any ID you wanted to use), second column chr (with the number of the corresponding chromosome), third start_n with the starting bp coordinate and then end_n with the end pb coordinate. The last three columns will be additional information. In the case of the original document created for this final master’s project corresponds to the coordinates mapping these regions in the mitochondrial: 6th column entitle mt and in all cases “mt” because is how mitochondrial DNA is recognised, and then both, initial start_mt and final end_mt coordinates in the mitochondrial DNA. ## 'data.frame': 756 obs. of 7 variables: ## $ id : Factor w/ 756 levels "NUMT_01.001",..: 1 2 ... ## $ chr : Factor w/ 24 levels "1","10","11",..: 1 1 ... ## $ start_n : int 564461 5614806 ... ## $ end_n : int 570304 5614937 ... ## $ mt : Factor w/ 1 level "mt": 1 1 ... ## $ start_mt: int 3911 9453 ... ## $ end_mt : int 9755 9583 ... ## ## ## ## ## ## ##. 1 2 3 4 5 6. id chr start_n end_n NUMT_01.001 1 564461 570304 NUMT_01.002 1 5614806 5614937 NUMT_01.003 1 5910318 5910528 NUMT_01.004 1 8969802 8969967 NUMT_01.005 1 9634687 9634887 NUMT_01.006 1 11202904 11202975. mt start_mt end_mt mt 3911 9755 mt 9453 9583 mt 2466 2675 mt 8040 8205 mt 907 1117 mt 12293 12358. The file NUMTs_coord.csv contains a total of 756 rows with coordinates.. 5.
(48) 6. All intermediate files and the final table. 6.1. File 1 and 2: “All_attributes.txt” & “All_filters.txt”. To download the list of genes within our initial coordinates and its associated phenotype description, gene ontology (GO) and conservation in other species, we use biomaRt package from Bioconductor: 6.1.1 ## ## ## ## ## ## ## ## ## ## ## ## ## ## ## ##. The biomaRt package. To cite the biomaRt package in publications use: Mapping identifiers for the integration of genomic datasets with the R/Bioconductor package biomaRt. Steffen Durinck, Paul T. Spellman, Ewan Birney and Wolfgang Huber, Nature Protocols 4, 1184-1191 (2009). BioMart and Bioconductor: a powerful link between biological databases and microarray data analysis. Steffen Durinck, Yves Moreau, Arek Kasprzyk, Sean Davis, Bart De Moor, Alvis Brazma and Wolfgang Huber, Bioinformatics 21, 3439-3440 (2005). To see these entries in BibTeX format, use 'print(<citation>, bibtex=TRUE)', 'toBibtex(.)', or set 'options(citation.bibtex.max=999)'.. 6.1.2. Preparing Package ‘biomaRt’. We set up the dataset we will use, specifically, ensembl_MART_ensembl, which is working with the version: It is automatically generated the first two files: All_attributes.txt (with all attributes you can download with biomaRt package) and All_filters.txt (with all filters to select the information to use from your input file). The dimensions of File 1 are: 1416, 3 and the dimensions of File 2: 303, 2. 6.
Figure


![Figure 3. Circular human mitochondrial DNA. Representation of all genes annotated in the human mitochondrial DNA and the initiation sites for both heavy and light strands transcription [16]](https://thumb-us.123doks.com/thumbv2/123dok_es/7334200.359361/23.894.171.711.103.657/circular-mitochondrial-representation-annotated-mitochondrial-initiation-strands-transcription.webp)
+7

Documento similar
Virulence genes and phenotypic features of the Klebsiella isolates analysed in this study: The presence of genes involved in virulence, i.e., magA and rmpA
The Dwellers in the Garden of Allah 109... The Dwellers in the Garden of Allah
Next, we evaluated the effect of melatonin treatment on BAT mitochondrial nitrite levels and found that the levels of mitochondrial nitrites in brown fat depots were higher in
The expression of Hamp1 (hepcidin gene) and its regulatory genes showed no differences in the LysM model, indicating that it should be the LPI environment that are the route of
The categories of GO terms for biological processes that are over-represented in each set of differentially expressed genes are the following: common up-regulated (A)
The majority of Hox genes of the a, b and c clusters are preferentially expressed in HSC-enriched subpopulations and in immature progenitor compartments and they are down-
Phylogenetic relationships among “large” shelled species (C. trochulus) were further examined using partial mitochondrial genes and results indicated the existence
The genes that were included in group 2 (apoptosis and cell senescence) were the most frequently altered in the present meningioma study, as 7 out of 14 (50%) genes were abnormally
