Transport in an integrating Europe: sustainable development and cohesion
12
0
0
Texto completo
(2) 164. R. Vickerman. Increasing transport intensity could be considered a surprising outcome in the first instance. Generally the mass of goods has been falling and the growth of electronic communication could be seen as a substitute for much physical transport. Both of these factors would imply a falling transport content of most production. However, the falling cost of transport may lead to the substitution of transport for other more expensive factors of production. Individuals’ preferences for variety see them using cheaper transport as a means of widening access to more destinations. At the same time rising incomes lead to a preference for a greater variety of goods. Given the importance of scale economies in manufacturing production, this implies the need to source these goods from a greater variety of locations, hence the growth of intra-industry trade. Technical advances in transport have reduced transport costs substantially, but in a world of increasing returns firms need to exploit differences in input costs in different locations. The removal of the transport cost constraint on integration may thus lead to an increase in spatial specialisation and concentration which itself induces an increased demand for transport. Understanding these relationships between transport and the economy is critical to achieving a more sustainable European transport system, and to the process of cohesion in the European economy, Attempts to curb transport growth which do not also consider the impact on the structure of production and markets may produce a less sustainable system. On the other hand, moves to ensure the correct pricing of transport services are an essential input to efficient decision making about the optimal location for production and the optimal allocation of resources between different products and services. In this paper we explore some of the dynamics of this system, highlighting the way in which the modelling of the transport system needs to interact with that of the rest of the economy. The argument is developed in four main sections in which we discuss successively transport intensity, the links between transport and trade, and transport and activity patterns, before dealing with the complex relationship between competitiveness, cohesion and sustainability. First, however, we discuss the key underlying forces which make this an important subject for study.. 2.. Motivation. The starting point for this discussion is the observation of Krugman (1991) that regional specialisation in the EU was much less than in the US. Krugman took this as an indicator of the extent to which the EU was much a less integrated economy than the US. The degree of regional specialisation has important implications for regional convergence, but also for transport. We do not propose to investigate the regional convergence issue here to any great extent (for a useful discussion see Tondl, 2001). The key issue here is the degree to which specialisation causes regions to suffer from asymmetric shocks and hence to be deflected from their underlying growth paths. Specialisation has a twofold impact on transport. A greater degree of specialisation implies the need for a greater degree of specialised transport. This may make it more difficult for a region to diversify by attracting new types of industry since the.
(3) Transport in an Integrating Europe: Sustainable Development and Cohesion. 165. supply of transport is geared to the needs of the current industrial structure. The more specialised are the transport needs of an industry, the more difficult it may be for it to be footloose in seeking new locations. The increasingly specialised transport needs of industries, specialist handling, safety and security issues etc. may be making this a more difficult issue at the same time as transport generally is seen to have a less significant role in locations decisions in terms of the pure cost considerations. The second, and more immediate, concern is the relationship between specialisation and transport intensity, which we shall consider in more detail in the following section. A more specialised region’s firms are more likely to have to trade for both inputs and markets with other regions and hence require a larger input of transport for a given output. Increasing specialisation within the EU (see, for example, Brülhart, 1998; Amiti, 1998; and Midelfart-Knarvik and Overman, 2002, for evidence) is thus likely to be a root cause of increases in freight transport, measured in terms of tonne-km, observed in the EU recently (see Vickerman, 2003, for a more detailed discussion). This increase in specialisation is a result of two sets of forces operating within the EU. Globalisation is leading to an increased international division of labour which implies more specialisation at the local level whilst within the EU the past decade or so has seen an increased pace of «regional» integration with the push to completion of the single market programme. The additional impact of the process of transition in the economies of Central and Eastern European Countries (CEEC), and their moves towards membership of an enlarged EU, has reinforced this process. Indeed, given the disparities in costs between most of the EU15 and the CEEC10, it is likely that a process of continuing realignment in the structure and performance of regional economies will continue. As well as the direct problems for regional growth and convergence, this process brings with it further difficulties which could have a continuing impact on both the degree of specialisation and its consequences. Increasing problems of congestion in EU «core» constitute a threat to future growth in these regions, whilst inadequacies (perceived as well as real) in the supply of both infrastructure and transport services in peripheral regions, especially in the accession countries act as a constraint on their progress. This has given rise to increasing concern about the need to «decouple» transport growth and economic growth such that the latter can be freed from one of its less desirable consequences. Underlying this is one often overlooked assumption, not only that there will be continuing increases in mobility as a natural reflection of increasing incomes and economic integration, but also that this is in many respects desirable as an expression of freedom of choice and a contribution to welfare.. 3.. Transport intensity. The transport intensity debate has developed surrounding the issue of decoupling economic growth and transport growth. If the concept of transport intensity has any substantive meaning (see SACTRA, 1999, for a discussion of this) it is an attempt to capture a measure of the amount of transport needed per unit of output. Thus is expresses the.
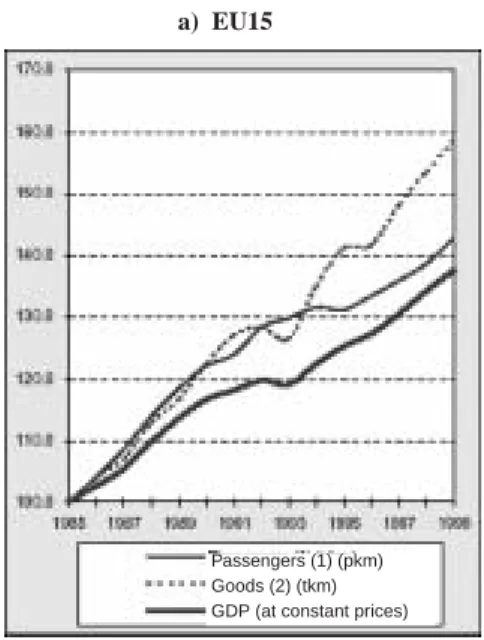
(4) 166. R. Vickerman. relative rates of growth of, for example, tonne-km of freight and GDP (see Vickerman, 2003, for a discussion of alternative measures of transport output). Why this has become an issue is that until around the mid-1980s there was a fairly constant relationship in the EU between transport growth and GDP growth; for freight this was an elasticity of about unity. Hence freight forecasts could be made fairly accurately on the basis of economic growth forecasts. From that time onwards this relationship has broken down and freight transport has grown much more rapidly than economic growth (Figure 1). Figure 1. Transport Growth and Economic Growth a) EU15. Passengers (1) (pkm) Goods (2) (tkm) GDP (at constant prices). Notes: (1): passenger cars, buses & coaches, tram+metro, railways, air. (2): road, rail, inland waterways, pipelines, sea (intra-EU).. b) CEEC 140 120. Index 1989=100. 100 80 60 40 20 0 1989. 1990. 1991. 1992 tonne-km. 1993. 1994 GDP. 1995. 1996 road tkm. 1997. 1998 rail tkm. 1999.
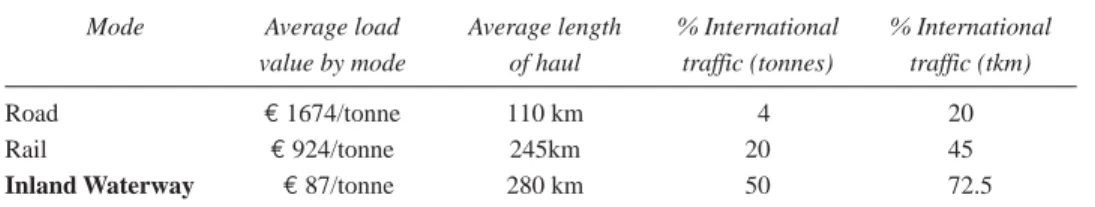
(5) Transport in an Integrating Europe: Sustainable Development and Cohesion. 167. Although most of the discussion about transport intensity has concerned freight, since this is the area where long-run patterns changed most significantly, there are also parallel issues relating to passenger transport. The important factor to bear in mind with transport intensity measures is that the transport element is usually measured as tonne- or passenger-km. Hence changes can be influenced by both changes in the volume of trips being generated (and in the case of freight, the volume of the goods being carried) and the length of each trip. For freight this is important because there has been a tendency for a fall in the weight of goods being transported, due to structural changes in industry, and an increase in the value to weight ratio, thus tending to reduce the weight of goods lifted. This has been more than counteracted by increases in trade, increases in regional specialisation and increases in the length and complexity of the logistics process, both transport and production logistics. Hence, for any given weight of goods moved, the length of haul has increased more rapidly. Similar considerations can be applied to passenger transport. The number of trips per person has not increased significantly, but for most journey purposes the average trip length has increased (see Rietveld and Vickerman, 2003, for further discussion). Perhaps the most interesting observation is that the time an average person spends travelling has remained remarkably constant over the past 50 years, despite the enormous increases in speed by most modes. In order to explore this issue further it is useful to return to two simple concepts: transport as a derived demand and transport as a substitutable input. The derived demand concept is the traditional starting point for any study of transport demand. It implies a fairly constant relationship between economic activity and transport, but it also importantly suggests that the direction of causality in the relationship runs from the activity to transport and not vice versa. The problem which we currently face is that this relationship appears to a large extent to have broken down. What is not so clear is whether this due to a behavioural change in the relationship or a reflection of relatively cheaper transport being substituted for other inputs in the activity production process. The falling real costs of transport have an important part to play here. Increasing efficiency, both in the technical production of transport (more efficient engines, greater carrying capacity of vehicles), and through the removal of monopolistic influences (including state-ownership). We have already alluded to the role of increased speed and the apparent «death of distance», but the changing role of transport in the logistics process has had a major impact.. Table 1. Mode Road Rail Inland Waterway. Values and lengths of haul, EU. Average load value by mode. Average length of haul. % International traffic (tonnes). % International traffic (tkm). € 1674/tonne € 924/tonne € 87/tonne. 110 km 245km 280 km. 4 20 50. 20.8 45.8 72.5. Source: European Commission, Energy and Transport Statistics.
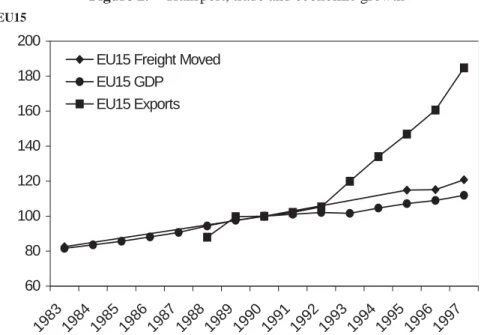
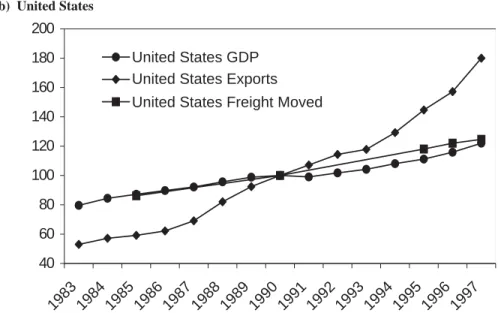
(6) 168. R. Vickerman. This has culminated in a substantially changed nature of what we really understand by «transport». This suggests that long-term comparisons of transport growth with economic growth are meaningless because the entire spatial nature of economic activity has changed. We examine this is in more detail in the next two sections, looking first at the link with changing trade patterns and then with changing activity patterns.. 4.. Transport and trade. We know that there are strong links between trade and economic growth. Exports are an important determinant of growth in standard growth models, especially at the regional level. If trade is growing then we must expect both international and domestic transport to grow. This is a simple application of the derived demand hypothesis. The evidence suggests (Figure 2) that for both the EU and the US trade has grown much faster than GDP in recent years (see Vickerman, 2002, for a fuller discussion). Comparable tonne-km data is not easily available for international transport outside the EU (essentially deep-sea and air freight) and hence we have to rely on data for landbased transport. By this definition, transport, in terms of tonne-km has grown more rapidly than GDP, but less rapidly than trade and more rapidly in the EU than in the US. This is consistent with the expectation that globalisation and changing economic structure has dominated the trade sector and that in the trade sector at least the fall in the volume of goods has dominated the rise in lengths of haul.. Figure 2. Transport, trade and economic growth a) EU15. 200 180 160. EU15 Freight Moved EU15 GDP EU15 Exports. 140 120 100 80. 19 83 19 84 19 85 19 86 19 87 19 88 19 89 19 90 19 91 19 92 19 93 19 94 19 95 19 96 19 97. 60. Source: OECD (1999); European Commission (2000)..
(7) Transport in an Integrating Europe: Sustainable Development and Cohesion. 169. b) United States. 200 United States GDP United States Exports. 180 160. United States Freight Moved 140 120 100 80 60. 86 19 87 19 88 19 89 19 90 19 91 19 92 19 93 19 94 19 95 19 96 19 97. 85. 19. 84. 19. 19. 19. 83. 40. Source: OECD (1999); European Commission (2000).. The relationship between trade and domestic transport depends both on the location of trade-related activities (e.g. hauls to and from ports and airports), and on the structure of such activities. If tradable goods have a larger number of production stages, more complex production logistics, etc., then an increasing trade sector will imply an induced increase in transport activity. This can be seen most clearly in the changing trade and transport patterns of the CEEC (Figure 3) where there has been both a structural and a geographical shift since Figure 3. CEEC Trade with EU15 30.000. 25.000. Bulgaria. mn ECU/EURO. Czech Rep. Estonia. 20.000. Hungary Latvia. 15.000. Lithuania Poland. 10.000. Romania Slovakia. 5.000. Slovenia. 0 1993. 1994. 1995. 1996. 1997. 1998. 1999. 2000.
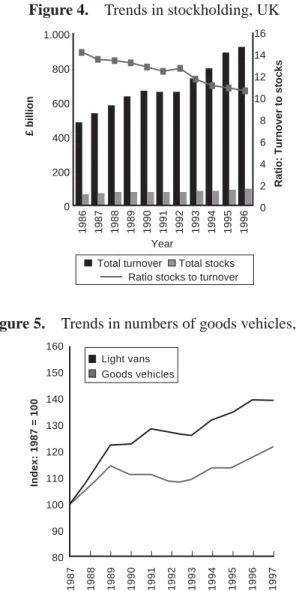
(8) 170. R. Vickerman. the beginning of transition. The traditional old heavy industries and an orientation of trade towards the Soviet Union have been replaced by newer manufacturing industries and markets in the EU. Not only have the aggregate flows changed, but the modal split has shifted from almost complete dominance of rail to a rapid rise of road transport.. 5.. Transport and activity patterns. The lessons which can be learned from an examination of aggregate trade flow relationships are limited since the major changes have been happening at the more microlevel of the way activities are produced. We have referred already to changes in the nature of goods produced. This is not just a matter of changing value to weight ratios as economies have moved from the reliance on traditional heavy industries to ones dominated by consumer goods. A particular feature of the process of integration experienced in the EU has been the increasing importance of intra-industry trade within the Union. Intra-industry trade is associated with increasing product differentiation, which is driven in part by increasing preferences for product variety with increasing income levels and in part by the increasing incidence of imperfect competition in markets. In order to exploit scale economies, firms need larger markets than provided by the home markets of most EU member states and hence we expect to see increasing trade in similar products. This involves, in effect, substantial cross-hauling of goods and hence an increase in the transport content of consumption. This process does not only affect final consumption, it also affects all stages of the production process. This means that as well as finding wider markets for their products, firms source inputs over a wider area and, most significantly, may locate different stages of the production process in a wider range of locations. Thus there has been a move in many sectors away from the integrated production process to a dispersed process, but one linked by more reliable transport. This is associated with the growth of just-in-time production processes for which it is not the absolute cost of transport which is important, but the expected variance in that cost. The variance depends essentially on reliability since total delivery times become less important than the precise timing of each delivery (for an example of the effect on one industry see McCann and Fingleton, 1996). The overall effect is most easily seen as a change in the levels of stockholding relative to turnover (Figure 4) As well as these changes in production logistics, changes in the nature of transport have had an important role. To some extent this is a continuing fall in the real cost of transport occasioned both by improving technical efficiency and much greater organisational efficiency in the supply of transport. Technical efficiency has been associated with improvements in both infrastructure and vehicle technology. This is reflected most particularly in increases in speed, although some of the cost advantage of these increases has been lost through induced growth in traffic leading to congestion. Organisational efficiency has been created both through better vehicle management (increases in vehicle utilisation and load factors) such that the growth in the vehicle fleet has been much less than the increase in traffic (Figure 5)..
(9) Transport in an Integrating Europe: Sustainable Development and Cohesion. 171. Figure 4. Trends in stockholding, UK 14. £ billion. 800. 12 10. 600. 8 400. 6 4. 200. 1996. 1995. 1994. 1993. 1992. 1991. 1990. 1989. 1988. 1987. 1986. 2 0. Ratio: Turnover to stocks. 16. 1.000. 0. Year Total turnover Total stocks Ratio stocks to turnover. Figure 5. Trends in numbers of goods vehicles, UK 160 Light vans Goods vehicles. Index: 1987 = 100. 150 140 130 120 110 100 90. 1997. 1996. 1995. 1994. 1993. 1992. 1991. 1990. 1989. 1988. 1987. 80. Year. Passenger transport has displayed some similar changes. Just as increasing incomes have led to the demand for an increase in the variety of goods, so the pattern of activities undertaken by individuals has diversified. Thus increases in the demand for non-work related travel have occurred, not so much in terms of increases in the volume of trips, but more in increases in trip lengths. Such increases are also found in journeys to and from work relating to the increasing dispersion of residences relative to workplaces. This latter is an important factor as it demonstrates the way that labour market areas have been increasing, with implications for wages (and hence firms’ costs). Changes in mobility patterns also reflect supply side factors with both the increase in car ownership and the impact of spatial planning, which has led to the deve-.
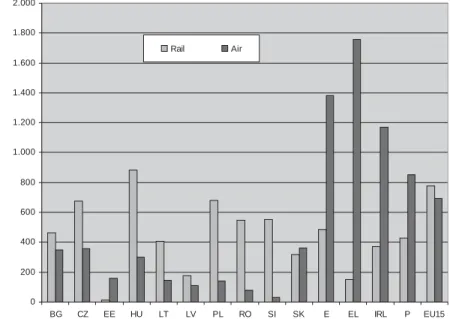
(10) 172. R. Vickerman. lopment of out-of-town shopping and leisure facilities. We assume here that car ownership is typically more about consumption expenditure reacting to higher incomes than occasioned by the demand for a different range of activities. However, this acts as an inducement to the decentralisation of activities for which a car ultimately becomes essential for access. There is thus a sort of creeping inducement to increased mobility which it is difficult to relate to an increase in welfare, contrary to the assumptions of much policy. The rise in car ownership in the CEEC is already causing serious problems by outstripping the ability to develop infrastructure whilst increasing the problems for public transport supply and highlighting the serious inequalities in the availability of mobility in poorer regions. Although we might consider increasing mobility to be almost exclusively associated with the rise of private car transport, the largest, and most worrying increases in mobility have been in air transport. This is still a relatively small proportion of total passenger-km, but its rate of increase and the way it affects more peripheral regions has important implications for the CEEC (Figure 6).. 6.. Competitiveness, cohesion and sustainability. What conclusions can be drawn from this overview of the situation, and in particular what lessons need to be drawn for an effective integration of the CEEC? These can be drawn together as four basic questions. First, how far does improving transport infrastructure aid competitiveness? We have seen that infrastructure is only one element in the changing supply of transport, Figure 6. Passenger mobility by rail and air, CEEC and EU4 2.000 1.800 Rail. Air. 1.600. pkm/person/year. 1.400 1.200 1.000. 800 600 400. 200 0 BG. CZ. EE. HU. LT. LV. PL. RO. SI. SK. E. EL. IRL. P. EU15.
(11) Transport in an Integrating Europe: Sustainable Development and Cohesion. 173. and changes in supply have to be set in their place against important changes in demand, especially for increasing variety. Changes in the supply price of transport may also be just as much occasioned by improving efficiency in the organisation of transport and by the way in which transport is integrated into the overall logistics process. Thus it is important to place transport in its clear context as one element in total costs. Changes in transport prices do not automatically lead to equivalent changes in total transport costs, but they may still have a critical role in the determination of a firm’s competitiveness (and hence the competitiveness of a region). Secondly, how far can improving transport infrastructure and aiming for «sustainable mobility» as an objective aid cohesion? Worries here centre upon the use of indicators of infrastructure provision and mobility as part of the definition of the lack of cohesion between regions. Such indicators risk becoming targets without asking the question as to what are the transport needs of a particular region and its population? This may be especially pertinent in the CEEC where free mobility has a particular connotation and infrastructure is generally poor for all modes. Thirdly, is mobility ever sustainable? The problem with sustainable mobility as both a concept and a target is that it implies the idea of certain levels of mobility (of both goods and people) as norms which become the aims of policy without asking the question as to what levels of mobility are needed, are they region specific, how far do they depend on particular structures of demand, or supply, or of spatial organisation? Finally, how does an inherently divergent economy achieve sustainability without requiring sacrifices – and by whom? Studies of regional convergence show a persistency in regional disparities. Attempts to reduce these disparities by conventional regional policy measures such as those present in the EU’s Structural and Cohesion Funds may not only be ineffective (see for example Boldrin and Canova, 2001), but may also be fundamentally unsustainable. To make a policy both effective in reducing disparities and sustainable for the whole (enlarged) EU, will require some groups to make sacrifices in favour of others. It is not necessarily clear that this will always be the «rich» making sacrifices for the «poor». Scenarios can be developed in which the poorer regions of new members of the EU have to make long terms sacrifices in the interests of preventing the EU economy grinding to a halt and becoming unsustainable. That is a real policy (and political) challenge.. References Amiti, M. (1998): «New trade theories and industrial location in the EU: a survey of evidence». Oxford Review of Economic Policy, 14(2):45-53. Boldrin, M. and Canova, F. (2001); «Inequality and convergence in Europe’s regions: reconsidering European regional policies». Economic Policy, 32:388-426. Brülhart, M. (1998): «Economic geography, industry location and trade: the evidence». The World Economy, 21:775-802. Krugman, P. (1991): Geography and Trade. Cambridge, Mass: MIT Press. McCann, P. and Fingleton, B. (1996): «The regional agglomeration impact of just-in-time input linkages: Evidence from the Scottish Electronics Industry». Scottish Journal of Political Economy, Vol. 43, Issue 5:493-518..
(12) 174. R. Vickerman. Midelfart-Knarvik, K.H. and Overman, H.G. (2002): «Delocation and European integration: is structural spending justified?». Economic Policy, 35:323-359. Rietveld, P. and Vickerman, R. (2003): «Transport in Regional Science: is the “death of distance” premature», paper for Special Issue of Papers in Regional Science. SACTRA (Standing Advisory Committee on Trunk Road Assessment) (1999): Transport and the Economy. London: The Stationery Office. Tondl, G. (2001): Convergence after Divergence? Regional Growth in Europe. Vienna: Springer-Verlag. Vickerman, R.W. (2002): «Sustainable mobility in an age of internationalisation»; in The Region in the New Economy, ed. Yoshiro Higano, Peter Nijkamp, Jacques Poot, Kobus van Wijk. Aldershot: Ashgate, pp. 313-327. Vickerman, R.W. (2003): «Freight Traffic»; in Managing the Fundamental Drivers of Transport Demand. Proceedings of the International Seminar December 2002, European Conference of Ministers of Transport, Paris: OECD, pp. 15-25..
(13)
Figure
+3
Documento similar
Government policy varies between nations and this guidance sets out the need for balanced decision-making about ways of working, and the ongoing safety considerations
The expansionary monetary policy measures have had a negative impact on net interest margins both via the reduction in interest rates and –less powerfully- the flattening of the
Jointly estimate this entry game with several outcome equations (fees/rates, credit limits) for bank accounts, credit cards and lines of credit. Use simulation methods to
In our sample, 2890 deals were issued by less reputable underwriters (i.e. a weighted syndication underwriting reputation share below the share of the 7 th largest underwriter
In the previous sections we have shown how astronomical alignments and solar hierophanies – with a common interest in the solstices − were substantiated in the
Both activities of this enzyme (proton transport across the membrane and electron transport from NADH to a quinone) can be measured electrochemically in the
Therefore, we observe that with trade liberalization border regions result favored as a result of their improved accessibility in the world transport and trade networks, which
To limit the impact of transport on animal welfare, in an effort to reduce the exposure to hazards and related welfare consequences, it is recommended to consider that:
