Álvaro Serna
Department of Systems Engineering and Automatic Control, University of Valladolid, Valladolid, Spain. [email protected]
Fernando Tadeo
Department of Systems Engineering and Automatic Control, University of Valladolid, Valladolid, Spain. [email protected]
Julio Elías Normey-Rico
Automation and Systems Department, Federal University of Santa Catarina, Florianópolis, Brazil. [email protected]
Summary
The article deals with the design of a Model Predictive Control strategy in an offshore platform located in the Atlantic Ocean that produces hydrogen from the energy of the wind and the waves. This renewable energy is the energy source that feeds a set of electrolyzers which produce hydrogen, taking into account the energy available and optimizing the operation of the plant. The results of the simulation are presented, showing the correct operation of the platform under the proposed control.
Keywords: Hydrogen; renewable energy; model predictive control.
1
INTRODUCTION
This paper evaluates the design of an Energy Management System for Hydrogen production (EMSH) using advanced algorithms based on Model
Predictive Control (MPC) ideas to balance the consumption of power by electrolysis units in an offshore platform, with the aim of maximizing hydrogen production.
This approach is more advanced than previous EMSH
defined for the H2OCEAN plant [1 ,2] as it takes into account a cost function which optimizes the operation of the electrolysis plant. We focus here only in the hydrogen production numerically but taking into account the reduction of the number of connection/disconnections (in order to improve the state of health of the electrolyzers). Moreover, the proposed approach makes possible for system operator to know in advance the expected production and, therefore, schedule preventive-predictive maintenance operations on the electrolyzer units. For simplicity, in this paper renewable hydrogen in locally generated by wind turbines and wave energy
converters and it is fully used (no storage or external sources are considered), but the results can be easily extended to the most common situation of using only the excess of energy from renewable sources [3]. The EMSH developed in this paper follows a smart
grid approach for the local micro grid [4]. In comparison with previous works [2], this proposal focuses on using an advanced control system to optimize hydrogen production and improves the operation of the appliances.
The energy generated at the platform by wind and waves is balanced by regulating the operating point of each electrolysis unit and its connections or disconnections, using a MPC. The term MPC does not designate a specific control strategy, but a very ample range of control methods which make an explicit use of a model of the process to obtain the control signal by minimizing an objective function [5].
The MPC presented in this paper is based on a Mixed-Integer-Quadratic-Programming (MIQP) algorithm which makes it possible to take into account predictions of available power and power consumption, improving the balance and reducing the number of connections and disconnections of the devices. Furthermore, a non-linear model with binary and continuous variables is developed in this paper, which is then transformed in such a way that an MIQP can be used to solve the MPC optimization at each step.
be used in the MCP. Section 3 deals with the control proposal and the optimization problem, whereas Section 4 shows a case study proposed in a certain location showing the adequate operations of the proposed EMSH. Finally Section 5 gives some
conclusions.
2
MATERIAL AND METHOD
This work falls within the innovative idea that consists of hydrogen offshore production by a combination of renewable energies. This paper focuses on the design of an advanced control algorithm of the H2OCEAN platform based on MPC ideas.
2.1 PROCESS DESCRIPTION
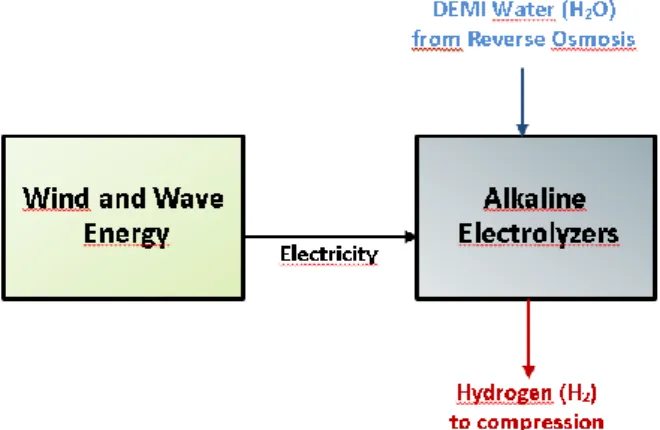
Fig. 1 depicts the components of the proposed renewable hydrogen platform: two renewable energy sources (wave and wind) supply electricity to the process. This electricity is generated in a WEC (Wave Energy Converter) coupled to a VAWT (Vertical Axes Wind Turbine) from a hybrid device, and is the used in the electrolyzers as scheduled by the EMSH that will be described in Section 3. An
electrolyzer is a piece of electrochemical apparatus (something that uses electricity and chemistry at the same time) designed to perform electrolysis: splitting a solution into the atoms from which it is made by passing electricity through it [7]. The proposed EMSH is aimed at adapting the production of
hydrogen to the available energy using degrees of freedom of the advanced control system, so the hydrogen produced is maximized without degrading the electrolyzers.
Figure 1: Block structure of the renewable hydrogen platform.
2.2 MANIPULATED AND CONTROLLED
VARIABLES
The manipulated variables of the proposed EMSH are
the operating points for each electrolyzer, known as capacity factors. They are mathematically denoted by αi(k), where k represents the discrete time in samples
(a sample time of 1 hour is used) and the suffix i is used to identify each device. Moreover:
- αi(k) = 0 if the electrolyzer i is disconnected
at time k.
- αi(k) is between [αi α̅i] if the electrolyzer is
connected, where αi and α̅i are minimum
and maximum values (between 0 and 1) fixed by the manufacturer due to technological limitations.
In addition, binary variables δi(k) ∈ {0,1} are used
where 0 corresponds to electrolyzer disconnection and 1 to electrolyzer connection [8].
The model of the electrolyzers is represented by the following equations with parameters a and b that are obtained from manufacturer’s data and measurements from the plant:
Ĥi(k) = α̂i(k)∙δ̂i(k)
ai∙α̂i(k)+bi ∙ P
̅i (1)
P
̂i(k) = P̅i∙ α̂i(k) ∙ δ̂i(k) (2)
Equations (1) and (2) show the controlled variables of electrolyzer i: P̂i(k) and Ĥi(k). On the one hand,
Ĥi(k) is the predicted hydrogen production of
electrolyzer i at time k. On the other hand, P̂i(k) is the predicted energy consumption of device i whereas P̅i is its maximum power at the sample time. Parameters ai, bi and P̅i are used to define the device
operation which gives the relationship between consumed energy and hydrogen production.
Fig. 2 depicts the controlled and manipulated variables for the electrolysis unit.
Figure 2: Scheme of the controlled and manipulated variables.
Note that the model of the electrolyzers used here is static because the time required for them to vary α from the minimum to the maximum value is less than a few minutes in the worst case, thus, these dynamics can be neglected as the sampling time for the EMSH
proposed here is one hour [9].
Fig. 3 shows the ratio Hi/Pi in the production of
Figure 3: Ratio H2 produced/Power consumed at
different α (a1 = 0.875kW/Nm3, b1 = 0.875kW/Nm3,
a2 = 0.778kW/Nm3, b2 = 3.625kW/Nm3
2.3 MODEL PREDICTIVE CONTROL FOR
HYDROGEN PRODUCTION
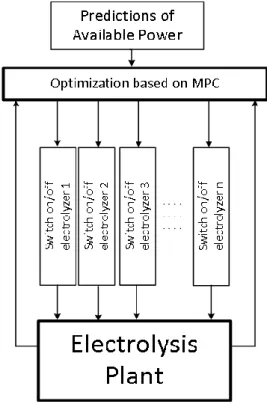
Comparing with other methods of process control, MPC can be used to solve the most common problems in today’s industrial processes, which need to be operated under tight performance specification where many constraints need to be satisfied. The principal elements in MPC are the objective function to be minimized, the model used to compute the predictions of the controlled variables, the definition of the process constraints and the method applied to solve the optimization problem [10]. Fig. 4 shows the EMSH based on MPC ideas, where the optimization
block receives information from the model block (electrolysis plant), which is responsible for computing the predictions of the plant output in a defined horizon N.
Figure 4: Proposed EMSH based on MPC ideas.
A model which was depicted in equations (1) and (2) is used to predict the future outputs based on past and current values and on the proposed optimal future control actions. These actions are calculated by the optimizer taking into account the cost function (where the future tracking error is considered) as well as the constraints [10]. The MPC algorithm developed in this paper follows the Dynamic Matrix Control (DMC) method. It takes only into account the Nu horizon control first terms. Therefore
assuming the process to be stable and without integrator. One of the characteristics of this method making it very popular in the industry is the addition of constraints. Optimization (numerical because of the presence of constraints) is carried out at each sampling instant and the value of u(t) is sent to the process. The inconveniences of this method are the size of process model required and also the inability to work with unstable processes [10].
3
CONTROL PROPOSAL
The control algorithm designed in this work aims to maximize the hydrogen produced by electrolysis considering different aspects, such as the limitation in the available power and the operational constraints. Three main objectives must be fulfilled:
O1: To maximize the hydrogen production, the difference between the values of the prediction and its desired values for each electrolyzer is minimized for all the devices along the prediction horizon (N).
O2: To maximize the operation of the devices, the discrete variables defining the connection or disconnection condition should be, whenever possible, equal to one (connection condition) along N.
O3: Energy consumed by the devices should always be smaller than the energy supplied from the wind and waves (P̂available(k)) but tries to be equal.
3.1 COST FUNCTION
Equation (3) shows the quadratic cost function considered in this work. It is solved in each sample time to maximize production, without excess connections/disconnections:
𝐽 = ∑ ∑[(𝐻̂𝑖(𝑘 + 𝑗) − 𝐻̅𝑖(𝑘 + 𝑗))2𝑄 𝐻𝑖 𝑁
𝑗=1 𝑛
𝑖=1
+ ∑𝑛𝑖=1∑𝑁𝑗=1𝑢(𝛿̂𝑖(𝑘 + 𝑗) − 1)2𝑄𝛿𝑖] (3)
This equation considers, in a prediction and control horizons of N and Nu samples respectively, the error between the predictions of hydrogen produced (Ĥi)
number of connections and disconnections. Besides,
QHi and Qδi are the weighting factors for the error
and the control action, δi, respectively. The first term
of (3) is used for O1, while the second term of this equation aims to achieve O2.
To solve this problem, the predictions of the hydrogen production are expressed as a function of the future control actions α̂i and δ̂i, and the past values of these inputs and the outputs Hi and Pi.
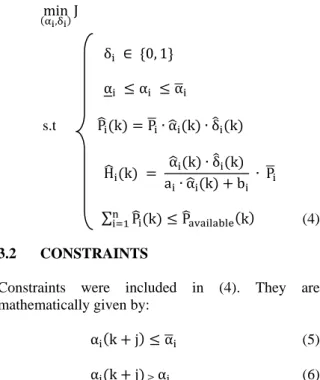
These predictions are obtained using the electrolyzer models (1) and (2). Thus, using (3) with all the system constraints and the electrolyzer models, It can be shown that the optimization problem to be solved at each sample time is (4), where the last constraint aims to solve O3.
min
(αi,δi)
J
δi ∈ {0, 1}
αi ≤ αi ≤ α̅i
s.t P̂i(k) = P̅i∙ α̂i(k) ∙ δ̂i(k)
Ĥi(k) =
α
̂i(k) ∙ δ̂i(k)
ai∙ α̂i(k) + bi ∙ P̅i
∑ni=1P̂i(k) ≤ P̂available(k) (4)
3.2 CONSTRAINTS
Constraints were included in (4). They are mathematically given by:
αi(k + j) ≤ α̅i (5)
αi(k + j) ≥ αi (6)
The following constraint (7) must be considered to fulfil O3: at each sample (k), the total energy consumed should always be smaller than the predicted available from the wind and waves
P
̂available(k). Considering MPC ideas, the vector of
predictions of available power, P̂available(k), is calculated over Nu using real meteorological data.
Hence, the constraint in the consumed energy is:
∑n P̅i∙ α̂i(k + j) ≤ P̂available(k + j)
i=1
j = 1, 2,..., Nu (7)
3.3 MPC STRATEGY
As it has been seen in Section 2.3, the MPC based on DMC ideas used in this advanced control algorithm includes a cost function (see Equation (4)) which considers, in a horizon of N samples, the error between the produced hydrogen Ĥi and its desired
values (H̅i) and also the number of electrolyzers in
operation (δ̂i). J is solved at each sample time using
receding horizon estimation.
With this, the optimization problem solved each sample time aims to optimize hydrogen production (Ĥi) and minimizes the consumption P̂i.
For the H2OCEAN platform [1], the predictions are wave height, wave period and wind speed, but other different sources can be used of different proposal. Then, the future predictions of the output (hydrogen production, vector Ĥi) are expressed as a function of
the future control actions (vectors Ĥi and Ĥi) and the past values of the inputs and outputs. In the case of the electrolyzers modelled here, only a static model is considered. Thus a structure of the EMSH control
algorithm proposed in this paper is depicted in Fig. 5.
Figure 5: Structure of the EMSH control algorithm
4
CASE STUDY
Figure 5: A co-located VAWT-WEC device [1] To produce hydrogen, different NEL A485 electrolyzers were chosen. The main gas storage containers are located on two floating units, well separated from both the hydrogen production and each other. The alkaline electrolyzers operate slightly above ambient pressure and are further equipped with pressure relief equipment, to prevent overpressure operation.
4.1 RESULTS AND DISCUSSION
A simulation was carried out using one hybrid device of 5.0 + 1.6 MW for the energy production. Meteorological data from a certain location in the Atlantic Ocean were used provided by Agencia Estatal de Meteorología (AEMET). Fig. 6 shows wave period predictions whereas Fig. 7 shows wave height predictions.
Figure 6: Meteorological wave period predictions.
Figure 7: Meteorological wave height predictions.
Figure 8: Meteorological wind speed predictions. Three NEL electrolyzers (two high production of 2.134 MW rated and one small production of 0.220 MW rated) were chosen for this case study.
A control horizon of 3 hours, a prediction horizon of 3 hours and a sampling time of 1 hour were selected to validate de EMSH. Thus, n = 3, Nu = 3 and N = 3.
To optimize, and MIQP solver in the MATLAB® TOMLAB® was used. This optimization solver has been used for predictive control in different works [13, 14]. The available energy at each time k is different from the one predicted in the previous step. For this case study, some results for 140 hours of operation are shown in Figs. 9 to 13. These results confirm the correct operation of the advanced control system designed in this paper.
Fig. 9 shows the power provided by the renewable energy sources (black line) and the power consumed (red line) by the electrolyzers. As it can be seen in the simulation, the controller maintains the consumed power very near the available one. As a consequence of this, the hydrogen produced is near the achievable maximum.
This happens because an ideal operation was supposed. It must be pointed out that perfect knowledge of the electrolyzers parameters are assumed and correspond to the manufacturer’s data. In practice there are some tolerances and variations in parameters.
Figure 9: Power available and consumed.
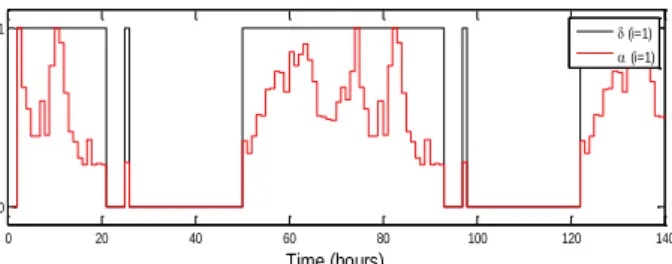
Fig. 10 shows the operation of the electrolyzer i = 1 (high production). As expected, this device is not connected/disconnected very often by the proposed EMSH and α1 is always between the requested bounds
α ̅1 and α1
0 20 40 60 80 100 120 140
6 8 10 12 14
Time (hours)
W
av
e
pe
riod
(s
)
0 20 40 60 80 100 120 140
1.5 2 2.5 3 3.5
Time (hours)
W
ind
s
pe
ed
(m
/s
)
0 20 40 60 80 100 120 140
0 2 4 6 8 10
Time (hours)
W
ind
s
pe
ed
(m
/s
)
0 20 40 60 80 100 120 140
0 1000 2000 3000 4000
Time (hours)
P
o
w
e
r
(k
W)
Figure 10: Operation of electrolyzer i = 1 .
Fig. 11 shows the operation of the second high production electrolyzer (i = 2). This operation is different from the electrolyzer i = 1 because they have different weighting factors. Thus, here the capacity factor α1 is almost always at the lower
bound α2. As it is not disconnected frequently, it can
be considered that the control algorithm is well designed and tuned.
Figure 11: Operation of electrolyzer i = 2.
Electrolyzer i = 3 (Fig. 12) is more connected because its operation is bigger than the operation of the high production electrolyzers, therefore the operation of this device can also be considered correct. As in the other electrolyzers, the values of the manipulated variables are always between the defined bounds.
Figure 12: Operation of electrolyzer i = 3.
5
CONCLUSIONS
The main conclusions of this paper are the following: - The Mixed-Integer-Quadratic-Programming for the MPC allows the capacity factor of each electrolysis unit and its connections or disconnections to be regulated.
- In the two case studies, the error between the predicted and the desired powers consumed by each electrolyzer is minimized for all devices along the prediction horizon N.
- The operation of the electrolysis set is maximized, since the discrete variables defining the connection/disconnection condition of the electrolysis is actioned along the prediction horizon, as much as possible.
- The MPC control strategy ensures the hydrogen production continuity, since the energy consumed by the electrolysis is almost equal to the energy supplied from the wind and waves during the prediction horizon.
- The electrolyzer’s state of health is ensured, thanks to the minimization of the switching between the connection/disconnection states.
Acknowledgements
This work was funded by Ministerio de Ciencia e Innovación (Spain) under grant DPI2014-54530-R and the European Comission (7th Framework Programme, grant agreement 288145, Ocean of Tomorrow Joint Call 2011). The author thanks the financial support given by Junta de Castilla y León (EDU/1083/2013). Also thanks to AEMET for providing meteorological data.
Prof. Normey-Rico thanks CNPq-Brazil for the financial support under projects 305785/2015-0 and 401126/2014-5.
References
[1] H2ocean-project.eu, (2014). H2Ocean. [online] Disponible en: http://www.h2ocean-project.eu/ [Visitado 6 June. 2017].
[2] Serna, A., Tadeo, F., (2014) “Offshore hydrogen production from wave energy” International
Journal of Hydrogen Energy, 39 (3),
1549-1557.
[3] Valverde, L., Bordons, F., Rosa, F., (2016) “Integration of fuel cell technologies in renewable-energy-based microgrids optimizing operational cost and durability” IEEE
Transactions on Industrial Electronics, 63(1),
167-177.
[4] Serna, A., Yahyaoui. I., Normey-Rico, J. E., de Prada, C., Tadeo, F., (2017) “Offshore hydrogen production from wave energy”
International Journal of Hydrogen Energy, 42
(17), 12865-12876.
[5] Afram, A., Janabi-Sharifi, F., (2014) “Theory and applications of HVAC control systems – A review of model predictive control (MPC)”
Buiding and Environment, 72, 343-355.
[6] Aprea, J. L., (2014) “Quality specification and safety in hydrogen production,
0 20 40 60 80 100 120 140
0 1
Time (hours)
(i=1) (i=1)
0 20 40 60 80 100 120 140
0 1
Time (hours)
(i=2) (i=2)
0 20 40 60 80 100 120 140
0 1
Time (hours)
(i=3)
commercialization and utilization”
International Journal of Hydrogen Energy, 39
(16), 8604-8608.
[7] Kong, Y. T., (2016) “An Analysis of the Recognition on Definition and Mechanism of Electrolysis for University Students Major in Science Education” Journal of Applied
Chemistry, 12(3), 463-481.
[8] Mendes, P. R., Maestre, J. M., Bordons, C., Normey-Rico, J. E., (2017) “A practical approach for hybrid distributed MPC” Journal
of process Control, 55, 30-41.
[9] Serna A., Normey-Rico J.E., Tadeo F., (2015) “Model predictive control of hydrogen production by renewable energy”. The 6th International Renewable Energy Congress IREC 2015. Sousse Tunisia.
[10] Camacho, E. F., Bordons, C., (2013) “Model predictive control” Springer Science and
Business Media.
[11] Friebe, C. A., von Flotow, P., Täube, F. A., (2014) “Exploring technology diffusion in emerging markets-the role of public policy for wind energy” Energy Policy, 70, 217-226. [12] Vicinanza, D., Contestabile, P., Ferrante, V.,
(2013) “Wave energy potential in the north-west of Sardinia (Italy)” Renewable Energy, 50, 506-521.
[13] Nandola, N. N., Rivera, D. E., (2013) “An improved formulation of hybrid model predictive control with application to production-inventory systems” IEEE
Transactions on Control Systems Technology,
21(1), 121-135.
[14] Zhong, S., Zhang, Y., (2013) “How to select optimal gateway in multi-domain wireless networks: Alternative solutions without learning” IEEE Transactions on Wireless