Supercritical water hydrolysis combined with silver mesoporous
1
zeolite catalysts for the hydrolysis of cellulose into glucose
2
S. G. Aspromonte
a, A. Romero
b, A. V. Boix
a, E. Alonso
b,*3
a Instituto de Investigaciones en Catálisis y Petroquímica – INCAPE (FIQ, UNL-4
CONICET) - Santiago del Estero 2829, 3000, Santa Fe, Argentina. 5
b High Pressure Processes Group –Chemical Engineering and Environmental Technology 6
Dpt., Universidad de Valladolid, c/Prado de la Magdalena 5, 47011, Valladolid, Spain. 7
8
Corresponding author. Tel: +34 983 423 175
9
*E-mail address: ealonso@iq.uva.es
10
11
12
13
14
15
16
17
Graphical Abstract
1920 21 22
23
24
25
Highlights
261. Crystalline cellulose is hydrolyzed into glucose with a yield of 63.8% 27
2. The Ag(I) ions exchanged allowed the hydrolysis of cellulose 28
3. The incorporation of silver produces a redistribution of acid sites 29
4. Al(III) species which are octahedrically coordinated were detected 30
Abstract
32The hydrolysis of cellulose into glucose is a critical step for the conversion of lignocellulosic 33
biomass into fuels and chemical products. The combination of supercritical water hydrolysis 34
in ultrafast reactors, with the subsequent hydrolysis of the cello-oligosaccharides on silver-35
exchanged mesoporous mordenite zeolite, offers the possibility of a clear enhancement in the 36
conversion of cellulose and in glucose formation. Complete dissolution of cellulose is 37
achieved in the supercritical step and 81.8% of formed oligosaccharides are hydrolyzed in 38
the catalytic step, with a yield into glucose of 77.0 %. A fraction of Al is octahedrally 39
coordinated, indicating a distribution of acid sites after the silver exchange. A deactivation 40
of the catalyst between the first and third reaction cycle is observed, with a reduction in 41
hydrolyzed carbon from 81.8% up to 45.6%. However, the selectivity to glucose only varies 42
from 94.1 to 81.8%. Afterwards, the activity remains constant up to the fifth cycle. The 43
presence of Ag(0) particles, together with the formation of coke, are responsible for the 44
partial blockage of the pores of the support and loss of catalytic activity. 45
46
Keywords: hydrolysis of cellulose; mordenite; glucose; biomass; silver; mesoporous zeolite 47
1. Introduction
49In the last years, there is a general tendency towards a society supported by the bioeconomy 50
and in the use of renewable resources. 51
In this context, the hydrolysis of cellulose to glucose is an important process and remains a 52
challenge for the conversion of lignocellulosic biomass to fuels and chemicals. Supercritical 53
water (SCW) in ultrafast reactors with hydrolysis times of milliseconds has demonstrated to 54
possess good ability to partially depolymerize cellulose without further degradation of sugars 55
(Cantero 2013, 2015). Although under such conditions more than 99 % of the cellulose is 56
solubilized, the presence of oligomers remains high (> 60 % C) (Cantero 2015). A possible 57
approach to solve this problem is to complete the hydrolysis of cellulose into glucose by solid 58
acid catalysts, representing an alternative to the enzymatic hydrolysis (Chheda 2007) or to 59
the use of mineral acids (Chimentao 2014). Various solid acids including sulfonated carbons, 60
niobic acid, sulfonated resins, (Suganuma 2008, Yamaguchi 2009), acid resins, metal oxides, 61
H-form zeolites, heteropoly acids, functionalized silicas, supported metals, immobilized 62
ionic liquids, carbonaceous acids and magnetic acids (Hu 2015), (Inumaru 2007), MoO3-63
ZrO2, tungstate zirconium phosphate, zirconium phosphate, lanthanum phosphate niobium 64
and some other materials (Morales-de la Rosa 2018) have been studied to catalyze the 65
cellulose hydrolysis. Conceptually, solid acids having high specific surface areas, pore 66
size/volume and strong acid sites are prone to exhibit better performances in the reaction. 67
Among these solid acids, zeolites are one of the promising catalysts due to their crystalline 68
structure, uniform pore size, high surface area, flexible framework and tunable acidity. 69
Nevertheless, zeolites defining accessible pores of effective dimensions and allowing the 70
molecules. Furthermore, these porous networks impose diffusional limitations on the reacting 72
molecules, reducing the mass transport to and away from the reactive sites in the pore system 73
and opening time windows for unwanted secondary reactions and coke formation (Zapata 74
2012). Cho et. al (2014) reported that the glucose diffusion inside the 5.1-5.6 Å pores of the 75
ZSM5 was significantly hindered compared to β zeolite (5.6-6.7 Å) and carbohydrates can 76
only react with active sites located on the outer pore rims. As it can be observed, until now, 77
there are very few works that report catalysts based on transition metals for the hydrolysis of 78
cellulose into sugars and, up to our knowledge, there is not any work using mesoporous 79
zeolites. 80
Hence, the aim of the present work is to maximize the glucose yield from microcrystalline 81
cellulose using heterogeneous catalysts to complete the hydrolysis of oligomers derived from 82
supercritical water hydrolysis in ultrafast reactors. For this purpose, the behaviour of Ag-83
based catalysts exchanged in mesoporous Na-mordenite was studied. This performance is 84
compared to the commercial acid zeolite (HMOR, Si/Al=10) in an inert and reducing 85
atmosphere. 86
In addition, to achieve a global understanding of the observed catalytic behaviour several 87
physicochemical techniques were applied, such as adsorption/desorption isotherms of N2 and 88
measurements of X-ray photoelectron (XPS) and solid-state NMR spectroscopies, 89
programmed-temperature reduction (TPR) and programmed-desorption temperature of 90
ammonia (TPD-NH3). 91
92
2. Materials and Methods
93Commercial microporous zeolites were used, Na-mordenite (CBV 10A Zeolyst International, 95
Si/Al = 6.5) labeled MOR and NH4-mordenite (CBV 21A Zeolyst International, Si/Al = 10). 96
From the latter, the protonated form denoted H-MOR was obtained by calcination in air flow 97
at 550 °C for 8 hours.
98
99
2.1.1 Synthesis of mesoporous zeolite (m-MOR)
100
The m-MOR mesoporous support was synthesized using the CTMABr (bromide hexadecyl 101
trimethyl ammonium chloride) surfactant as directing agent and a commercial Na-mordenite 102
zeolite as a source of Si and Al. For that, 3 g of CTMABr were dissolved in water at room 103
temperature and with continuous stirring. Absolute ethanol was added as solvent and a 104
solution of NH4OH 29 wt. %. Subsequently, the mordenite was added and stirred for 18 h at 105
25 °C. The molar composition used for the synthesis is 0.024 NaMOR:0.3 CTMABr:11 106
NH3:144 H2O:58 EtOH. 107
The final solid was obtained by vacuum filtration, and several washes were performed to 108
achieve neutral pH. Then, the samples were dried in an oven for 12 h at 80 °C and calcined 109
in air at 1 °C ∙ min-1 to 550 °C. 110
111
2.1.2 Incorporation of silver (Ag/m-MOR)
112
Silver was incorporated by a conventional ion exchange between the calcined m-MOR 113
support and a solution of AgNO3 (0.07 M) at room temperature for 24 hours under continuous 114
stirring. Ion exchange is performed in the absence of light to avoid reduction of the species 115
to Ag(0). Then, the samples were filtered, washed with deionized water, dried and calcined 116
119
2.2 Catalyst characterization 120
The catalysts were characterized by nitrogen adsorption/desorption, small angle X-ray 121
scattering (SAXS), X-ray diffraction (XRD), temperature-programmed reduction (TPR) or 122
desorption of ammonia (TPD-NH3), X-ray photoelectron (XPS) and solid-state NMR 123
spectroscopies. 124
Specific surface area, pore size distribution and total volume were determined from N2 125
adsorption/desorption isotherms obtained at -196 °C using a Quantachrome Autosorb 126
instrument. Previously, the samples were outgassed at 350 °C for 6 h (10-4 torr). The specific 127
surface area was calculated using the standard BET method (Brunauer 1938) for N2 128
adsorption data in the relative pressure adsorption range from 0.05 to 0.1. The BJH method 129
was used for the distribution of pore size. 130
The X-ray diffractograms were analyzed using a Shimadzu XD-D1 instrument equipped with 131
an X-ray tube with monochromatic CuKα radiation and Ni filter. The measurement was 132
conducted between 5 and 85° values of 2θ, with a speed of 1 °ꞏmin-1, 30 kV and 40 mA. The 133
crystallinity was estimated from the ratio of the sum of the intensity of the prominent peaks 134
corresponding to planes (1 1 1), (3 3 0), (1 5 0), (2 0 2) and (3 5 0) of catalysts. The maximum 135
degree of crystallinity was taken equal to 100 % and corresponded to calcined MOR 136
(Mignoni 2008). 137
SAXS patterns were collected at room temperature on a Philips X’Pert diffractometer 5000. 138
The samples were irradiated with a beam of CuKα (λ = 1.5405622 Å) without 139
monochromator. The measurement conditions were 40 kV and 20 mA with values of 2θ 140
The XPS measurements were carried out using a multitechnique system (SPECS) equipped 142
with a dual Mg/Al X-ray source and a hemispherical PHOIBOS 150 analyzer operating in 143
the fixed analyzer transmission (FAT) mode. The spectra were obtained with a pass energy 144
of 30 eV using Mg Kα X-ray source (hν = 1253.6 eV) operated at 200 W and 12 kV. The 145
working pressure in the analyzing chamber was less than 5 x 10⁻¹⁰ kPa. The binding energy 146
(BE) positions of Ag 3d do not identify the oxidation state of the silver species, because the 147
characteristic states of oxidized (Ag2O) and metallic silver (Ag (0)) are close together (within 148
0.5 eV) (Aspromonte 2012, 2013). Thus, the modified Auger parameter (α′) was used to 149
characterize the chemical state of silver. This parameter is the sum of the kinetic energy (KE) 150
of the Auger electron (Ag M4NN) and the BE of the core-level (Ag 3d5/2) peak. The BE of 151
core-levels Si 2p, Al 2p, Ag 3d, C 1s, O 1s and the KE in the region of the Ag M4NN auger 152
transitions were measured. During the processing of XPS spectra, BE values were referenced 153
to the C 1s peak (284.6 eV) from the adventitious contamination layer. Solid-state NMR 154
spectroscopy was performed in a Bruker equipment, model Avance II 400 and 300 MHz, 155
probe = 7 mm, spinning rate = 4 kHz, pulse angles = p/6 with recycle delay of 60 s and p/4 156
with recycle delay of 2 s for the experiment of 29Si and 27Al, respectively. 157
The temperature-programmed desorption of ammonia (TPD-NH3) was performed with 100 158
mg of catalyst, which was pretreated in-situ with He flow (30 mlꞏmin-1) at 350 °C during 1 159
hour. After cooling down to 100 °C, the sample was saturated with 50 cm3∙min-1 ammonia 160
flow during 30 minutes. Then, He was flowed and the temperature was increased up to 150 161
°C, maintaining this temperature until no physically adsorbed ammonia was detected. The 162
TPD experiment was carried out heating at 15 °Cꞏmin-1 in He flow from 150 to 750 °C and 163
CELLULOSE
Depolimerization SCW, 400°C 25 MPa, 0.03s
OLIGOMERS/GLUCOSE
GLUCOSE Hydrolysis catalyst
H2O, 180°C 5 MPa, N2 or H2
The temperature-programmed reduction (TPR) experiments were run with 100 mg of catalyst 165
at a heating rate of 10 °Cꞏmin-1 and a H2/Ar (5%) flow rate of 50 cm3ꞏmin-1. The used 166
equipment was a Micromeritics with AutoChem II chemisorption analyzer. 167
168
2.3 Catalytic Performance 169
The catalysts were evaluated in the hydrolysis of cellulose oligomers derived from the 170
hydrolysis of microcrystalline cellulose (Avicel® PH-101, Sigma-Aldrich) in ultrafast 171
supercritical reactors at 400 °C, 25 MPa and 0.03 s. Details of the experimental facility are 172
included in previous works (Cantero 2013). Under such conditions 99.9 % of the cellulose is 173
solubilized in water (Cantero 2013) but more than 66% of solubilized carbon is still forming 174
cello-oligosaccharides. The purpose of the subsequent catalytic step was to complete the 175
oligosaccharide hydrolysis maximizing the glucose production in the final product. The 176
outline of the procedure is summarized in Figure 1. 177
178
179
180
181
182
183
184
185
186
Figure 1. Scheme of the global hydrolytic process.
Catalytic tests were performed in a commercial AISI 304 stainless steel batch reactor with 189
an internal volume of 25 ml (Berghof® BR-25). First, the catalyst was placed inside the 190
reactor and after closing it was vented three times with nitrogen. Then, the reactor was 191
pressurized with N2 or H2 up to 50 bar and heated up to the operating temperature (180 °C). 192
Then, a volume of 20 ml of the solution obtained in the supercritical reactor was pumped at 193
50 °C (PU-2080 Plus, Jasco). In all the experiments, the amount of catalyst was 0.06 g of 194
metal/g C in the feed solution. The operating time was 90 min under continuous stirring at 195
1400 rpm. 196
When the final reaction time was achieved, the reactor and its content were quenched using 197
an ice bath to rapidly stop the reaction. After that, the product mixture was centrifuged and 198
the supernatant solution was then filtered prior to analysis by High Performance Liquid 199
Chromatography (HPLC). Sugars and their derivatives were determined by HPLC using a 200
Shodex SH-1011 column at 50 °C and H2SO4 (0.01 N, 0.8 mlꞏmin-1) as the mobile phase and 201
a Waters RI detector 2414, Total organic carbon (TOC) was determined using a Shimadzu 202
TOC-VCSH analyzer. 203
The selectivity to D-glucose in terms of carbon was calculated for the catalytic step using 204
equation (1): 205
𝑆 % ∙ 100 Eq. (1)
206
207
where ‘C(D-glucose)out’ are the moles of carbon after the reaction corresponding to the D -208
glucose, ‘C(D-glucose)in’ are the moles of carbon corresponding to the D-glucose in the
209
hydrolysate obtained in the SCW step and ‘C hydrolyzed’ are the moles of carbon hydrolyzed 210
𝐶 ℎ𝑦𝑑𝑟𝑜𝑙𝑦𝑧𝑒𝑑 𝐶 𝐶 Eq. (2) 212
213
where, ‘Coligomers,in’ and ‘Coligomers,out’ are the moles of carbon corresponding to the oligomers 214
present before and after the catalytic reaction, respectively. ‘Coligomers’ is determined through 215
a carbon balance by difference between the TOC of the sample and the carbon detected by 216
HPLC in cellobiose, glucose, fructose, glyceraldehyde and glycoaldehyde. For this, it is 217
assumed that the carbon remnant corresponds in its entirety to the presence of 218
oligosaccharides, because the concentration of pyruvaldehyde was always below 3% and 219
neither 5-HMF nor other degradation products were detected. 220
D-glucose yield (%) was obtained dividing moles of carbon formed in D-glucose by moles of
221
carbon in oligomers that enter the catalytic step (Eq. (3)): 222
𝑌 % ∙ 100 Eq. (3)
223
224
and the percentage of hydrolyzed carbon in the catalytic step was determined by equation 225
(4): 226
𝐶ℎ % ⋅ 100 Eq. (4)
227
228
The selectivity to 5- (hydroxymethyl) furfural (5-HMF) was determined with equation (5): 229
𝑆 % ∙ 100 Eq. (5)
230
231
where, ‘C (5-HMF)’ are the moles of carbon related to 5-HMF compound. 232
2.4 Recycling study
234The most promising Ag/m-MOR catalyst was exposed to a recycling test to study its catalytic 235
stability. The recycling study was carried out in a similar way to the catalytic performance. 236
First, the catalyst was separated from the products by filtration between the runs, dried at 237
60ºC and re-used. Five consecutive cycles were performed. The reaction products were 238
identified and quantified by HPLC. 239
The nature of the Ag species formed after each reaction cycle was studied by XRD. The 240
amount of deposited carbon during the hydrolysis reaction was determined by temperature-241
programmed oxidation (TPO) after each reaction cycle. The TPO experiments were carried 242
out using a Micromeritics Autochem TM II 2920 instrument, under a gas flow of 5 % O2 in 243
He, and a temperature ramp of 10 ºC min-1. Before the TPO experiments, catalysts were 244
dehydrated in situ at 300 ºC in He flow. 245
246
3. Results and Discussion
2473.1 Physicochemical characterization 248
3.1.1 Porous structure of the catalysts
249
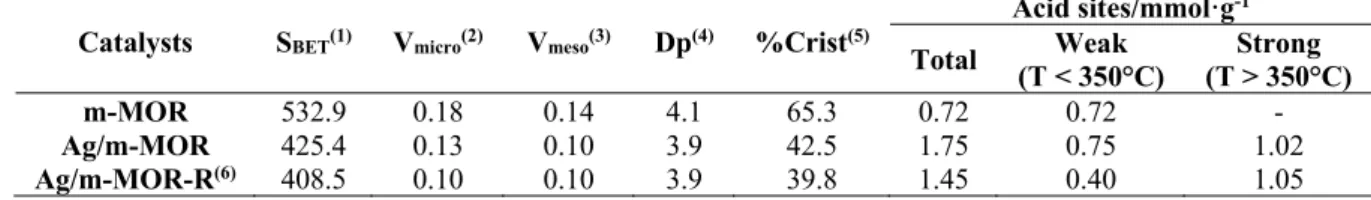
Table 1 shows the quantitative values derived from the characterization of textural properties 250
of the catalysts, i.e. BET surface area, pore volume and pore diameter, crystallinity degree 251
and acid sites by TPD-NH3. 252
Table 1. Textural and acid properties of catalysts
253
Catalysts SBET(1) Vmicro(2) Vmeso(3) Dp(4) %Crist(5)
Acid sites/mmolꞏg-1
Total (T < 350°C)Weak (T > 350°C)Strong
m-MOR 532.9 0.18 0.14 4.1 65.3 0.72 0.72
-Ag/m-MOR 425.4 0.13 0.10 3.9 42.5 1.75 0.75 1.02
(1) Surface area BET, m2ꞏg-1; (2) Micropore volume calculated by t-plot method, cm3ꞏg-1; (3) Mesoporous volume calculated
254
by BJH method, cm3ꞏg-1; (4) Pore diameter, nm; (5) Crystallinity calculated using the ratio of the sum of the intensity of the
255
five most intense peaks, (6) Ag/m-MOR-R catalyst reduced in H2 flow at 500 °C.
256 257
The mesoporous mordenite (m-MOR) presents a type IV isotherm (not shown) according to 258
the IUPAC nomenclature (Aspromonte 2017), which is characteristic of mesoporous 259
materials. The surface area was 532.9 m2ꞏg-1 and the micropore and mesopore volume were 260
0.18 and 0.14 cm3ꞏg-1, respectively (Table 1). In addition, the Ag/m-MOR and Ag/m-MOR-261
R showed a type IV isotherms and the specific area and pore volume slightly decreased 262
compared to the values reported for m-MOR, due to the addition of a bulky cation such as 263
Ag. The incorporation of silver did not significantly modify the pore diameter, which would 264
allow the voluminous oligomer molecules to reach the active centers. 265
In addition, the percentage of crystallinity obtained from the X-ray diffractograms (XRD) is 266
included in Table 1. A decrease in the intensity of the major peaks was observed, indicating 267
a loss of crystallinity in mesoporous zeolite materials from 65.3 % for m-MOR to 39.8 % for 268
Ag/m-MOR-R. Moreover, the diffractogram did not show the signals corresponding to silver 269
oxides or metallic species. 270
On the other hand, it is important to notice that the diffractograms obtained by SAXS do not 271
show diffraction peaks in the 2θ region between 1 and 10°, which implies that the synthesized 272
material has mesoporosity and high specific surface area, but there is no evidence of 273
mesoporous ordering. 274
275
3.1.2 Reducibility of silver species
The properties of the active sites are related to the different species of silver present in the 277
catalyst. Temperature-programmed reduction (TPR) helps to discerning these species. Figure 278
2 shows the results obtained by TPR for calcined Ag/m-MOR catalyst. 279
The reduction profile exhibits peaks in three temperature regions which can be attributed to 280
different silver species. At low temperature, below 300 °C (region I), the reduction peaks 281
could correspond to small highly dispersed particles which may be associated with AgxOy 282
species (Westermann 2012). Different peaks present in this region suggest a diverse 283
interaction between the oxide particles and the channels of the support (Aspromonte 2012). 284
The reduction at temperatures between 300 and 600 °C (region II) is generally attributed to 285
Ag(I) ions at exchanged positions. Besides, there is a small fraction above 600 °C (region 286
III) that could be assigned to Ag(I) ions located at very stable sites with high coordination, 287
in which the cation strongly interacts with the support structure. The calculated H2 288
consumption/Ag molar ratio is close to 0.5, indicating the complete reduction of Ag(I) 289
species to their metallic state. 290
291
292
293
294
295
296
297
298
299 0 200 400 600 800
Ag(I) high coord Ag(I)
H 2
co
ns
um
pt
ed
/ a
.u
.
Temperature / °C
340 345 350 355 360
Ag M5N45N45
Kinetic Energy/eV
B Ag M5NN
381 378 375 372 369 366
3d5/2
Binding Energy/eV
A
3d3/2
Figure 2. Results of Ag/m-MOR catalyst obtained by Temperature-Programmed Reduction (TPR).
300
301
3.1.3 XPS Surface characterization
302
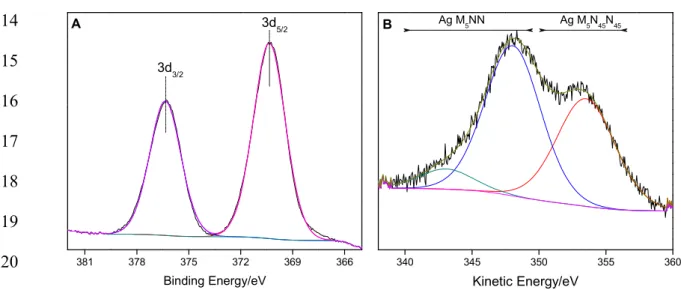
In order to investigate the chemical state of Ag(I) exchanged species and supported 303
nanoparticles (Ag(0) and Ag2O), the Ag 3d photoelectron spectrum of Ag/m-MOR catalyst 304
was measured (inlet figure in Fig. 3A). 305
In the literature, it is reported that the binding energy difference between Ag(0) and Ag(I) 306
corresponding to Ag2O is only 0.3 eV, making difficult to determine the oxidation state of 307
silver. As a consequence of this, the M4NN transition of the Auger region was measured 308
(Figure 3B). By means of the calculation of the modified Auger parameter (α’), remarkable 309
differences could be obtained. In this sense, Waterhouse et al. (2007), reported values of α’ 310
equal to 726.3 eV for Ag(0) and 724.5 eV for Ag2O species. In previous articles of the group, 311
a modified auger parameter values close to 722 eV were reported, corresponding to Ag (I) 312
ions located in exchange positions within the mordenite (Westermann 2012). 313
314
315
316
317
318
319
320
Figure 3. XPS spectrum of Ag/m-MOR catalysts, (A) Ag 3d and (B) Ag M4NN region.
321
The modified Auger parameter for the Ag/m-MOR catalyst was calculated and it was 722.6 323
eV, which indicates the presence of Ag(I) ions in interaction with the mesoporous zeolite 324
structure, in concordance with the TPR results. 325
On the other hand, the binding energy of the Al 2p region was studied to identify the oxidation 326
state of the aluminum. In general, the mordenite sample has a single peak at 74.1 eV with 327
fwhm = 1.9 eV, which is characteristic of the tetrahedral aluminum atoms of the zeolites, 328
such as AlO4 groups (Boix 2008). 329
After modifying the original zeolite with the generation of mesopores and the addition of 9.6 330
wt. % of silver, the binding energy of the main peak is shifted towards higher BE values. In 331
the open literature, there are numerous studies that report BE values close to 74.5 eV for 332
octahedral aluminum within the Al2O3 oxide (Amama 2010). The m-MOR and Ag/m-MOR 333
catalysts have BE values of 74.2 and 74.5 eV, respectively. In the same way, an increase of 334
the full width at half maximum (fwhm) to values of 2.3 and 2.5 is observed for the m-MOR 335
and Ag/m-MOR catalysts, respectively. This would indicate a modification in the chemical 336
environment of the aluminum species, probably due to the presence of surface octahedral 337
aluminum. 338
339
3.1.4 Solid state NMR determination of mesoporous zeolite topological structure
340
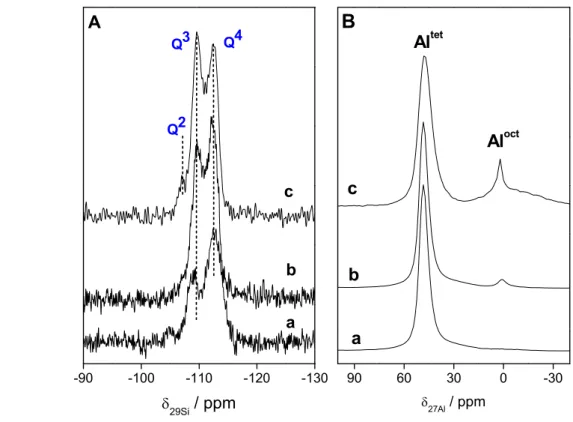
29Si (MAS) and 27Al (MAS) NMR measurements were performed to reach a full 341
understanding of the system after the modification of zeolite and incorporation of silver. The 342
basic structural units of zeolitic materials based on silicates and aluminosilicates are TO4 343
tetrahedral with silicon atoms at the central T-positions. In the second coordination sphere of 344
in aluminosilicates may be characterized by up to five different environments denoted as 347
Si(nAl) with n = 0, 1, 2, 3 and 4 (Stepanov 2016). Typically, the 29Si MAS NMR signal of 348
Si(0Al) species occur at ca. -110 ppm (referenced to tetramethylsilane) (Meynen 2009). 349
Figures 4A and 4B present the results of 29Si MAS NMR and 27Al MAS NMR spectroscopy, 350
respectively. The calcined MOR and m-MOR catalysts have the peaks corresponding to Q3 351
and Q4 very well defined. However, after the exchange of silver with the structure, the peak 352
assigned to Q2 is resolved with a contribution of 5 %. These results imply that the silicon 353
environment after silver exchange was slightly modified. 354
On the other hand, according to the Loewenstein’s rule, the formation of Al-O-Al bonds in 355
aluminosilicates is forbidden, and only Al(4Si) species can exist in the corresponding 356
frameworks (Abdelrasoul 2017). Therefore, 27Al MAS NMR spectra of hydrated 357
aluminosilicates consist, in general, of only one signal of tetrahedrally coordinated 358
framework aluminum (Altet) at chemical shifts of ca. 50-60 ppm (referenced to a 0.1 M 359
aqueous solution of Al(NO3)3 in D2O). Octahedrally coordinated aluminum species (Aloct) in 360
hydrated aluminosilicates, which can be due to extra-framework aluminum compounds, 361
induce 27Al MAS NMR signals at ca. 0 ppm. Figure 4B shows the 27Al MAS NMR results 362
of MOR (spectrum a), m-MOR (spectrum b) and Ag/m-MOR (spectrum c) catalysts. All the 363
samples present a narrow signal at 53 ppm due to tetrahedrally coordinated framework 364
aluminum. In the case of the modified mordenite catalysts with mesoporous and/or silver 365
species, the spectra show an additional peak at ca. 0 ppm due to octahedrally coordinated 366
aluminum species. Specifically, after incorporating the 9.6 wt. % Ag in the structure, a broad 367
background signal at ca. 0 ppm is observed, indicating the presence of Al2O3 or oxide 368
90 60 30 0 -30 c
Aloct
27Al / ppm
b
a
Altet
B
-90 -100 -110 -120 -130
c
b
29Si / ppm A
a
Q2
Q3 Q4
371
372
373
374
375
376
377
378
379
380
381
382
Figure 4. (A) 29Si and (B) 27Al MAS NMR spectra of (a) MOR, (b) m-MOR and (c) Ag/m-MOR catalysts.
383
384
In this context, Gardner et. al (2015) claimed that the presence of NaCl enhances the 385
hydrolysis of Si-O-Al bridges and the release of Al(III) species that catalyze the 386
isomerization of glucose to fructose. Ravenelle et. al (2015) studied the behaviour of Pt-387
Al2O3 in the hydrolysis of cellulose. They propose that the Al(III) cations [Al(OH)2+, AlO+] 388
interacts with OH- ions, shifting the dissociation equilibrium of water and increasing the 389
concentration of protons and, thus the hydrolysis activity. 390
It is known that all Al (III) species promote the acid-catalyzed hydrolysis of cellulose and 391
the isomerization of glucose to fructose through Lewis acid-catalyzed intramolecular hydride 392
shift (Saha 2014). 393
of silver. This could be linked to the Si-O-Al bonds involved in extra-structural species and/or 396
defective sites that suffers a hydrolytic attack, resulting in the leaching of the aluminum to 397
the synthesis medium. In addition, by means of XPS and 27Al MAS NMR spectroscopies, it 398
is shown that a fraction of Al is octahedrally coordinated, most likely as Al(III) ions. 399
The cellulose is formed by the binding of β-glucopyranose molecules via β-1,4-glucosidic 400
bonds. Cellulose chains are coupled together in bundles hydrogen bridges. Therefore, in the 401
first step, due to the low solubility, hydrolysis of cellulose in water can only proceed on the 402
outer surface of porous for oligosaccharides. In a second step, these soluble oligosaccharides 403
formed with linear structure, diffuse into pores (Song 2017). Subsequently, the 404
oligosaccharides can be hydrolyzed to monosaccharides by acid sites (Do Couto Fraga 2016). 405
406
3.1.5 Temperature-Programmed Desorption of ammonia
407
Following this line, it is necessary to study the acidity of the synthesized catalysts. 408
Temperature-Programmed Desorption of ammonia (TPD-NH3) is one of the conventional 409
methods for the characterization of total acidity. In general, the assessment of acidity involves 410
the determination of the strength, number of active centers and their nature. The temperature 411
of desorption can be understood as the relative acidic strength of the different centers. When 412
the strength of the acid centers is higher, the ammonia molecule is retained more strongly 413
and higher temperature is necessary to desorb it. The number of acid centers is defined as the 414
amount of ammonia desorbed per gram of catalyst (Benaliouche 2008). 415
Table 1 shows the quantitative results obtained from the desorption profiles of NH3, 416
employed to analyze the acidic strength of the m-MOR, calcined Ag/m-MOR and reduced 417
However, the calcined and reduced Ag/m-MOR catalysts presented desorption peaks above 420
350 °C, which indicates the existence of strong acid sites. 421
Table 1 shows that the total amount of acidic sites increased after incorporating 9.6 wt. % 422
Ag. The maximum temperatures of the desorption peaks are different for the catalysts, which 423
implies a variation in the distribution of the acid strength of the centers after the mesoporosity 424
generation and because of the silver incorporation. The obtained TPD profiles for the m-425
MOR and Ag/m-MOR samples (not shown), present peaks in two desorption regions: below 426
and above 350 °C. The low temperature peaks correspond to weak acid sites, whereas above 427
350 °C strong acid sites are detected. 428
The Ag/m-MOR catalyst shows an increase in the number of strong acid sites of 42 % respect 429
to the original m-MOR mesoporous zeolite. The reduced Ag/m-MOR-R catalyst presented a 430
decrease of the total acid sites respect the calcined sample. In this sense, it is important to 431
notice that in concordance with the NMR results, the chemical composition of the catalysts 432
was changed after the introduction of mesoporosity and silver species. 433
The mordenite is a zeolite that is characterized by Si (IV) ions forming tetrahedra with the 434
four vertices occupied by O(-II) ions, which are replaced by Al(III) ions. The resulting 435
negative charges are compensated by the presence of metal cations such as K (I) or Na (I), 436
which are introduced extra-framework giving rise to weak Lewis acid centers (Cejka 2010). 437
When the compensation cation is a proton, a Brönsted acid site is generated. The synthesis 438
process to increase the pore size and subsequent introduction of Ag, generated a decrease in 439
the crystallinity of the original zeolite and the presence of extra-reticular octahedral Al. Thus, 440
it is clear that the redox behavior in the mesoporous mordenite is altered by Ag(I) ions. 441
higher amount of Al(III) ions outside of the crystalline structure. In addition, it is possible 444
that the metal silver particles formed at lower temperatures, improve the dissociation of 445
hydrogen and the reduction of AgxOy species and generation of H+ sites in strong interaction 446
with the structure are promoted. This implies that the presence of Ag favors the formation of 447
strong acid sites. 448
449
3.2 Ultrafast hydrolysis of microcrystalline cellulose 450
A suspension of microcrystalline cellulose is hydrolyzed in a continuous ultrafast reactor 451
using supercritical water at 400 °C, 25 MPa and 0.03 s of residence time. Under such 452
conditions, more than 99.9 % of cellulose is solubilized and depolymerized into soluble 453
oligomers. Table 2 shows the main composition of the liquid product after SCW treatment 454
of cellulose. 455
Table 2. Composition of the hydrolysate obtained from cellulose by ultrafast supercritical water hydrolysis
456
(400 °C, 25 MPa, 0.03 s)
457
Cellobiose Glucose Fructose Glyceraldehyde Glycolaldehyde Oligo-
saccharides TOC
mgꞏL-1 3159 2697 1348 936 2327 - 10873
%C 12.2 10.0 5.0 3.4 8.6 57.8
-458
Total organic carbon in the product was 10873 mgꞏL-1, being 12.2 % in cellobiose, 10.0 % 459
in glucose, 5% in fructose, 3.4 % in glyceraldehyde and 8.6 % in glycolaldehyde. 460
Pyruvaldehyde concentration is < 3% and neither 5-HMF nor other degradation products 461
such as humins were detected. The oligosaccharides (including cellobiose) represent 70 % in 462
terms of organic carbon, thus, a subsequent hydrolysis step is required to complete their 463
hydrolysis into monomeric sugars. 464
465
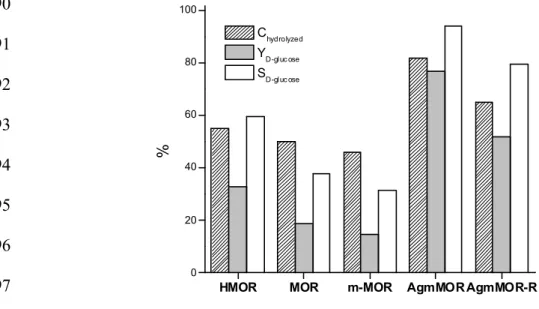
Table 3 and Figure 5 present the catalytic results of H-MOR, m-MOR and Ag/m-MOR, in 467
N2 or H2 atmosphere, in the hydrolysis of the solubilized and partially depolymerized 468
cellulose stream from the supercritical reactor. 469
The synthesized catalysts were compared with the commercial zeolite in the protonic form 470
(HMOR). Additionally, a blank (no catalyst) test was conducted in hydrogen atmosphere. It 471
was observed that cellobiose and oligosaccharides could be hydrolyzed into glucose at a 472
temperature of 180 C. The yield to glucose in the blank experiment was 8.9 %, which was 473
considered in the calculation of glucose yield obtained with the catalysts. 474
No influence of the atmosphere was observed for the HMOR and m-MOR support; the 475
catalytic behavior was similar under inert or reducing atmosphere. The HMOR catalyst 476
showed 55.1 % and 32.8 % of hydrolyzed carbon and D-glucose yield, respectively.
477
However, the sample m-MOR hydrolysed 46.2 % of the carbon present in the feed stream, 478
with a yield of 14.6 % to glucose. In addition, 5- hydroxymethyl furfural (5-HMF) was 479
detected in low concentrations (4.1 - 3.3 %) with both supports. 480
Table 3. Results of cellulose hydrolysis to D-glucose production
481
Catalysts Reaction cond (1) % C hydrolyzed Y
D-glucose(2)/% S5-HMF(3)/%
HMOR H2 55.1 32.8 4.1
m-MOR H2 46.2 14.6 3.3
Ag/m-MOR H2 81.8 77.0 4.3
N2 77.3 30.3 7.8
Ag/m-MOR-R(4) H2 65.1 51.9 10.5
N2 63.9 55.8 5.9
(1) Atmosphere of reaction, (2) Yield to D-glucose, %; (3) Yield to 5-HMF, %; (4) Ag/m-MOR-R catalyst reduced in H2
482
flow at 500 °C. 483
484
After the incorporation of 9.6 wt. % Ag to the m-MOR support, a different catalytic 485
behaviour was observed related to the substrate and the reaction atmosphere. On one hand, 486
HMOR MOR m-MOR AgmMOR AgmMOR-R
0 20 40 60 80 100
%
Chydrolyzed YD-gluc ose SD-gluc ose
hydrolysed in this catalytic step (Eq. (4)) with a selectivity of 94.1 % to glucose and only a 488
4.3 % of selectivity to 5-HMF. 489
490
491
492
493
494
495
496
497
498
Figure 5. Results of % C hydrolyzed, % D-glucose Yield and % Selectivity to glucose for commercial MOR
499
(Si/Al=6.5), m-MOR, Ag/m-MOR, Ag/m-MOR-R reduced at 500 ºC and H-MOR (Si/Al=10) catalysts for the
500
hydrolysis of cellulose. Reaction conditions: 90 min, 180 ºC, 50 bar H2 and 1200 rpm
501 502
The solubilisation of microcrystalline cellulose in the supercritical water reactor is higher 503
than 99.9 % and after this supercritical step 10.0% of carbon is in glucose form. After the 504
coupling with the subsequent catalytic step using Ag (9.6 wt. %)/m-MOR in a reducing 505
atmosphere, the global glucose yield (including both steps) leads to 63.8 % that is much 506
higher than those obtained in the literature with Ru/CMK-3 (Kobayashi 2010), HY zeolite 507
combined with ionic liquids (Zhang 2009) or a dissolution/precipitation approach in ionic 508
liquids using heterogeneous catalysts with sulfonic groups (Morales-de la Rosa 2018). 509
In contrast, when the reaction medium is N2, the amount of hydrolysed oligomers and glucose 510
yield decrease to 77.3 % and 30.3 %, respectively. However, an increase in the production 511
These results evidence that the reaction atmosphere has a pronounced influence on the 513
hydrolysis reaction. This catalytic performance is directly linked to the Ag species present in 514
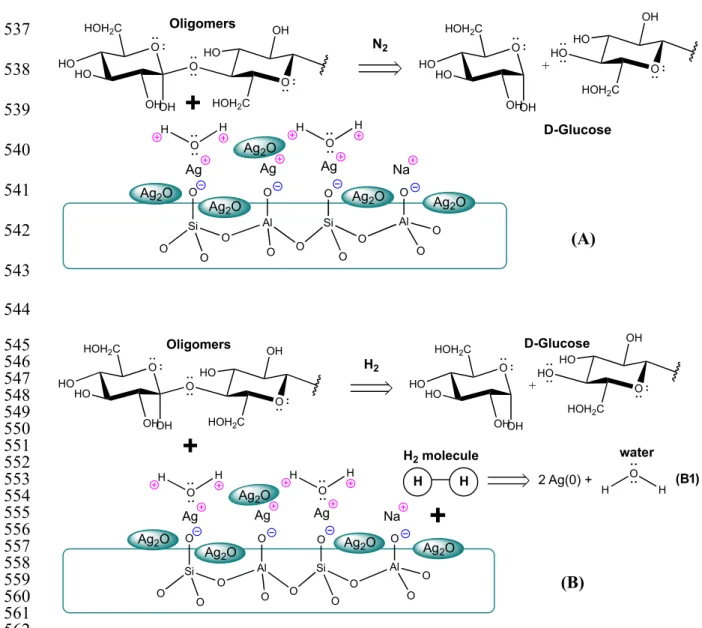
the synthesized catalyst. Figure 6 shows a scheme of the proposed hydrolysis mechanisms in 515
the two different reaction media, N2 (Fig. 6A) and H2 (Fig. 6B). 516
Based on the results obtained by TPR (Fig. 2) and XPS (Fig. 3), the calcined Ag/m-MOR 517
catalyst encloses Ag(I) ions located in exchange positions of the mesoporous zeolitic 518
structure and Ag2O nanoparticles. Since the exchange percentage is 76 %, the catalyst 519
contains a fraction of Na(I) ions not exchanged. When the hydrolysis reaction is carried out 520
in an inert atmosphere (N2, Fig. 6A), the water occupies the active sites of the catalyst, Ag(I) 521
and Na(I) ions. In previous work, we have studied the interaction between the water molecule 522
and both ions (Aspromonte 2012). The results obtained in this case showed a strong 523
interaction between the water molecule and the exchanged Ag(I) ions. In this way, the water 524
adsorbed on the structure allows the hydrolysis of the oligomers to produce glucose. 525
In the case where the reaction is carried out in reducing medium (H2, Fig. 6B), an additional 526
effect is produced. At 180 °C, the fraction (almost complete) of Ag2O nanoparticles 527
supported on the catalyst is reduced, to generate metal silver particles and water (Fig. 6-B1), 528
thus shifting the reaction towards glucose (Westermann 2012). 529
530
531
532
533
534
537 538 539 540 541 542 543 544 545 546 547 548 549 550 551 552 553 554 555 556 557 558 559 560 561 562 563
Figure 6. Scheme of the pathway proposed for the hydrolysis of oligomers to produce glucose over
silver-564
mesoporous zeolite catalysts, (A) in N2 atmosphere and (B) in H2 atmosphere.
565 566
Thus, in order to study this, the calcined Ag/m-MOR catalyst was previously reduced at 500 567
°C (called Ag/m-MOR-R) and it was evaluated in nitrogen or hydrogen atmosphere. In this 568
sense, it was observed that the amount of hydrolyzed carbon is the same in both reaction 569
atmospheres. However, in the presence of hydrogen it is observed that production of glucose 570
decreases to 51.9% and the selectivity to 5-HMF increases (10.5 %). In all cases it is observed 571 O Si O O O Al O O O Si O O O Al O O O
Ag Ag Ag Na
Ag2O
Ag2O
Ag2O
Ag2O
O
OH OH HO
HO HOH2C
HO
O HOH2C
OH HO H O H O OH OH HO HO HOH2C
O
O HOH2C
OH HO +
+
N2 Oligomers D-Glucose H O HAg2O
(A) (B) O Si O O O Al O O O Si O O O Al O O O
Ag Ag Ag Na
Ag2O
Ag2O
Ag2O
Ag2O
O
OH OH HO
HO HOH2C
HO
O
HOH2C OH HO H O H O OH OH HO HO HOH2C
O
O HOH2C
OH HO +
+
H2 Oligomers D-Glucose H O HAg2O
H H
+
H2 molecule
2 Ag(0) +
water
H O
compound 5-HMF. This result corroborates the mechanism proposed in Fig. 6, because by 573
reducing the catalyst at 500 ºC prior to the reaction, the supported Ag2O nanoparticles were 574
reduced as well as the majority fraction of Ag(I) ions exchanged in the structure. This implies 575
that the catalytic performance of the sample Ag/m-MOR-R decreases in comparison with the 576
calcined sample and it does not depend of the used reaction medium, because the reduction 577
of Ag2O does not occur. 578
Therefore, it is important to notice that using heterogeneous Ag catalysts exchanged in 579
mesoporous zeolitic structures, a glucose yield of 77 % was obtained with a selectivity of 580
94.1 % at 180 °C for 90 minutes. In the literature, a glucose yield of 50.5% and selectivity of 581
90% are reported with the homogeneous heteropoly acid H3PW12O40 at 180 ºC and 2 h (Tian 582
2010). Similarly, acidified mesoporous carbons of the CMK-3-SO3H type, operating for 24 583
hours at 150 °C, produce 74.5 % of glucose yields (Pang 2010). Zeolites such as H-beta and 584
HY hydrolyzing for 24 h at 150 °C or 2 h at 130 °C allow to obtain glucose yields of 12 and 585
50%, respectively (Cai 2012). Consequently, the yield and glucose selectivity values 586
obtained in the present work, with recoverable heterogeneous catalysts, greatly exceed what 587
is reported in the open literature. 588
589
3.4 Recycling test and carbon deposits 590
The catalytic stability of the solid Ag/m-MOR was evaluated in 5 consecutive hydrolysis 591
cycles. The activity of the catalyst after each cycle was expressed in terms of % C hydrolyzed 592
(Eq. 4), glucose yield (Eq. 3) and selectivity towards glucose (Eq. 1) and 5-HMF (Eq. 5). The 593
obtained results are shown in Figure 7. 594
1 2 3 4 5 0
20 40 60 80 100
% SD-glucose YD-glucose Chydrolyzed S5-HMF
to 37.3%. It is important to notice that, although the catalysts exhibit an expected decrease in 597
the amount of hydrolyzed carbon and in the glucose yield, the selectivity towards glucose 598
remains practically constant, with values varying between 91.7 and 81.8 %. After the third 599
reaction cycle, the values of the parameters that are linked to the catalytic activity remain 600
practically constant until the fifth reaction cycle. The yield to glucose is in the range 37.3-601
38.8 % and the amount of hydrolyzed carbon between 45.6-47.1 %. 602
There are not many works in the literature that report activities of catalysts in the hydrolysis 603
of cellulose after various reaction cycles. Suganuma et al. (Suganuma 2008), reported that 604
the activity of an amorphous carbon bearing SO3H, -COOH, -OH functions do not decrease 605
after 25 reuses (total reaction time, 150 h), however, the observed glucose yield was only 4 606
%. Fang et al. and Zhang et al. (2011) prepared hydrotalcite nanoparticles 607
(Mg4Al2(OH)12CO3) for the hydrolysis of cellulose and they show a maximum glucose yield 608
of 30.8 % at 150 ºC after 24 h that can be reused four times without much drop in the catalytic 609
activity. In any case, the works in open literature reported recycling tests corresponding to 610
maximum glucose yields much lower than that of the present work. 611
612
613
614
628
Figure 7. Results of (a) % Selectivity to glucose, (b) % C hydrolyzed, (c) % D-glucose Yield and (d) %
629
Selectivity to HMF for Ag/m-MOR catalyst after 5 cycles of oligomers hydrolysis. Reaction conditions for
630
each cycle: 90 min, 180 ºC, 50 bar H2 and 1200 rpm.
631 632
To understand this behaviour, it is important to note that the reasons for deactivation could 633
be classified in two groups, which directly modify active sites such as sintering or metal loss 634
and those responsible for blocking the catalyst such as coke formation. To study the 635
formation of coke during the successive cycles of catalytic reaction, temperature-636
programmed oxidation (TPO) measurements were carried out. The TPO profiles of the 637
deactivated catalyst show a peak with a maximum ranging between 390 and 420 ºC, 638
attributed to an amorphous coke that encapsulates the active sites. Table 4 presents the results 639
derived from TPO analysis after each reaction cycle. 640
641
Table 4. Diameter of silver metallic particles and carbon characterization deposited on Ag/m-MOR catalysts
642
after 5 reaction cycles. Reaction conditions: 180 ºC, 90 min, 0.06 g metal/g carbon.
643 644 645
646
647
648
649
650
a Diameter of silver metallic particle (nm) calculated by Scherrer equation: DAg(0) = kλ/(β cos θ), where λ is the X-ray source
651
wavelength (1.5406 Å), β is the angular width ~FWHM and θ is the half angle of diffraction. 652
653
The amount of coke increases twice after the third reaction cycle and remains practically 654
constant until the fifth reaction cycle. 655
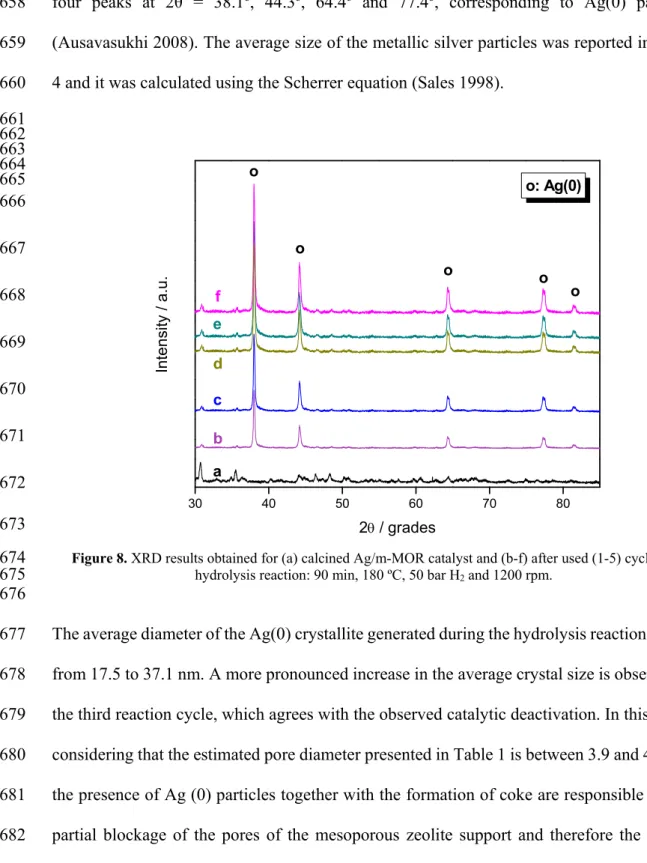
On the other hand, Figure 8 shows the XRD results in the range of 2θ = 30 - 85 grades after 656
Cycles wt. % carbon Tmax / ºC DAg(0)/nma
1st 0.07 400 17.5
2nd 0.10 420 23.6
3rd 0.15 390 32.3
4th 0.17 410 36.6
30 40 50 60 70 80
f
e
d
c
b
o: Ag(0)
o o o
o
In
tensit
y /
a.
u.
2 / grades
o
a
four peaks at 2θ = 38.1º, 44.3º, 64.4º and 77.4º, corresponding to Ag(0) particles 658
(Ausavasukhi 2008). The average size of the metallic silver particles was reported in Table 659
4 and it was calculated using the Scherrer equation (Sales 1998). 660
661 662 663 664 665 666
667
668
669
670
671
672
673
Figure 8. XRD results obtained for (a) calcined Ag/m-MOR catalyst and (b-f) after used (1-5) cycles in
674
hydrolysis reaction: 90 min, 180 ºC, 50 bar H2 and 1200 rpm.
675 676
The average diameter of the Ag(0) crystallite generated during the hydrolysis reaction ranges 677
from 17.5 to 37.1 nm. A more pronounced increase in the average crystal size is observed in 678
the third reaction cycle, which agrees with the observed catalytic deactivation. In this sense, 679
considering that the estimated pore diameter presented in Table 1 is between 3.9 and 4.1 nm, 680
the presence of Ag (0) particles together with the formation of coke are responsible for the 681
partial blockage of the pores of the mesoporous zeolite support and therefore the loss of 682
4. Conclusions
685The combination of supercritical water hydrolysis of cellulose in ultrafast reactors with the 686
subsequent hydrolysis of the cello-oligosaccharides on Ag/m-MOR catalyst has led to a 687
glucose yield of 77.0 % and a percentage of hydrolyzed carbon in the catalytic step of 81.8 688
%. 689
The chemical composition of the catalysts changed after introducing mesoporosity and silver 690
species. The presence of Ag (I) ions in strong interaction with the mesoporous zeolitic 691
structure was observed. Thus, a rearrangement of the acidic sites was detected producing 692
ammonia desorption peaks at temperatures above 350 °C in the TPD-NH3 analysis. This 693
infers the production of strong acid sites as a consequence of ion exchange in acid medium. 694
NMR and XPS detected the presence of octahedral Al (III) species that could be responsible 695
for the high catalytic activity in terms of conversion of the carbon and yield to glucose. 696
A deactivation of the catalyst between the first and the third reaction cycle is observed, after 697
which, the activity remains constant up to fifth cycle. The hydrolyzed carbon diminishes up 698
to 45.6% and the D-glucose yield to 37.3%, although the selectivity to glucose remains
699
relatively constant at values between 91.7 and 81.8%. The presence of Ag(0) particles 700
together with the formation of coke are responsible for the partial blockage of the pores of 701
the mesoporous zeolite support and the loss of catalytic activity. 702
703
Acknowledgements
704This work was supported by Spanish Government through the Research Project CTQ2015-705
64892-R (MINECO/FEDER) and ANPCyT (PICT 2014-2445) and CONICET (PIP 706
support received from UNL. They are grateful to ANPCyT for the purchase of the SPECS 708
multi-technique analysis instrument (PME8-2003). Thanks are given to Fernanda Mori and 709
References
711Abdelrasoul A, Zhang H, Cheng CH, Doan H (2017) Applications of molecular simulations 712
for separations and adsorption in zeolites. Microp Mesop Mater 242:294-348 713
Amama PB, Pint CL, Kim SM, McJilton L, Eyinc KG, Stach EA, Hauge RH, Maruyama B 714
(2010) Influence of alumina type on the evolution and activity of alumina-supported Fe 715
catalysts in single-walled carbón nanotube carpet growth. ACS Nano 4:895-904 716
Aspromonte SG, Miró EE, Boix AV (2012) Effecy of Ag-Co interactions in the mordenite 717
on the NOx SCR with butane and toluene. Catal Comm 28:105-110 718
Aspromonte SG, Mizrahi MD, Alonso E, Ramallo-López JM, Boix AV (2017) Co/MCM41 719
catalyst in the COProx reaction prepared by supercritical CO2 reactive deposition. Microp 720
Mesop Mater 239:147-157 721
Aspromonte SG, Mizrahi MD, Schneeberger FA, Ramallo-López JM, Boix AV (2013) Study 722
of the nature and location of silver in Ag-exchanged mordenite catalysts. Characterization by 723
spectroscopic techniques. J Phys Chem C 117:25433-25442 724
Aspromonte SG, Miró EE, Boix AV (2012) FTIR studies of butane, toluene and nitric oxide 725
adsorption on Ag exchanged NaMordenite. Adsorption 18:1-12 726
Ausavasukhi A, Suwannaran S, Limtrakul J, Sooknoi T (2008) Reversible interconversion 727
behavior of Ag species in AgHZSM-5:XRD, 1H MAS NMR, TPR, TPHE, and catalytic 728
studies. Appl Catal A: Gen 345: 89-96 729
Benaliouche F, Boucheffa Y, Ayrault P, Mignard S (2008) NH3-TPD and FTIR spectroscopy 730
of pyridine adsorption studies for characterization of Ag- and Cu-exchanged X zeolites. 731
Microp Mesop Mater 111:80-88 732
Boix AV, Miró EE, Lombardo EA, Fierro JLG (2008) The inhibiting effect of extra-733
framework Al on monolithic Co-ZSM5 catalysts used for NOx SCR. Catal Today 133-734
135:428-434 735
Brunauer S, Emmett PH, Teller E (1938) Adsorption of gases in multimolecular layers. JACS 736
60:309-319 737
Cai HL, Li CZ, Wang AQ, Xu GL, Zhang T (2012) Zeolite-promoted hydrolysis of cellulose 738
in ionic liquid, insight into the mutual behavior of zeolite, cellulose and ionic liquid. Appl. 739
Catal B: Environ 123–124: 333–338 740
Cantero D, Bermejo M, Cocero M (2013) High glucose selectivity in pressurized water 741
hydrolysis of cellulose using ultra-fasr reactor. Biores Tech 135:697-703 742
Cantero DA, Sánchez Tapia Á, Bermejo MD (2015) Pressure and temperatura effect on 743
cellulose hydrolysos in pressurized water. Chem Eng J 276:145-154 744
Cantero DA, Vaquerizo L, Mato F, Bermejo MD, Cocero MJ (2015) Energetic approach of 745
biomass hydrolysis in supercritical water. Biores Tech 179:136-143 746
Cejka J, Corma A, Zones S (2010) Zeolites and catalysis: synthesis, reactions and 747
Chheda JN, Huber GW, Dumesic JA (2007) Liquid-phase catalytic processing of biomass-749
derived oxygenated hydrocarbons to fuels and chemicals. Angew Chem Int Ed 46:7164-7183 750
Chimentao RJ, Lorente E, Gispert-Guirado F, Medina F, López F (2014) Hydrolysis of dilute 751
acid-pretreated cellulose under mild hydrothermal conditions. Carbohydr Polym 111:116-752
124 753
Cho HJ, Dornath P, Fan W (2014) Synthesis of hierarchical Sn-MFI as Lewis acid catalysts 754
for isomerization of cellulosic sugars. ACS Catal 4:2029-2037 755
Claus P, Hofmeister H (1999) Electron microscopy and catalytic study of silver catalysts: 756
structure sensitivity of the hydrogenation of crotonaldehyde. J Phys Chem B 103:2766-2775 757
do Couto Fraga A, Bittencourt Quitete CP, Ximenes VL, Falabella Sousa-Aguiar E, Botelho 758
Rego M (2016) Biomass derived solid acids as effective hydrolysis catalysts. J Mol Catal A: 759
Chem 422:248-257 760
Fang Z, Zhang F, Zeng HY, Guo F (2011) Production of glucose by hydrolysis of cellulose 761
at 423 K in the presence of activated hydrotalcite nanoparticles. Bioresour Technol 102: 762
8017–8021 763
Gardner DW, Huo J, Hoff TC, Johnson RL, Shanks BH, Tessonnier JP (2015) Insights into 764
the hydrothermal stability of ZSM-5 under relevant biomass conversion reaction conditions. 765
ACS Catal 5:4418-4422 766
Hu L, Lin L, Wu Z, Zhou S, Liu S (2015) Chemocatalytic hydrolysis of cellulose into glucose 767
over solid acid catalysts. Appl Catal B: Environ 174-175:225-243 768
Inumaru K, Ishihara T, Kamiya Y, Okuhara T, Yamanaka S (2007) Water-tolerant, highly 769
active solid acid catalysts composed of the kegging-type polyoxometalate H3PW12O40 770
immobilized in hydrophobic nanospaces of organomodified mesoporous silica. Angew Chem 771
Int Ed 46:7625-7628 772
Kobayashi H, Komanoya T, Hara K, Fukuoka A (2010) Water-tolerant mesoporous-carbon-773
supported ruthenium catalysts for the hydrolysis of cellulose to glucose. ChemSusChem 774
3:440-443 775
Meynen V, Cool P, Vansant EF (2009) Verified syntheses of mesoporous materials. Microp 776
Mesop Mater 125:170-223 777
Mignoni ML, Petkowicz DI, Fernandez Machado NRC, Pergher SBC (2008) Synthesis of 778
mordenite using kaolin as Si and Al source. Appl Clay Sc 41:99–104 779
Morales-delaRosa S, Campos-Martin JM, Fierro JLG (2018) Chemical hydrolysis of 780
cellulose into fermentable sugars through ionic liquids and antisolvent pretreatments using 781
heterogeneous catalysts. Catal Today 302:87-93 782
Pang J, Wang A, Zheng M, Zhang T (2010) Hydrolysis of cellulose into glucose over carbons 783
sulfonated at elevated temperatures. Chem Comm 46:6935-6937 784
Ravenelle RM, Diallo FZ, Crittenden JC, Sievers C (2012) Effects of metal precursors on the 785
stability and observed reactivity of Pt/-Al2O3 catalysts in aqueous phase reactions. Chem 786
Saha B, Abu-Omar MM (2014) Advances in 5-hydroxymethylfurfural production from 788
biomass in biphasic solvents. Green Chem 16:24-38 789
Sales EA, Benhamida B, Caizergues V, Lagier J-P, Fiévet F, Bozon-Verduraz F (1998) 790
Alumina-supported Pd, Ag and Pd-Ag catalysts: Preparation through the polyol process, 791
characterization and reactivity in hexa-1,5-diene hydrogentation. Appl Catal A: Gen 172: 792
273-283 793
Song S, Di L, Wu G, Dai W, Guan N, Li L (2017) Meso-Zr-Al-beta zeolite as a robust catalyst 794
for cascade reactions in biomass valorization, Appl Catal B: Env 205:393-403 795
Stepanov AG (2016) Basics of Solid-State NMR for Application in Zeolite Science. In: Sels 796
B, Kustov L (ed) Zeolites and Zeolite-like Materials, 1st edn. Elsevier, Netherlands, pp 137-797
188 798
Suganuma S, Nakajima K, Kitano M, Yagamuchi D, Kato H, Hayashi S, Hara M (2008) 799
Hydrolysis of cellulose by amorphous carbon bearing SO3H, COOH, and OH groups. J Am 800
Chem Soc 130:12787-12793 801
Tian J, Wang J, Zhao S, Jiang C, Zhang X, Wang X (2010) Hydrolysis of cellulose by the 802
heteropoly acid H3PW12O40. Cellulose 17:587-594 803
Waterhouse GIN, Metson JB, Bowmaker GA (2007) Synthesis, vibrational spectra and 804
thermal stability of Ag3O4 and related Ag7O8X salts. Polyhedron 26:3310-3322 805
Westermann A, Azambre B, Koch A (2012) Effect of Ag, Pd and Co promoters on the 806
Selective Catalytic Reduction (SCR) of NOx by ethanol over sulfated ceria-zirconia 807
catalysts. Catal Today 19:65-74 808
Yamaguchi D, Kitano M, Suganuma S, Nakajima K, Kato H, Hara M (2009) Hydrolysis of 809
cellulose by a solid acid catalyst under optimal reaction conditions. J Phys Chem C 113:3181-810
3188 811
Zhang Z, Zhao ZK (2009) Solid acid and microwave-assisted hydrolysis of cellulose in ionic 812
liquid. Carbohydr Res 344:2069-2072 813