In
fl
uence of atmospheric stability and transport on CH
4
concentrations in
northern Spain
M. Ángeles García
⁎
, M. Luisa Sánchez, Isidro A. Pérez, Marta I. Ozores, Nuria Pardo
Department of Applied Physics, University of Valladolid, Paseo de Belén 7, 47011 Valladolid, Spain
H I G H L I G H T S
•Dry CH4concentrations obtained with a
multi-point sampling system were analysed.
•Daily and yearly patterns were similar for the different heights.
•Air mass trajectories, mainly S-SE sec-tors, influencing CH4concentrations
•Conditions for background levels were established.
G R A P H I C A L A B S T R A C T
a b s t r a c t
a r t i c l e i n f o
Article history:
Received 28 September 2015
Received in revised form 15 January 2016 Accepted 16 January 2016
Available online 24 January 2016
Editor: D. Barcelo
Continuous methane (CH4) concentrations were measured in Northern Spain over two years (2011–2012) by
multi-point sampling at 1.8, 3.7 and 8.3 m using a Picarro analyser. The technique is based on cavity ring-down spectroscopy. The contrast in mean concentrations was about 1.2 ppb, with 95th percentiles differing by 2.2 ppb and mean minimum concentrations proving similar. Temporal variations of CH4were also analysed,
with a similar seasonal variability being found for the three heights. The highest CH4concentrations were
obtain-ed in late autumn and winter and the lowest in summer, yielding a range of 52 ppb. This variation may depend on the active photochemical reaction with OH radical during a period of intense solar radiation and changes in soil conditions together with variations in emissions. Peak concentration levels were recorded at night-time, be-tween 5:00–7:00 GMT, with mean values ranging between 1920 and 1923 ppb. The lowest value, around 1884 ppb, was obtained at 16:00 GMT. This diurnal variation was mainly related to vertical mixing and photo-chemistry. Therefore, CH4concentrations were also examined using the bulk Richardson number (RB) as a
stabil-ity indicator. Four groups were distinguished: unstable cases, situations with pure shearflow, transitional stages and drainageflows. The highest contrast in mean CH4concentrations between lower and upper heights was
ob-tained for the transition and drainage cases, mainly associated to high concentrations from nearby sources. The impact of long range transport was analysed by means of 3-day isobaric backward air mass trajectories, which were calculated taking into account origins from Europe, Africa, the Atlantic Ocean and Local conditions. Assess-ment of the results showed the influence of S and SE wind sectors, especially with Local conditions associated Keywords:
Atmospheric stability Background concentration Backward trajectories Methane
Richardson number
⁎ Corresponding author.
E-mail address:magperez@fa1.uva.es(M.Á. García).
http://dx.doi.org/10.1016/j.scitotenv.2016.01.099
0048-9697/© 2016 Elsevier B.V. All rights reserved.
Contents lists available atScienceDirect
Science of the Total Environment
with low winds. Finally, an estimation of the background CH4concentration in the study period provided an
av-erage value of about 1892 ppb.
© 2016 Elsevier B.V. All rights reserved.
1. Introduction
Together with water vapour and carbon dioxide, atmospheric CH4is
an important greenhouse gas. All of these impacts on the Earth's energy balance through infrared radiation absorption, have the ability to scatter energy, and are involved in photochemical reactions (Sasakawa et al., 2010). CH4is less abundant but is over 20 times more powerful than
carbon dioxide (Baldocchi et al., 2012; Lelieveld, 2006). The mean tro-pospheric lifetime of CH4 ranges between approximately 8 and
12 years, whereas for carbon dioxide it varies, averaging over 30 years (Dlugokencky et al., 2012; IPCC, 2007; Sonnemann and Grygalashvyly, 2014). Moreover, CH4 is involved in atmospheric chemistry
(Bergamaschi and Bousquet, 2008). The current CH4concentration
level in the atmosphere ranges between 1.7 and 1.8 ppm, which is more than twice the level of the pre-industrial period (Baldocchi et al., 2012; Padhy and Varshney, 2000; Wuebbles and Hayhoe, 2002). This increase is caused by the imbalance between CH4sources and sinks
and has been widely studied (Dlugokencky et al., 2003; 2009; Zhou et al., 2004), although it is not yet fully understood (Dlugokencky et al., 2012; IPCC, 2013; Kirschke et al., 2013). For about a decade, the in-crease in global CH4levels remained unnoticed. However, from 2007 to
2009 a further rise was observed (Kirschke et al., 2013; WMO, 2011). There are several major sources of atmospheric CH4of both
anthropo-genic and natural origin. Anthropoanthropo-genic sources comprise bioanthropo-genic sources like agriculture, landfills and waste processes which produced CH4because of the anaerobic decomposition of organic matter; enteric
fermentation in livestock farming; biomass burning when incomplete combustion occurs; methane leaks occurring in the production, distri-bution and combustion of fossil fuels and during industrial activities. CH4is also released by natural processes including wetlands resulting
from microorganism activity in anaerobic conditions and abundant or-ganic matter; digestion processes in termites, and microorganisms liv-ing in the oceans (IPCC, 2007; Kong et al., 2010; Sasakawa et al., 2010; Tsutsumi et al., 2006; Wuebbles and Hayhoe, 2002). Approximately two thirds of all CH4is anthropogenic in origin and emissions are mainly
from the Northern Hemisphere (Lelieveld, 2006). However, there are certain processes through which CH4is removed from the atmosphere,
90% of these occurring in the troposphere. Active oxidation reaction with the hydroxyl radical (OH) produces other species such as formal-dehyde, carbon monoxide and ozone under certain levels of nitrogen oxide (Wuebbles and Hayhoe, 2002). The process is particularly rapid in summer due to the photochemical nature of the OH radical. To a less-er extent, othless-er sinks are microbial uptake by soils and reactions with Cl and O in the stratosphere (Alvalá et al., 2004; IPCC, 2007; Zhang et al., 2014).
Systematic CH4concentrations have been measured since the 1970s
(Khalil and Rasmussen, 1994; Zhou et al., 2004). There are numerous greenhouse gas measurement programmes all over the world reflecting a major effort to make high-quality data available and to provide better insights into the processes that control gas abundance in the atmo-sphere, pinpoint trends and understand spatial distribution as well as the link to climate change. Several measurement techniques have be-come available allowing continuous and discrete samples in different scenarios (Crosson, 2008; GLOBALVIEW-CH4, 2009; Padhy and Varshney, 2000; Veenhuysen et al., 1998; Zhou et al., 2004). CH4 con-centrations are also influenced by atmospheric processes in the bound-ary layer which affect their transport and dispersion. Together with dispersion and atmospheric transport models, satellite observations im-prove our knowledge of CH4behaviour in the atmosphere as well as
po-tential sources and sinks (Buchwitz et al., 2005; Worden et al., 2012;
Zhou et al., 2003), thus allowing background CH4 levels to be
established.
In 2010, continuous measurements of CH4began at the Low
Atmo-spheric Research Centre, CIBA, in the upper Spanish plateau at three dif-ferent heights. The measuring site is a crop land use area which also has short grass. The nearest main populated cities are some distance from the sampling site, approximately 24 and 40 km away. Coupled with the meteorological features, this makes it possible to assess the useful-ness of the site for atmospheric research. Studies of other gases, partic-ularly CO2, have provided valuable information about their levels in
Spain, extending coverage of Southern Europe (García et al., 2008; Pérez et al., 2009a, 2009b; Sánchez et al., 2010). Our Laboratory is also involved in the NOAA ESRL Carbon Cycle Greenhouse Gas (CCGG) coop-erative air sampling network (www.esrl.noaa.gov).
The current paper seeks to present and analyse continuous measure-ments of atmospheric CH4in the upper Spanish plateau with a
multi-point sampling system. The influence of atmospheric stability and air mass movements in CH4concentrations is also presented. The
back-ground CH4 concentration at the measuring site is quantified by
means of a data set selection in order to minimize the effect of different controlling factors.
2. Experimental method
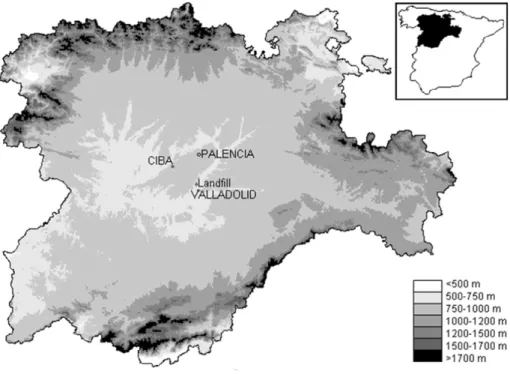
CH4was continuously measured at a ground surface station, CIBA
(latitude: 41°49′N; longitude 4°56′W; altitude: 845 m a.s.l.) from Janu-ary 2011 to December 2012 (Fig. 1). The location is a semiarid rural area characterized by non-irrigated crops as a major land use. The main near-by anthropogenic sources are the cities of Valladolid (300,000 inhabi-tants), located 24 km away and Palencia (80,000 inhabiinhabi-tants), which is further away, 40 km. Another possible contribution impacting on CH4concentrations to be taken into account is an urban landfill situated
in the southeast sector, some 20 km from Valladolid. The landfill's esti-mated annual CH4emissions were around 7 kt year−1in the study
pe-riod (PRTR, 2012).
The analyser is based on cavity ring-down spectroscopy (CRDS), G1301, and was developed by Picarro Inc. The device evidences low drift (averaging 0.2 ppb per month) and high precision (inferior to 1 ppb) and requires little maintenance, being able to simultaneously measure methane, carbon dioxide and water. The technique is based on the principle of measuring the rate of exponential decay of light in-tensity inside the cavity. The concentration of each gas species is pro-portional to the area of the spectral features. Details of the operating principle may be found inCrosson (2008);Crosson, 2007). As regards CH4, the greenhouse gas studied in this paper, equipment accuracy is
levels, respectively), with missing data being mainly due to calibration procedures and power cuts.
A 10 m mast equipped with sensors to measure air temperature, wind speed and direction, and relative humidity was also installed at the site and data were recorded each 30 min. The climate at the measur-ing site is classified as continental Mediterranean. During the study pe-riod, it was featured by a mean wind speed of 3.5 m s−1, ranging from
0.0 to 13.1 m s−1. The prevailing wind directions using a 16-sector
wind rose were NE, ENE, and WSW accounting for a frequency of 13.0, 11.7, and 10.8%, respectively (Fig. 2).
Temperature values ranged between−8.7 °C, recorded in December 2012, and 37.1 °C in August 2012, the average value being 11.5 °C.
Precipitation data were obtained from the Governmental Meteorology Agency (www.aemet.es). Maximum cumulative monthly precipitations were 65.5 and 99.6 mm in November 2011 and October 2012 (Fig. 3). Total recorded precipitation was 346.8 in 2011 and 387.5 mm in 2012. This study period corresponded to a drier period (mainly during the first year of study) compared to historical data, which showed mean yearly values (30 years) of around 450 mm.
3. Results
3.1. Water vapour correction
Water vapour content in the sampling air can underestimate CH4
concentrations due to dilution, spectral line broadening variations, and nonlinearity of water vapour concentration (Wastine et al., 2009). This is discussed inRella (2010)and the comparison of water correction fac-tors from three research studies is also presented, although minor Fig. 1.Location of the sampling site, CIBA, on the upper Spanish plateau and the main CH4sources influencing the area.
Fig. 2.16-sector wind rose and the corresponding mean wind speed (m s−1
) during the measuring period.
differences emerge between them. The manufacturer has developed a correction equation for CH4measurements which takes into account
water influence. The range of water vapour for our data set was 0.22– 2.82%v. Correction was quantified by comparing dry and wet CH4
mea-surements. The second order polynomial regression modelfits the data well.
CH4 wet
CH4 dry¼
1−0:00982H2O−0:000239H2O2 ð1Þ
with a coefficient, R2 = 1 and a residual mean square, MS Res =
4.7 × 10⁻¹⁰ ppb2. This paper deals with dry CH
4concentrations,
which presented small errors due to water vapour correction.
3.2. Temporal variations of CH4
An overall view of CH4concentrations for the three heights
consid-ered in the study period was performed. Methane concentrations showed small differences in air during the measuring period (Table 1). That is, mean concentrations increased only slightly with height and standard deviations were similar for the three levels, indicating stability. The difference between the 1.8 and 8.3 m levels was 1.3 ppb for mean concentrations. The two upper level medians differed by around 1 ppb from that of the lower one. The highest methane concentrations were found at a height of 1.8 m, mainly corresponding to outliers since the values were three times higher than the interquartile range from the upper quartile. Minimum concentrations were around 1813 ppb for the three heights. Differences with values at 3.7 m height were not sig-nificant, 0.5 ppb, the maximum differences being 0.9 ppb for the 90th and 95th percentiles. A greater contrast was in evidence with the 1.8 m height. The 95th percentile differed by 2.2 ppb and the 98th per-centile by 4.5 ppb. The other perper-centiles were around 1.2 ppb less (Fig. 4).
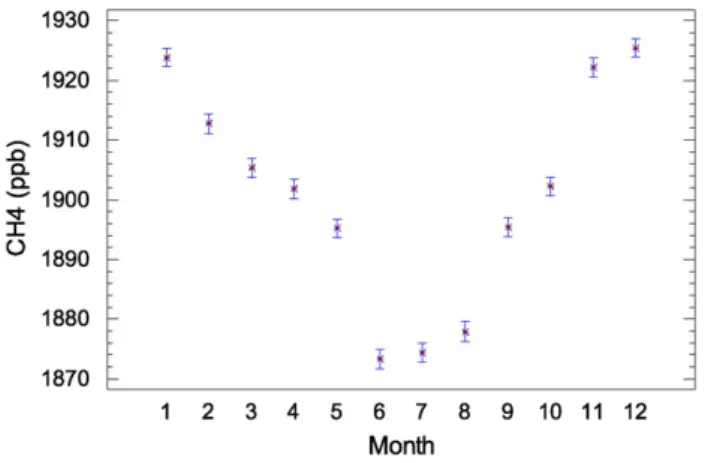
Seasonal evolution showed temporally defined patterns. The monthly mean evolution of CH4concentrations for the greatest height
(8.3 m) is depicted inFig. 5. Maximum mean concentrations were seen in late autumn, December and January, and averaged around 1924 ppb. Concentrations then decreased in spring and summer.
Changes in CH4sources and sinks, temperature and soil moisture
conditioned absorption at this time of the year, contributing to the cycle and therefore to seasonal amplitude (Mu et al., 2006; Zhou et al., 2004). The lowest mean values were obtained in June and July, and av-eraged around 1875 ppb. This might be attributed to higher tempera-tures, which dry the croplands and the later harvest, and consequently weak plant activity. This temperature and moisture dependency might lead to an increase in CH4uptake (Mu et al., 2006). The oxidation
pro-cess of CH4with the OH radical was also more intense in spring and
summer since OH is a photochemical species reaching its maximum concentrations (Dlugokencky et al., 2009). The height of the mixing layer, which is high in summertime, contributes to the dilution of com-ponents in the atmosphere and gives rise to lower CH4concentrations.
The monthly evolution described for the upper height was similar to that described for the other heights. Monthly cycle amplitudes, as the difference between the maximum and minimum mean values, were 52.1, 52.3 and 51.7 ppb for the 1.8, 3.7 and 8.3 m heights, respectively,
which are in the range of those provided for locations in the Northern Hemisphere (Crevoisier et al., 2013). Consequently, CH4concentrations
by season at the various sampling points correlated significantly with each other (R2N0.8). This 8.3 m height was taken as a reference and
dif-ferences with the other heights were calculated. As a result, the greatest differences might occur mainly in periods with lower precipitations or with higher temperatures linked to low soil activity, although these did not exceed 2.4 ppb (Whalen, 1993). In addition, when the medians of the monthly concentrations were considered, ranges of the yearly cycle were around 39 ppb for the three heights. The two upper heights showed practically no differences. The daily average median values for each season of the year showed more accentuated amplitudes in spring and summer, 28.9 and 32.5 ppb, respectively. However, in winter and autumn they were much lower 23.3 and 21.1 ppb, respectively. This could be attributed to the higher/lower range of CH4concentrations
during the day, respectively, which might be associated to photochem-ical reactions, other environmental factors or even the variable intensity of CH4emissions.
Further analysis of atmospheric CH4concentrations has evidenced
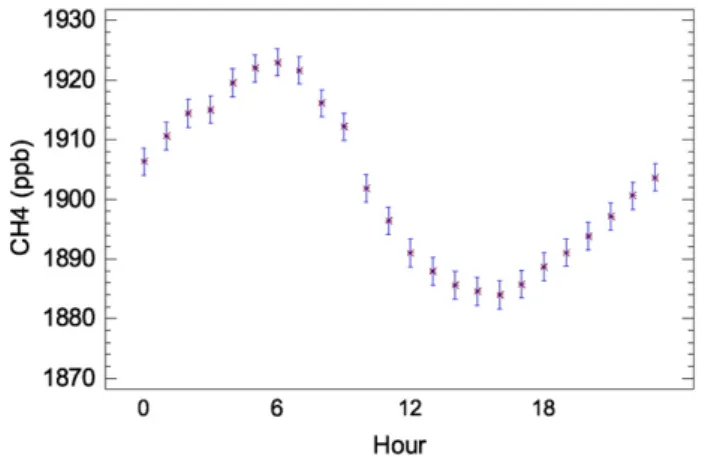
the enormous variability of its diurnal pattern; concentrations generally tending to increase at night-time and decrease in daytime.Fig. 6shows hourly mean CH4concentrations. During the day, from 8:00 to 18:00
GMT, concentrations were nearly the same for the three levels consid-ered. Minimum mean values were recorded at 16:00 GMT, 1883.9, 1884.1 and 1884.1 ppb at 1.8, 3.7 and 8.3 m, respectively. These results
Table 1
Main statistics of CH4concentrations at the three different heights.
Height (m)
Mean (ppb)
Median (ppb)
Standard deviation (ppb)
Maximum (ppb)
Minimum (ppb)
1.8 1900.9 1892.6 64.5 4777.6 1812.6 3.7 1901.8 1893.3 65.8 4452.6 1812.6 8.3 1902.2 1893.6 63.9 4661.6 1813.2
Fig. 4.Differences between the CH4percentiles of the various measurement heights.
Fig. 5.Monthly evolution of dry mean CH4concentrations at 8.3 m. The least significant
were mainly associated with the reactions involving OH radicals de-pending on temperature and solar radiation (Vaghjiani and Ravishankara, 1991). Moreover, CH4concentrations are regulated by
thermal turbulence, which causes intensive vertical mixture. The height of the mixing layer varied with a maximum during the day causing lower concentrations since there was more dilution in the air (Sasakawa et al., 2010; Pérez et al., 2012). As regards mean median values at this time, there were no differences between the two upper levels and the lowest level, 0.3 ppb. The higher concentration at night-time can be explained by the collapse of the boundary layer, an increase in atmospheric stability and elevated methane emissions related to fugi-tive emissions from landfill activity. Strong temperature inversions at the site also contributed to trapping gases at night-time (Baldocchi et al., 2012; Sánchez et al., 2010).
Slightly higher differences between the concentration measured at 8.3 m and at the low height, 1.8 m, were found overnight when
concentrations are greater, and averaged around 2.3 ppb. This behav-iour can also be seen in the medians, 1.9 ppb. The daily range was around 38.6 ppb for 1.8 m, and 39.1 ppb for the 3.7 and 8.3 m heights. Maximum concentrations were obtained at 5:00–7:00 GMT for the three levels showing a difference of 2 ppb between the two upper levels, with an average close to 1923 ppb, and the lowest. This daily cycle was similar to that obtained in other environments (Baldocchi et al., 2012; Gao et al., 2011).
When the CH4diurnal pattern for each season in the study period
was considered, a similar behaviour of mean CH4concentrations was
obtained for all the heights in winter, spring, summer and autumn. The evolution pattern for the 8.3 m height can be seen inFig. 7(a–d). In winter, an amplitude of 31.8 ppb in the mean values was observed whereas in spring, the diurnal range was higher, 49.5 ppb, with values gradually increasing from 16:00 to 5:00 GMT when a peak was reached. A similar diurnal pattern was obtained in summer although with a lower amplitude, 44.2 ppb. In autumn, the range is 51.1 ppb and higher values were recorded during the early morning, showing a greater con-trast than the increasing evolution in the other seasons. Seasonal and di-urnal changes in the boundary layer and noctdi-urnal inversions, atmospheric transport, photochemical reactions in warm seasons and soil features conditioned the CH4evolution found during the
measure-ment period. Results were in agreemeasure-ment with those observed at other continental sites in the Northern Hemisphere (Dlugokencky et al., 1993) and differed from other unusual patterns (Zhou et al., 2004).
3.3. Atmospheric stability
The evolution of the boundary layer is strongly related with varia-tions of components in the atmosphere. In this section, the effect of at-mospheric stability on CH4concentrations at the sampling location is
examined. The bulk Richardson number (RB) has been widely used to
specify dynamic stability and turbulence and has been successfully ap-plied to classify wind speed profiles (Komatsu et al., 2005; Pérez et al., 2009a). The bulk Richardson number is defined following the same Fig. 6.Daily evolution of dry mean CH4concentrations at 8.3 m height. The least significant
difference intervals (95% confidence level) are included.
Fig. 7.Daily pattern of dry mean CH4concentrations by season for the 8.3 m height in the study period: a) winter; b) spring; c) summer; and d) autumn. Intervals with the least significant
procedure asPérez et al. (2009b)taken fromArya (2001),
RB¼ g z
T θθs
ð Þ
u2 ð2Þ
where g is acceleration by gravity, T is air temperature at 34.6 m, u is wind speed at 34.6 m, z is the reference height, andθ–θsis the difference
between the potential temperature at 34.6 and 10 m. We were seeking an empirical relationship between wind profiles represented by relative wind speed and atmospheric stability linked to RB. Relative wind speed
was analysed as a function of the RBand different intervals could be
established. In this study, it was set at RBb0 for neutral or unstable
cases, mainly from daytime data; 0bRB≤0.05 for pure shearflows;
0.05bRB≤0.5 includes transition stages; and 0.5bRBfor drainage
flows associated to stables cases, most of them from night-time values. Mean CH4concentrations at 8.3 m, as the reference height, were
cal-culated for each interval. An analysis of the variance between CH4
con-centrations and the intervals of RBvalues distinguished four groups with
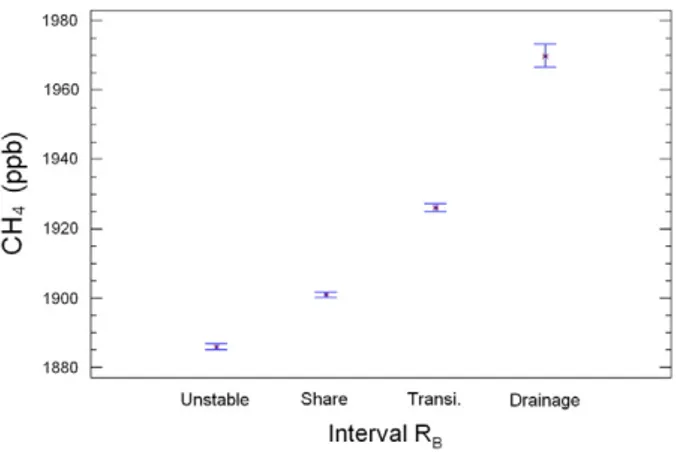
means whose differences are statistically significant at 95% confidence level.Fig. 8depicts CH4means at 8.3 m for the different stability groups.
In addition,Table 2shows CH4means and medians together with the
meteorological variables characterizing the groups.Fig. 8shows how unstable situations corresponded to lower concentrations, on average 1885.8 ppb, since these observations were recorded during the day, and accounted for 99.2% of the data in this group. They were linked to days with high relative wind speed, a mean value of 4.3 m s−1and an average temperature of around 18 °C. In addition, diurnal convection causes the air to rise to high altitudes, such that this result should be considered as background concentration considering only daytime, yielding a mean value of about 1885 ppb. The second group, including pure shearflows, with a mean wind speed of 3.9 m s−1, showed a higher
CH4concentration, 1901 ppb. The next group corresponded to
transi-tion situatransi-tions, mainly at night and with inhibited vertical movement, an average of 1926 ppb, with lower mean wind speed, 1.9 m s−1.
Drain-age cases with high RBvalues, low relative wind speed, 0.8 m s−1and
temperature about 3 °C, yielded a mean CH4value of 1969.9 ppb,
although the frequency of these observations at this site with no com-plex terrain was the lowest, standing at 2%.
We now focus attention on the differences between CH4
concentra-tions at the 1.8 and 8.3 m heights. The highest contrasts in their means were obtained for the transition and drainage cases during the night, 4 and 7 ppb, respectively, associated to low winds and temperatures as main features. However, in order to avoid the influence of outliers or ex-treme values influencing these two groups, medians of CH4
concentra-tion values were considered. The first two groups contained the greatest number of cases, approximately 76% of the whole, and showed a median value of 1883 and 1895 ppb, respectively, with CH4
concentra-tions being almost homogeneous within these heights. In the third group, medians showed a slight difference between low and high heights, 1905 and 1908 ppb, respectively. The influence of extreme values was particularly important given the difference between the av-erage values and the median data, around 17 ppb for all the heights and occurred in 21% of cases. For drainageflows, a greater difference was found in the medians, 6 ppb, 1922 and 1928 ppb for the 1.8 and 8.3 m height, respectively. Compared with the mean values shown in Table 2, outliers might contribute with around 42 ppb. These situations may be attributed to high emissions from nearby sources, mainly the cities of Valladolid and Palencia and the urban landfill. Consequently, at-mospheric stability as a function of RBproved useful to differentiate CH4
concentrations at a specific location.
3.4. Trajectory analysis
The impact of anthropogenic emissions and natural processes on CH4concentrations at the sampling site was also investigated in
re-sponse to atmospheric transport pathways which represent one of the main controlling factors of greenhouse gases (Artuso et al., 2007; Balzani et al., 2008). For this reason, this effect was analysed by means of the air-flow patterns of back-trajectories. The origins of the advected air masses reaching the sampling site for each of the measuring days were tracked. Trajectories were obtained using the HYSPLIT-4 Model (Hybrid Single-Particle Lagrangian Integrated Trajectory) (Draxler and Rolph, 2014; Rolph, 2013). This model has been successfully applied in many studies assessing the influence of long-range transport on high ambient pollutant concentrations (Cristofanelli et al., 2011; García et al., 2005; Van der Laan et al., 2009). A mixed layer where trans-port and dispersion take place is assumed by the model. The vertical ex-tent of the mixed layer is calculated within the model from poex-tential temperature data byfinding the height of an elevated inversion at each grid point. Three day (72 h) backward trajectories originated at 06:00 GMT and, taking an arrival height of 500 m above ground level, were calculated by the model. This height was selected since it could be representative of the top of the transport layer and it is commonly taken as a boundary between surface and upper winds (Katsoulis, 1999). These trajectories werefirst used to analyse dry CH4
concentra-tions in the study period at the upper height as the reference of the whole range.
Wind sectors were assigned to each of the back-trajectories taking into account the beginning of the trajectory. Trajectories were classified into four origins (Fig. 9): Atlantic (air masses originating in the sectors between the northwest and southwest of the Atlantic Ocean); European (air masses commencing at some location over Europe and
Table 2
Mean and median CH4concentrations and meteorological variables for the stability groups at 8.3 m height using the bulk Richardson number.
Frequency (%) Mean CH4(ppb) Median CH4(ppb) Wind speed (m s−1) Temperature (°C)
Unstable cases 31.8 1885.8 ± 35.1 1883.0 4.3 17.6
Pure shear 45.4 1900.9 ± 43.7 1895.1 3.9 9.1
Transition stages 20.6 1926.0 ± 95.7 1908.2 1.9 7.4
Drainageflows 2.3 1969.9 ± 195.7 1927.6 0.8 3.1
Fig. 8.CH4means at 8.3 m height for the stability groups: Unstable, Pure shear, Transi.
reaching the sampling site from northeast to southeast); African (trajec-tories originating in the African continent and entering the Peninsula from the south, southwest, or southeast); Local (air masses are confined within the Iberian Peninsula or its vicinity and travel short distances).
The main results are presented inTable 3for the study period. The dominant trajectories were Atlantic, accounting for 53.3% particularly in spring, summer and autumn. Conversely, an African origin was infre-quent, presenting the smallest ratio, 5.4%. Daily maximum CH4
concen-trations showed the highest mean value compared to the other origins and were influenced by variations in emissions/uptake, environmental and meteorological factors. Atlantic and European trajectories provided the smallest average values, 1974 and 1990 ppb, respectively. However, Local conditions together with African trajectories presented the highest average maxima, 2058 and 2171 ppb, respectively. This result could be interpreted bearing in mind that the location of the main pol-lutant sources lies in the surroundings or inland (Europe) and stagnant conditions. Smaller discrepancies were found for the average minimum concentrations, with a range between 1863 and 1885 ppb. However, mean values were around 1910 ppb for all the trajectories except for those of Atlantic origin, which had 15 ppb less. The marine boundary layer might also act, albeit to a lesser extent, as a sink due to chlorine radical reactions (Kirschke et al., 2013). These results were in accor-dance with those reported in other studies such as Mauna Loa (Harris et al., 1992). However, contrasting results were obtained byZhang et al. (2013)at locations in China.
Further analysis of CH4concentrations was performed by taking into
account wind direction and speed during the whole day. Considering the 16 sectors of the wind rose, 22.5° each, the results showed the great importance of the S, SE and SSE in the CH4concentrations
record-ed at CIBA, together, although to a smaller degree, with ESE and SSW. The influence of these wind directions in CH4 variations was also
discussed inSánchez et al. (2014). The overall mean value of CH4
con-centrations in the previously mentioned wind sectors was 1924.7 ppb, approximately 31 ppb higher than that of the remaining sectors. Specif-ically, the results obtained for the days associated with Local conditions provided a 95th percentile of 1979.4 ppb. The group including S, SE and SSE presented a frequency of 19.9%, with an average concentration of 1945.0 ppb, the lower quartile being 1891.1 ppb and the interquartile
range 57.7 ppb (Table 4). The mean wind speed associated for the Local conditions was 2.6 m s−1, with 60% of the data being lower,
which represented a light wind on the Beaufort scale. As a consequence, sources, mainly nearby cities, the landfill and livestock which lie in those directions, might make a greater contribution to CH4levels.
Exceedances of the said CH4threshold (95th percentile) may be
as-cribed to singular fugitive emissions from the nearby sources, particu-larly from the landfill, on average 2140.8 ppb.
As regards days assigned to African trajectories, these provided a 95th percentile of 2015.5 ppb. The main wind directions of interest pre-sented a lower interquartile range, around 12 ppb less than that of the Local conditions and with an average wind speed of above 3 m s−1. The average of the greatest concentrations considered as exceedances was 2287.5 ppb, although these were infrequent. The difference be-tween maximum and minimum values of African origin was higher than in the others and might be due to sporadic fugitive emissions in the main direction of the source influence, although there were few values such that no definite conclusion could be established.
When days with European trajectories were isolated, results showed that the 95th percentile was 1957.5 ppb and the average for exceedances is 2075.5 ppb. The higher values obtained for the Local con-ditions and African trajectories (less frequent) were influenced by the impact of nearby anthropogenic sources, sporadic emissions, a greater frequency of the southeast wind sector and the state of the lower atmo-sphere at the measuring site. The European origin comprised fewer cases involved within the S and SE sectors, 10%, which provided an
Table 3
Main CH4results corresponding to the 8.3 m height for each trajectory.
Trajectory Frequency (%)
Maximum (ppb)
Minimum (ppb)
Mean (ppb)
Atlantic 53.3 1973.5 1871.9 1894.9 ± 35.4 European 19.1 1990.4 1885.3 1910.8 ± 25.2 Local conditions 22.2 2058.1 1876.9 1911.2 ± 46.4 African 5.4 2171.1 1862.7 1909.5 ± 48.5
average concentration of around 1937 ppb with some influence from continental sources. Wind directions, NNE, NE and ENE represented 55% of all cases within the days with European trajectory, with mean CH4concentrations being around 1908 ppb, a value similar to the
mean found for this type of trajectory. The mean wind speed for all days was 3.7 m s−1, higher than that for Local conditions and African trajectories. Regarding the Atlantic trajectories, the 95th percentile is 1945.4 ppb and the average for the exceedances is 2020.2 ppb. Cases with wind directions involved in the W, NW and N sectors were 46%, with a mean CH4value of 1889.5 ppb, around 2 ppb higher than the
lower quartile. SE and S sectors with a lower frequency, 9%, were asso-ciated with a mean concentration of 1931 ppb, linked to a mean wind direction of 2.5 m s−1. From the results, the important contribution of
source emissions around the sampling site on CH4concentrations can
be concluded, together with the dominant airflow, particularly S, SE, SSE wind directions, especially with Local conditions associated to low winds.
3.5. The CH4background concentration
The results obtained in the previous subsections regarding temporal variations, exceedances and transport were suitable for determining the representative conditions of the background CH4level at the site in a
well-mixed air, in an effort to distinguish the contribution of potential sources of interference and to avoid concentration excess. To analyse the state of CH4in the atmosphere it was important to separate the
data affected by local conditions or neighbouring sources from those in undisturbed conditions. There were different procedures for selecting data (Zhou et al., 2004). First, data from 8.3 m height were selected for this analysis due to the similar behaviour between the different levels and that height is comparable to the measurement height of the mete-orological variables. In our case, data were representative of baseline conditions without considering the following values: all CH4values
as-sociated with winds from the SE and S sectors (ESE, SE, SSE, S and SSW) (22.6%), and values during calms which referred to stagnant local conditions (1.1%). Moreover, different restrictions were taken into account to exclude data: a) values outside the mean ± 3σ(σis the standard deviation of all data, 64.1 ppb) so as to avoid peaks from high emissions, 0.29% of data; b) values outside the mean ± 1.5σ, ap-proximately 0.93%; c) values above the 90th and below the 1st percen-tiles (8.45% of all data); d) values above the 75th and below the 1st
percentiles (21.97%); andfinally, e) values above and below the inter-quartile range (IR) from the upper and lower inter-quartile, 1955.5 and 1849.3 ppb, respectively (3.84%). The remaining data in each case pro-vided mean CH4values which are presented inTable 5. The range of
mean concentrations obtained was 10.2 ppb. The lowest mean value corresponded to the restriction using the 1st and 75th, 1884.1 ± 17.0 ppb, and the highest value was obtained with the mean ± 3σ, 1894.3 ± 29.2 ppb. Consequently, in order to establish a background level for CH4, the three remaining mean values were considered,
al-though restrictions b) and d) yielded similar values, with a difference of 0.2 ppb. Mean concentrations ranged from 1889.9 to 1893.2 ppb, and averaged around 1892.2 ppb, which is higher than others found for non-polluted areas (Sánchez et al., 2014). This value was closer to the concentration obtained after applying the restriction of mean ± 1.5 times the interquartile range or mean ± 1.5 times the standard de-viation. The difference between the CH4baseline and the overall mean
value from the whole data set was 10 ppb, and was therefore attributed to mainly anthropogenic sources such as cities, livestock and the landfill in the area together with the features of the lower atmosphere at the measuring site.
4. Conclusions
Dry continuous measurements of CH4concentrations over two years
were carried out at three different heights, 1.8, 3.7 and 8.3 m, in a rural site at CIBA, on the upper Spanish plateau. An analysis of the variability of CH4concentrations was performed. In general, small differences in
CH4concentrations were found for all heights, 2.3 ppb in the 95th
per-centile, presenting similar patterns. Monthly means increased from au-tumn to winter. Minimum concentrations occurred in June–July, with temperature being a significant controlling factor since it diminishes plant activity in the area, and methane oxidation with OH radicals inten-sifies, which is considered the principal removal process. The cycle peak-to-peak amplitude was about 52 ppb for the mean values, al-though the value is lower when medians are considered, 39 ppb. The daily pattern showed the lowest levels in the afternoon at 16:00 GMT, with a value of 1884 ppb, whereas the highest ones occurred over a wide range, from 5:00 to 7:00 GMT, with an average value of around 1923 ppb. This variation was related to changes in the mixing layer and in atmospheric turbulence and photochemical activity during the day and strong nocturnal inversions at night. RBwas used to analyse
the influence of atmospheric stability on CH4concentrations. Four
inter-vals were considered: unstable cases, pure shearflows, transition cases and drainageflows. When analysing them, we found the highest mean concentration for drainageflows, around 1970 ppb, with relatively high concentrations corresponding to transitional cases yielding 50 ppb less. Pure shear and unstable situations were linked to the lowest concentra-tions, 1900 and 1885 ppb, and the higher wind speed.
Although the computation methods provided a certain qualitative approach, analysis of the 3-day backward trajectories allowed us to dis-tinguish the impact of air masses on CH4features, providing meaningful
information of its variability in the atmosphere. Air masses over the sampling site from the Atlantic did not contribute to increasing CH4
Table 5
Mean CH4concentrations once different selection criteria were applied.
Data excluded Mean CH4value (ppb)
(1.8 m height)
Mean CH4value (ppb)
(3.7 m height)
Mean CH4value (ppb)
(8.3 m height)
• Calm conditions
• Wind sector influence (ESE, SE, SSE and S SSW directions)
a) Mean ± 3σ 1893.1 ± 29.1 1893.7 ± 29.1 1894.3 ± 29.1 b) Mean ± 1.5σ 1892.3 ± 27.3 1892.9 ± 27.3 1893.4 ± 27.2 c) 1%bdatab90% 1888.7 ± 21.2 1889.3 ± 21.1 1889.9 ± 21.1 d) 1%bdatab75% 1882.9 ± 17.1 1883.6 ± 17.0 1884.1 ± 17.0 e) Mean ± 1.5 times the interquartile
range
1892.2 ± 22.2 1892.7 ± 22.1 1893.2 ± 22.1
Table 4
95th percentile for each trajectory. Influence of the main wind sectors, S, SE, SSE through different statistics: lower quartile, interquartile range and exceedances.
Origin/statistics 95th (ppb)
Lower quartile (ppb)
Interquartile range (ppb)
Exceedances (ppb)
concentrations compared to the other origins. However, the larger mean recorded for Local conditions might indicate the influence of me-teorological factors and a certain loading of the atmosphere with meth-ane of mainly anthropogenic origin, particularly related to the city of Valladolid, sporadic fugitive emissions from a nearby landfill, both in the S and SE wind sectors, and livestock in the region.
The background concentration established for the measuring site selecting the data without considering those associated with south and east wind sectors and stagnant conditions, among others, was 1892 ppb. The procedure provided representative baseline conditions, and controlling factors need to be borne in mind if a better understand-ing of CH4levels at other similar sites, particularly in southern Europe, is
to be gained. More research should be carried out to identify and imple-ment measures or aimed at changing techniques so as to achieve reduc-tions in greenhouse gases.
Conflict of interest
The authors declare that there is no conflict of interest regarding publication of this paper.
Acknowledgements
This research was supported by the Ministry of Economy and Com-petitiveness and ERDF funds, in the framework of the projects CGL2009-11979 and CGL2014-53948-P.
References
Alvalá, P.C., Boian, C., Kirchhoff, V.W.J.H., 2004.Measurements of CH4and CO during ship cruises in the South Atlantic. Atmos. Environ. 38, 4583–4588.
Artuso, F., Chamard, P., Piacentino, S., di Sarra, A., Meloni, D., Monteleone, F., Sferlazzo, D.M., Thiery, F., 2007.Atmospheric methane in the Mediterranean: analysis of mea-surements at the island of Lampedusa during 1995–2005. Atmos. Environ. 41, 3877–3888.
Arya, S.P., 2001.Introduction to Micrometeorology. second ed. Academic, San Diego.
Baldocchi, D., Detto, M., Sonnentag, O., Verfaillie, J., Teh, Y.A., Silver, W., Kelly, N.M., 2012.
The challenges of measuring methanefluxes and concentrations over a peatland pas-ture. Agric. For. Meteorol. 2012 (153), 177–187.
Balzani, L., Henne, J.M., Legreid, S.G., Staehelin, J., Reimann, S., Prévôt, A.S.H., Steinbacher, M., Vollmer, M.K., 2008. Estimation of background concentrations of trace gases at the Swiss Alpine site Jungfraujoch (3580 m asl). J. Geophys. Res. 113, D22305.
http://dx.doi.org/10.1029/2007JD009751.
Bergamaschi, P., Bousquet, P., 2008.Estimating sources and sinks of methane: an atmo-spheric view. In: Johannes, A., Freibauer, A., Valentini, R. (Eds.), The Book, The Continental-Scale Greenhouse Gas Balance of Europe. Springer, New York.
Buchwitz, M., de Beek, R., Nöel, S., Burrows, J.P., Bovensmann, H., Bremer, H., Bergamaschi, P., Körner, S., Heimann, M., 2005.Carbon monoxide, methane and carbon dioxide col-umns retrieved from SCIAMACHY by WFM-DOAS: year 2003 initial data set. Atmos. Chem. Phys. Discuss. 5, 1943–1971.
Crevoisier, C., Nobileau, D., Armante, R., Crepeau, L., Machida, T., Sawa, Y., Matsueda, H., Schuck, T., Thonat, T., Pernin, J., Scott, N.A., Chedin, A., 2013.The 2007-2011 evolution of tropical methane in the mid-troposphere as seen from space by MetOp-A/IASI. Atmos. Chem. Phys. 13, 4279–4289.
Cristofanelli, P., Calzolari, F., Bonafé, U., Lanconelli, C., Lupi, A., Busetto, M., Vitale, V., Colombo, T., Bonasoni, P., 2011.Five-years analysis of background carbón dioxide and ozone variations during summer seasons at the Mario Zucchelli station (Antarctica). Tellus 63B, 831–842.
Crosson, E.R., 2007.Afield-deployable, high accuracy atmospheric multi-gas monitor based on cavity ring-down spectroscopy. Symposium on air quality measurement. Methods and Technology. Air & Waste Manag. Assoc., San Francisco, CA.
Crosson, E.R., 2008.A cavity ring-down analyzer for measuring atmospheric levels of methane, carbon dioxide and water vapour. Appl. Phys. B92, 403–408.
Dlugokencky, E.J., Harris, J.M., Chung, Y.S., Tans, P.P., Fung, I., 1993.The relationship be-tween the methane seasonal cycle and regional sources and sinks at Tae-ahn Penin-sula, Korea. Atmos. Environ. 27A (14), 2115–2120.
Dlugokencky, E.J., Houweling, S., Bruhwiler, L., Masarie, K.A., Lang, P.M., Miller, J. B., Tans, P.P, 2003. Atmospheric methane levels off: temporary pause or a new steady-state?, Geophys. Res. Lett., 30, 1992,http://dx.doi.org/10.1029/2003GL018126.
Dlugokencky, E.J., Bruhwiler, L., White, J.W.C., Emmons, L.K., Novelli, P.C., Montzka, S.A., Masarie, K.A., Lang, P.M., Crotwell, A.M., Miller, J.B., Gatti, L.V., 2009. Observational constraints on recent increases in the atmospheric CH4burden. Geophys. Res. Lett.
36, L18803.http://dx.doi.org/10.1029/2009GL039780.
Dlugokencky, E.J., Nisbet, E.G., Fisher, R., Lowry, D., 2012. Global atmospheric methane: budget, changes and dangers. Phil. Trans. R. Soc. A 369 (2058–2072), 2011.http:// dx.doi.org/10.1098/rsta.2010.0341.
Draxler, R.R., Rolph, G.D., 2014. HYSPLIT (HYbrid Single-Particle Lagrangian Integrated Trajectory) Model access via NOAA ARL READY Website (http://ready.arl.noaa.gov/ HYSPLIT.php). NOAA Air Resources Laboratory, Silver Spring, MD.
Gao, Z., Yuan, H., Ma, W., Liu, J., Liu, X., Desjardins, R.L., 2011. Diurnal and seasonal pat-terns of methane emissions from a dairy operation in North China Plain. Adv. Meteorol.http://dx.doi.org/10.1155/2011/190234.
García, M.A., Sánchez, M.L., Pérez, I.A., de Torre, B., 2005.Ground level ozone concentra-tions at a rural location in northern Spain. Sci. Total Environ. 348, 135–150.
García, M.A., Sánchez, M.L., Pérez, I.A., de Torre, B., 2008.Continuous carbon dioxide mea-surements in a rural area in the upper Spanish plateau. J. Air & Waste Manage. Assoc. 58, 940–946.
GLOBALVIEW-CH4, 2009. Cooperative Atmospheric Data Integration Project—Methane.
CD-ROM, NOAA ESRL, Boulder, Colorado [Also available on Internet via anonymous FTP to ftp.cmdl.noaa.gov, Path: ccg/ch4/GLOBALVIEW].
Harris, J.M., Tans, P.P., Dlugokencky, E.J., Masarie, K.A., Lang, P.M., Whittlestone, S., Steele, L.P., 1992.Variations in atmospheric methane at Mauna Loa Observatory related to long-range transport. J. Geophys. Res. 97, 6003–6010.
IPCC, 2007. Summary for Policymakers, Climate Change 2007: the physical science basis. Contribution of Working Group I to the Fourth Assessment Report of the Intergovern-mental Panel on Climate Change [Solomon, S., D. Qin, M. Manning, Z. Chen, M. Mar-quis, K.B. Averyt, M. Tignor and H.L. Miller (eds.)]. Cambridge University Press, Cambridge, United Kingdom and New York, NY, USA.
IPCC, 2013. Climate Change 2013: the physical science basis. Contribution of Working Group I to the Fifth Assessment Report of the Intergovernmental Panel on Climate Change [Stocker, T. F., D. Qin, G.-K. Plattner, M. Tignor, S. K. Allen, J. Boschung, A. Nauels, Y. Xia, V. Bex and P. M. Midgley (eds.)]. Cambridge University Press, Cam-bridge, United Kingdom and New York, NY, USA.http://www.climatechange2013. org/images/report/WG1AR5_TS_FINAL.pdf.
Katsoulis, B.D., 1999.The potential for long-range transport of air-pollutants into Greece: a climatological analysis. Sci. Total Environ. 231, 101–113.
Khalil, M.A.K., Rasmussen, R.A., 1994.Global emissions of methane during the last several centuries. Chemosphere 29, 833–842.
Kirschke, S., Bousquet, P., Ciais, P., Saunous, M., Canadell, J.G., et al., 2013. Three decades of global methane sources and sinks. Nat. Geosci. 1–11.http://dx.doi.org/10.1038/ NGEO1955.
Komatsu, H., Hotta, N., Kuraji, K., Suzuki, M., Oki, T., 2005.Classification of vertical wind speed profiles observed above a sloping forest at nighttime using the bulk Richardson number. Bound.-Layer Meteor. 115, 205–221.
Kong, S., Lu, B., Han, B., Bai, Z., Xu, Z., You, Y., Jin, L., Guo, X., Wang, R., 2010.Seasonal var-iation analysis of atmospheric CH4, N2O and CO2in Tianjin offshore area. Sci. China Earth Sci. 53, 1205–1215.
Lelieveld, J., 2006.Climate change: a nasty surprise in the greenhouse. Nature 443, 405–406.
Mu, Z., Kimura, S.D., Hatano, R., 2006.Estimation of global warming potential from upland cropping systems in central Hokkaido, Japan. Soil Sci. Plant Nutr. 52, 371–377.
Padhy, P.K., Varshney, C.K., 2000.Ambient methane levels in Delhi. Chemosphere-Global Change Sci. 2, 185–190.
Pérez, I.A., Sánchez, M.L., García, M.A., de Torre, B., 2009a.CO2transport by urban plume in the upper Spanish plateau. Sci. Total Environ. 407, 4934–4938.
Pérez, I.A., Sánchez, M.L., García, M.A., de Torre, B., 2009b.Daily and annual cycle of CO2 concentration near the surface depending on boundary layer structure at a rural site in Spain. Theor. Appl. Climatol. 98, 269–277.
Pérez, I.A., Sánchez, M.L., García, M.A., Pardo, N., 2012.Analysis andfit of surface CO2 con-centrations at a rural site. Environ. Sci. Pollut. R. 19, 3015–3027.
PRTR, 2012. Registro Estatal de Emisiones y Fuentes Contaminantes,http://www.prtr-es.es/. Rella, C.H., 2010.Accurate Greenhouse Gas Measurements in Humid Gas Streams Using the Picarro G1301 Carbon Dioxide/Methane/Water Vapor Gas Analyzer, Sunnyvale, CA.
Rolph, G.D., 2013. Real-time Environmental Applications and Display sYstem (READY) Website (http://ready.arl.noaa.gov). NOAA Air Resources Laboratory, Silver Spring, MD.
Sánchez, M.L., Pérez, I.A., García, M.A., 2010.Study of CO2variability at different temporal scales recorded in a rural Spanish site. Agric. For. Meteorol. 150, 1168–1173.
Sánchez, M.L., García, M.A., Pérez, I.A., Pardo, N., 2014.CH4continuous measurements in the upper Spanish plateau. Environ. Monit. Assess. 186, 2823–2834.
Sasakawa, M., Shimoyama, K., Machida, T., Tsuda, N., Suto, H., Arshinov, M., Davydov, D., Fofonov, A., Krasnov, O., Saeki, T., Koyama, Y., Maksyutov, S., 2010.Continuous mea-surements of methane from a tower network over Siberia. Tellus 62, 403–416.
Sonnemann, G.R., Grygalashvyly, M., 2014.Global annual methane emission rate derived from its current atmospheric mixing ratio and estimated lifetime. Ann. Geophys. 32, 277–283.
Tsutsumi, Y., Mori, K., Ikegami, M., Tashiro, T., Tsuboi, K., 2006.Long-term trends of green-house gases in regional and background events observed during 1998–2004 at Yonagunijima located to the east of the Asian continent. Atmos. Environ. 40, 5868–5879.
Vaghjiani, G.L., Ravishankara, A.R., 1991.New measurement of the rate coefficient for the reaction of the OH with methane. Nature 350, 406–409.
Van der Laan, S., Neubert, R.E.M., Meijer, H.A.J., 2009.Methane and nitrous oxide emis-sions in The Netherlands: ambient measurements support the natural inventories. Atmos. Chem. Phys. 9, 9369–9379.
Veenhuysen, D., Vermeulen, A.T., Hofschreuder, P., Van Den Bulk, W.C.M., 1998.Methane emission of the Amsterdam urban area. Water Air Soil Pollut. 107, 321–333.
Whalen, M., 1993.The global methane cycle. Annu. Rev. Earth Planet. Sci. 21, 407–426.
WMO, 2011. Greenhouse Gas Bulletin. World Meteorological Organization. November, 7. Worden, J., Kulawik, S., Frankenberg, C., Payne, V., Bowman, K., Cady-Peirara, K., Wecht, K., Lee, J.-E., Noone, D., 2012.Profiles of CH4, HDO, H2O and N2O with improved lower tropospheric vertical resolution from Aura TES radiances. Atmos. Meas. Tech. 5, 397–411.
Wuebbles, D.J., Hayhoe, K., 2002.Atmospheric methane and global change. Earth-Sci. Rev. 57, 177–210.
Zhang, F., Zhou, L.X., Xu, L., 2013.Temporal variation of atmospheric CH4and the potential source regions at Waliguan, China. Earth Sci. China 56, 727–736.
Zhang, D., Liao, H., Wang, Y., 2014.Simulated spatial distribution and seasonal variation of atmospheric methane over China: contributions from key sources. Adv. Atmos. Sci. 31, 283–292.
Zhou, L., Tang, J., Wen, Y., Li, J., Yan, P., Zhang, X., 2003.The impact of local winds and long-range transport on the continuous carbon dioxide record at Mount Waliguan, China. Tellus 55B, 145–158.