R =
p
p
r i=
−
+
1
1
1 2 1 2 z z z zACTIVE NOISE CONTROL IN A TRANSMISSION SURFACE
43.50x
Romeu Garbí, J.; Jiménez Díaz,S.; Salueña Berna, X.; Capdevila Pagés, R.
Laboratorio de Mecánica e Ingeniería Acústica. E.T.S. de Ingenieros Industriales de Terrassa U.P.C. C/ Colom, 11 08222 TERRASSA
Telf: 937 398 146 Fax: 937 398 101
e-mail: romeu@em.upc.es
ABSTRACT
This work is focussed on active control of an acoustic impedance in a transmission surface. The aim is to avoid noise propagation from the interior of an enclosure through an aperture in its wall using techniques of local noise control. As it is known, acoustic impedance is reduced by the reduction of sound pressure, thus, the objective is to set the impedance value to zero by attenuating the sound pressure using active noise control techniques. With the reduction of impedance, the sound waves of the interior of the enclosure are reflected towards its interior, avoiding the noise transmission to the exterior of an enclosure.
INTRODUCTION
The specific acoustic impedance of a medium, z, is described as the quotient between the acoustic pressure and the particle speed.The pressure reflexion coefficient in a boundary, in case of normal incidence is1
(1)
where z1 and z2 are the characteristic impedances of each medium which separates the boundary. When z2
tends to zero, the pressure reflexion coefficient tends to -1. Therefore, a positive pressure in the incident wave is reflected as a negative pressure, with the same amplitude, and the pressure transmission is almost zero. In case of oblique incidence, provided the same medium at both sides of the boundary, the reflection coefficient value does not depend on the incidence angle of the sound waves and is equal to (1).
One of the acoustic mechanisms of active noise cancellation in ducts is the reflection2 of a primary wave by a secondary monopole source. Acoustic pressure at the secondary source position is maintained at zero by its action, thus, the value of acoustic impedance z2 is also zero and sound is perfectly reflected, although a
compression is reflected as a rarefaction. Therefore, the secondary source provides a pressure release boundary condition and there is no transmission of sound downstream the secondary source.
This technique has already been mentioned previously, and could be called active impedance control.3 There are other works in which its results show that the net effect of the secondary loudspeakers consists of causing acoustic reflection. However, this effect has not been explicitly identified in this way.4 - 6
In order to decrease the sound pressure level at the transmission suface, local active control strategies are followed, because it is not necessary to reach a large area of attenuation. Our main objective is to achieve local attenuation at the window surface without any significative increase of sound pressure level in other areas of the enclosure.
Local active noise control
If sound pressure is cancelled in x0 by means of a secondary source inside a room with diffuse sound field
conditions, and the cancellation point is far from the secondary and the primary source, it is proved that the zone of quiet, within which the pressure is at least 10 dB below that due to the primary source, is a sphere with a diameter of about one-tenth of a wavelength7. On the other hand, it has been found that the space-averaged squared pressure in rooms with active control is higher than the value with only the primary field in operation.
A procedure to avoid that sound pressure level increases inside the room, consists of placing a secondary source next to the error microphone, so that the cancellation point is within the direct field of the secondary source. In this way the sound power level of the secondary source is low, compared to the primary source, and its contribution to the acoustic field amplitude in remote areas can be insignificant. This strategy is known as local active noise control. However, if the source is placed very near the error microphone, the diameter of the zone of quiet around the cancellation point tends to diminish.8
EXPERIMENTAL SET-UP
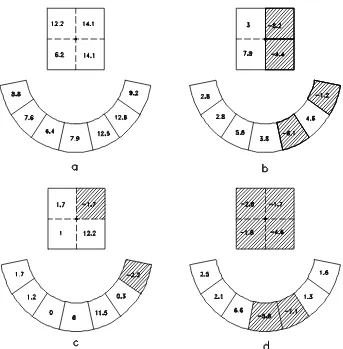
The experimental device is shown in figure 1 and 2, and it is composed by an enclosure with dimensions 1.2 x 1.5 x 1.1 metres. In a wall of the enclosure, there is an aperture of 0.3 x 0.3 metres, where it is intended to carry out the acoustic impedance control, and to avoid noise transmission from the interior of the enclosure to the exterior. This enclosure is placed inside a laboratory.
[image:2.596.164.433.521.725.2]Primary noise is generated by a primary loudspeaker placed inside the enclosure at the furthest corner from the window, in order to excite the highest number of modes of the enclosure. The secondary source is a loudspeaker with a radius of 6 cm and the active noise control system is a typical DSP with a feedforward structure with an adaptive control using the FXLMS algorithm. The reference signal is picked up straight from the function generator to avoid potential feedback contamination.
RESULTS
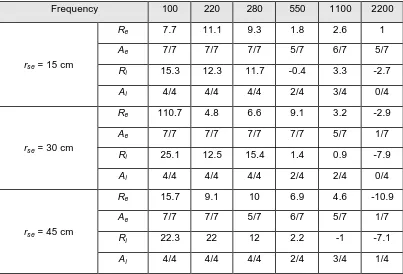
The experiences have been developed for pure tone sounds at frequencies between 100 and 2200 Hz, and with distances between secondary source and error microphone of rse equals 15, 30 and 45 cm. Ri and Re
are defined as the space attenuation average of the microphones which were on the window and those placed outside the enclosure, respectively. Aiand Ae are the points were attenuation after control is detected,
excluding the error microphone. Results of the experiences can be resumed in table 1. Negative values means increases of noise level.
From the results, it is easily observed how the tendency is the same for space averaged attenuations in window and outside the window, therefore the theory about acoustic impedance control as a method to avoid noise transmission by a specific boundary is confirmed. It can also be seen as the zone of quiet in the window tends, in general, to diminish as frequency increases.
Frequency 100 220 280 550 1100 2200
Re 7.7 11.1 9.3 1.8 2.6 1
Ae 7/7 7/7 7/7 5/7 6/7 5/7
Ri 15.3 12.3 11.7 -0.4 3.3 -2.7
rse = 15 cm
Ai 4/4 4/4 4/4 2/4 3/4 0/4
Re 110.7 4.8 6.6 9.1 3.2 -2.9
Ae 7/7 7/7 7/7 7/7 5/7 1/7
Ri 25.1 12.5 15.4 1.4 0.9 -7.9
rse = 30 cm
Ai 4/4 4/4 4/4 2/4 2/4 0/4
Re 15.7 9.1 10 6.9 4.6 -10.9
Ae 7/7 7/7 5/7 6/7 5/7 1/7
Ri 22.3 22 12 2.2 -1 -7.1
rse = 45 cm
[image:3.596.96.499.325.599.2]Ai 4/4 4/4 4/4 2/4 3/4 1/4
Table 1. Space average attenuation at window and outside the window.
The relationship between attenuation and rse shows how, broadly speaking, at low frequencies, attenuation
increases as rse increases too. Nevertheless, at high frequencies, attenuation tends to diminish as rse
Figure 2. Location of the sound sources and control microphones.
[image:4.596.141.484.362.711.2]In an attempt to increase the extent of the zone of quiet, the pressure is cancelled at two points, which are separated by a distance less than 0.25λ. In this case, the zone of quiet is increased to an ellipsoid whose longest diameter is about a half of a wavelength.9 The experience was carried out at 550 Hz and with a distance rse equals 15 cm. The results are resumed in table 2, and it is shown how the extent of the zone of
attenuation are increased, compared to results obtained with one error microphone.
Re Ae Ri Ai
One error mic. 1.8 5/7 -0.4 1/4
[image:5.596.106.490.154.217.2]Two error mic. 5.8 5/7 14.5 3/3
Table 2. Results at 550 Hz for one and two error microphones.
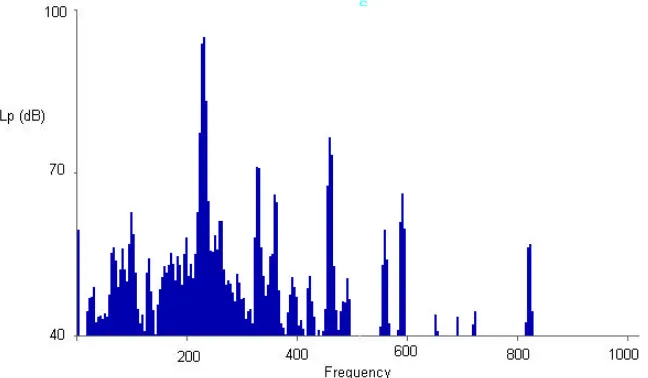
Eventually, experiences were carried out with a electric motor as the primary source, which main frequency emission was 220 Hz (Fig. 4). The reference signal was picked up straight from an accelerometer, placed on motor, and one error microphone was used, with rse equals 15 cm. Results were Re equals 10.1 and Ri
equals 6.2, with attenuation detected in all the control microphones. Results were not as good as in case of loudspeaker as a primary source, but it was becuase motor noise level was lower than loudspeaker sound level, and the reduction could not be as high as with the loudspeaker as a primary source.
However this last experience showed how the strategie of active impedance control is able to work properly with noise caused by machinery.
Figure 4. Noise spectrum of the electric motor.
CONCLUSIONS
As foremost conclusion, it is proved that sound pressure cancellation at the window implies emission attenuation through itself. The use of local techniques of active noise control allows the optimization of the attenuation area without causing significant increases in other areas of the enclosure. In the studied case it is confirmed that as the secondary source is approached to the error microphone, results tend to be worse due to the reduction of the zone of quiet.
[image:5.596.134.458.356.545.2]ACKNOWLEDGMENTS
This work has been carried out by the surpport of the Ministerio de Educación y Cultura, through the CICYT.