SLOW DYNAMICS EXPERIMENTS ON THIN SHEETS
E. Mfoumou, K. Haller, C. Hedberg, and S. Kao-Walter
Blekinge Institute of Technology, Department of Mechanical Engineering, 371 79 Karlskrona, Sweden
(emf@bth.se, khl@bth.se, che@bth.se, skw@bth.se)
Abstract
Like many other materials, thin sheets having no bending rigidity exhibit a slow non-equilibrium dynamics. We performed experiments on paperboard (100 µm in thickness) and on a laminate made of paperboard and Low Density Polyethylene (25 µm in thickness), both used in food packaging industries. The investigated samples were rectangular strips clamped at two ends on a tensile test machine. They were loaded at two different strain levels and monitored under constant strain; resonance frequencies were measured for several conditioning cycles of loading. We found that the resonance frequency shifts downward in response to a conditioning strain and the resonant line shape changes with increasing number of cycles due. The results are equivalent to long-time slow dynamics relaxation experiments on solid materials of many types. The conditioning period in our experiment is about one million longer than in typical earlier acoustic conditioning measurement. But, this does not influence the result to any significant degree, as the recovery response is even slower. In addition, these thin sheets have an even larger effect in terms of percentage of resonance frequency shift than rocks, which are known to have a very high degree of slow dynamic recovery. This type of measurement is important for the fundamental understanding of material dynamics.
Keywords: slow dynamics, non-equilibrium dynamics, material relaxation, resonance frequency, thin
sheet, conditioning strain.
1
Introduction
Rocks, concretes, sands, soils, ceramics, and metals with dislocations, and even gels and emulsions, have already been shown to exhibit remarkably similar long term recovery behavior [1-7]. Through various measurements, it was shown that these materials are strongly nonlinear, hysteretic, and having endpoint memory. These properties were referred to as nonlinear mesoscopic elasticity [8].
The work reported here is an examination of the long-time recovery relaxation phenomena and the decrease in resonance frequency with increasing drive strain on thin sheets used in packaging industries. Thin sheets constitute a class of engineering materials with application areas expanding with the continuous engineering process. The casting of paper from wood-pulps, the rolling of metallic foils, and the forming of polymer films and various other composite layered structures are examples of such processes. The uncommon elastic properties of these materials are similar to those observed in geomaterials. The focus of the paper is to show the existence of memory and conditioning effects appearing in thin sheets having no bending rigidity, and also to present the necessary alterations in the experimental approach compared to the ones for regular solid materials.
The paper is organized as follows. First, in section 2 we describe a standard experimental setup. Next, in section 3 we present our samples, principle of measurement, experimental setup, the results and discussion and we conclude in section 4.
2
Standard technique for measuring slow dynamics
2.1 Principle of measurement
So far, most of the slow dynamics have been measured on regular solid materials. The standard technique used to study this nonlinear feature is the resonant bar experiment [1,8-14]. In these experiments, a long rod of the material under test is driven longitudinally and its amplitude and frequency response are monitored. In case of a linear material, the resonance frequency of the rod is invariant over a very wide range of dynamical strain. For a rod made from a nonlinear material, the resonance frequency behaves quite differently: when a driving force is applied to the rod (conditioning), the frequency either increases or decreases (thus hardening or softening the elastic modulus) depending on the precise properties of the material. Following this principle, a long-time recovery and relaxation phenomena was investigated on concrete and different earth materials (see for example [1,13,14)]. The slow dynamics is referred to as the time-dependent recovery of an elastic modulus to its initial value after being softened by a large strain. The measurements consist of observing resonance frequency changes as various conditioning strains are applied and removed.
2.2 Setup and experiment
Long thin bars, suspended at two points and excited at their fundamental longitudinal resonance mode were used. A piezoelectric force transducer cemented between one end of the sample and a massive backload was used as the source. The high impedance backload is used here to ensure that most of the acoustic energy couples into the sample instead of the surrounding environment. Acceleration of the opposite end of the sample was measured with a lightweight accelerometer and processed with a lock-in amplifier referenced to the drivlock-ing signal. The drivlock-ing force was a harmonic acoustic wave, incremented through the fundamental longitudinal wave resonance frequency of the bar. A block diagram of the experimental setup can be found in references [1] and [13].
3
Experiment and configuration for measuring slow dynamics on thin
sheets
3.1 Sample preparation and configuration
Paperboard (PPR) and a laminate made of paperboard and Low Density Polyethylene (LDPE) were used in this study. The lamination was performed in our laboratory using a standard laminating machine, and the specimens obtained using a paper cutter. The geometry of the samples was flat and rectangular. The pictures and properties of the basic layers are shown in Figure 1 and Table 1 below. Prior to the test, the samples were placed in a conditioned environment with 23oC and an atmospheric
humidity of 40% during at least three days.
Figure 1 – Basic layers used in our tests: (a) Specimen shape; (b) Laminate preparation.
Table 1 – Basic layers physical properties.
Material Density (g/cm3) Length (cm) Width (cm) Thickness (µm)
PPR 0.684 250 15 100
LDPE 0.91 250 15 27
3.2 Experimental setup and methodology
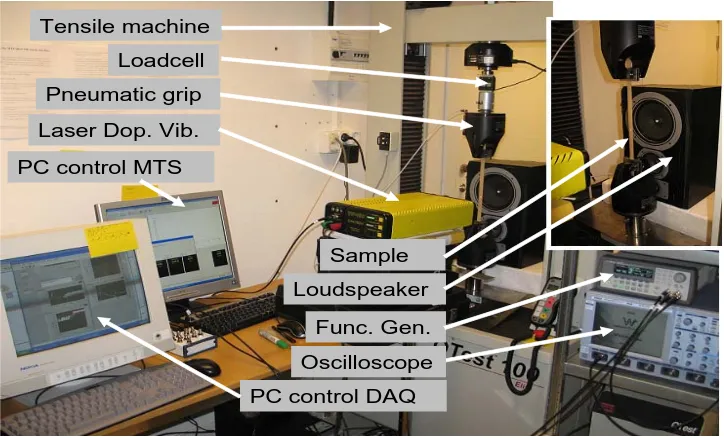
The setup and block diagram of the experimental arrangement are shown in Figures 2 and 3. It includes a function generator (Agilent 33220A), a standard 8Ω loudspeaker used as source for remote excitation of bending vibrations on the samples, an Ometron VS-100 Laser Doppler Vibrometer used as receiver to remotely measure the velocity signal from one point on the sample, one computer equipped with a Data Acquisition card and Labview software for acquiring and processing the data, and a MTS QTest 100 tensile test machine controlled with the software TestWorks. The laser vibrometer used in this study makes high-fidelity measurements of surface displacement over a bandwidth of DC to 50kHz.
The rectangular sheet is held by the rigid clamps of the tensile test machine. The loudspeaker is placed on the back side of the sample exciting transversal vibrations of the sample. The laser vibrometer is placed on the opposite side of the sample, and the laser beam is properly focused on the sample surface. Remote and mass-loading-free vibration measurements on contact sensitive specimens such as the ones used in this study are some of the motivations for considering a laser-based vibration transducer as the natural choice. The Doppler Effect is used here to measure translational vibrations of a single point on the specimen.
Figure 3 – Experimental setup.
Figure 2 – Experimental setup.
Tensile machine
Loadcell
Pneumatic grip
Sample
Loudspeaker Laser Dop. Vib.
Func. Gen.
Oscilloscope PC control MTS
PC control DAQ Tensile machine
Loadcell
Pneumatic grip
Sample
Loudspeaker Laser Dop. Vib.
Func. Gen.
Oscilloscope PC control MTS
PC control DAQ
Figure 3 – Block diagram of our experimental arrangement.
As a membrane has no compression or bending stiffness, our rectangular sheet is put in tension in order to act as a structural element. Therefore, the specimen is slightly loaded within its elastic region just enough to produce bending waves from a periodical acoustic load, and thus can be seen as a membrane with small but non-negligible bending stiffness. The sample is harmonically driven transversally by the loudspeaker, and its amplitude and frequency response is monitored by a laser beam. At the same time, successive conditioning ON (stress cycling at two different strain levels corresponding to an external force) and conditioning OFF (removal of the external force) are applied to the sample through the crosshead of the tensile test machine. The conditioning ON was made of 10 successive longitudinal step perturbations. Each step consisted of first an elongation of 1 mm for 200 seconds, then the elongation went down to 0.6 mm for 200 seconds. The loading and unloading speed was 1mm/s, so that the strain transitions took 0.4 seconds. The total time of conditioning was 10*2*200= 4000 seconds.The conditioning OFF was simply holding the elongation at the 0.6 mm
[image:4.595.192.407.397.556.2]level for 4000 seconds. The data processing setup was adjusted to acquire 20kS at a rate of 15kS/s. All of the measurements were carried out with samples excited in their fundamental bending mode (Young’s mode). Scans of the resonance peak were conducted at constant drive amplitude over a frequency sweep. The conditioning effect on resonance frequency (related to Young’s modulus) was observed, as well as the following time-dependent recovery of the sample. As such, our measurement also consists of observing resonance frequency changes as various conditioning strains are applied and removed.
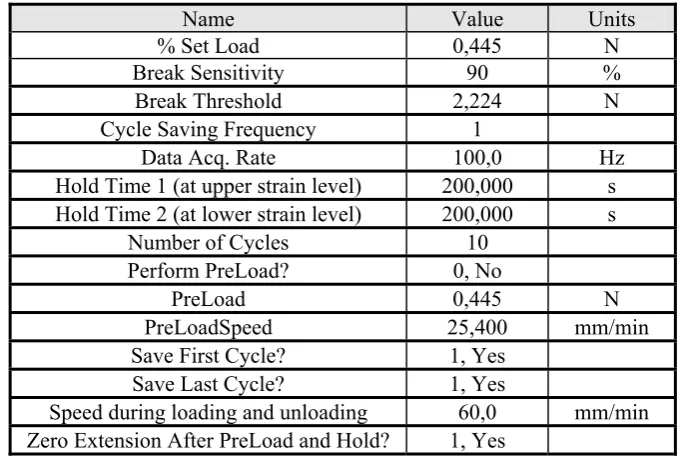
[image:5.595.126.467.255.486.2]Some important test inputs for conditioning (on the tensile machine) are presented in Table 2 below:
Table 2 – Test inputs for the conditioning of the samples
Name Value Units
% Set Load 0,445 N
Break Sensitivity 90 %
Break Threshold 2,224 N
Cycle Saving Frequency 1
Data Acq. Rate 100,0 Hz
Hold Time 1 (at upper strain level) 200,000 s
Hold Time 2 (at lower strain level) 200,000 s
Number of Cycles 10
Perform PreLoad? 0, No
PreLoad 0,445 N
PreLoadSpeed 25,400 mm/min
Save First Cycle? 1, Yes
Save Last Cycle? 1, Yes
Speed during loading and unloading 60,0 mm/min
Zero Extension After PreLoad and Hold? 1, Yes
3.3 Results and discussion
Figure 4(left) shows the strain excitation as well as the resonance frequency response on paperboard. The relaxation process was monitored at upper (0.004mm/mm) and lower (0.0024mm/mm) strain levels for a targeted point, as well as the recovery process at lower strain level, and Figure 4(right) shows the shifts of resonance frequency with time. Our experiments show a similar trend as the one on Berea sandstone by TenCate et al. [1], but ours shows a larger effect in terms of frequency shift.
Figure 4 – Left: Conditioning strain and resonance frequency response of paperboard. The conditioning strain is alternately applied and turned off. Right: Change in resonance frequency in
response to the conditioning strain of approximately 1.6x10⁻³.
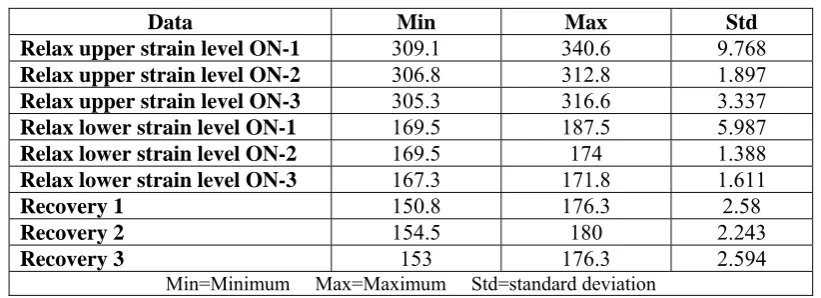
The data statistics from our measurement on paperboard are presented in Table 3 below. Table 3 – Data statistics for the response frequency of the laminate from Figure 4 (left)
Data Min Max Std
Relax upper strain level ON-1 309.1 340.6 9.768
Relax upper strain level ON-2 306.8 312.8 1.897
Relax upper strain level ON-3 305.3 316.6 3.337
Relax lower strain level ON-1 169.5 187.5 5.987
Relax lower strain level ON-2 169.5 174 1.388
Relax lower strain level ON-3 167.3 171.8 1.611
Recovery 1 150.8 176.3 2.58
Recovery 2 154.5 180 2.243
Recovery 3 153 176.3 2.594
Min=Minimum Max=Maximum Std=standard deviation
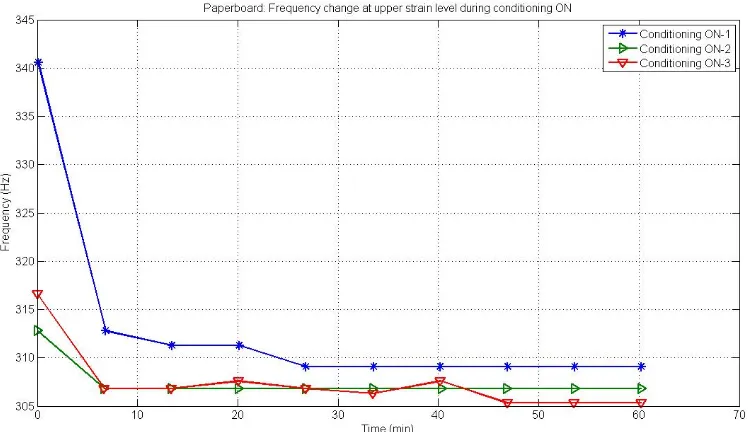
This table reveals that less dispersed results in the frequency measurements are obtained at lower strain level and with increasing conditioning effect on the sample, confirming the conditioning effect on the softening of the resonance frequency. This is clearly illustrated in Figure 5 with the frequency change curves of all three conditionings on top of each other.
[image:6.595.92.503.343.492.2]Figure 5 – Frequency change at all three conditionings ON on top of each other, monitored from upper strain level. The gap between ON-1 and ON-2/ON-3 expresses the softening of the material with total
conditioining time.
Similar results as on paperboard are observed on LDPE/PPR laminate at the same strain levels as illustrated in Figures 6 and 7, and table 4 below.
Figure 6 – Measurements on LDPE/PPR laminate. Left: Conditioning strain and response frequency. Right: Change in resonance frequency in response to a conditioning strain of approximately 1.6x10⁻³.
[image:7.595.89.522.436.562.2]Figure 7 – Frequency change at upper (left) and lower (right) strain level for all conditionings ON, on top of each other. Increased softening is observed from ON-1 to ON-3.
Table 4 – Data statistics for the response frequency of the laminate from Figure 6 (right).
Data Min Max Std
Relax upper strain level ON-1 257.3 270.8 3.941
Relax upper strain level ON-2 257.1 264.8 2.383
Relax upper strain level ON-3 255.1 263.3 2.359
Relax lower strain level ON-1 142.5 163.5 6.796
Relax lower strain level ON-2 133.5 141 2.625
Relax lower strain level ON-3 132 138.8 1.883
Recovery 1 120.8 150.8 3.089
Recovery 2 114.8 144 3.331
Recovery 3 114.8 140.3 2.628
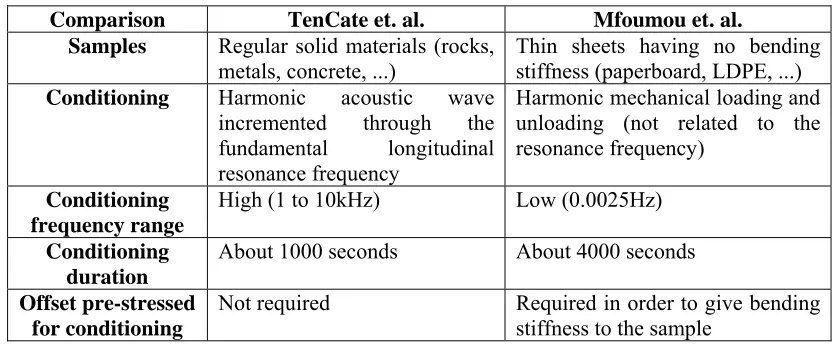
Our experiments also emphasize the process of modulus, or wave speed, recovery that follows its dynamically-driven reduction (softening) by a dynamic forcing. We will for clarification compare our approach and results to the ones obtained by TenCate et al. [1]. In all cases, the samples never fully recovered to their initial stiffness after times of around 15 minutes for Berea sandstone [1] and 70 minutes for PPR and LDPE/PPR (our experiment). Table 5 below summarizes the differences and similarities in the two experiments.
Table 5 – Comparison between our experiment and TenCate’s one.
Comparison TenCate et. al. Mfoumou et. al.
Samples Regular solid materials (rocks,
metals, concrete, ...)
Thin sheets having no bending stiffness (paperboard, LDPE, ...)
Conditioning Harmonic acoustic wave
incremented through the fundamental longitudinal resonance frequency
Harmonic mechanical loading and unloading (not related to the resonance frequency)
Conditioning frequency range
High (1 to 10kHz) Low (0.0025Hz)
Conditioning duration
About 1000 seconds About 4000 seconds
Offset pre-stressed for conditioning
Not required Required in order to give bending
stiffness to the sample
[image:8.595.88.506.570.742.2]Method of investigation Resonance method (longitudinal) Resonance method (bending) Resonance frequency range
Several kilohertz Below 500Hz
Source PZT (contact method) Loudspeaker (non-contact
method)
Receiver (sensing) Accelerometer cemented on
the sample (contact method)
Laser beam (non-contact method)
Featuring observation
Drop in Young’s modulus and increase in material damping
Drop in Young’s modulus.
After stress removal
The material properties recover towards their original values
The material properties recover towards their original values
Process of conditioning and
recovery
Assymetric Assymetric
Overall A retarded effect ressembling
creep appears, which cannot be explained with equilibrium elasticity theory
A similar effect appears here, though much faster, which can also not be explained with equilibrium elasticity theory
4
Conclusions
This work is the first investigation of slow dynamics on thin sheets having no bending stiffness (considered as membranes). The results obtained are qualitatively comparable to those on regular solid materials, though with some necessary alterations of the experimental approach. The basic quantity measured in these experiments is the resonance frequency as a function of time at constant strain after being conditioned by a periodic disturbance. The change in modal frequency reflects the softening of the modulus by a symmetric and oscillatory driving force. Such a symmetric and oscillatory force induces a nonequilibrium dynamics in the sample which cannot be explained by classical elasticity theory. The relaxation takes place over long time scales, which are on the order of the observation time or even longer. The recovery after softening of the modulus never reaches the initial state, illustrating the slow dynamics in the investigated samples. Although the conditioning period is about one million times slower than on regular solid materials [1], the recovery response is even slower. Much better understanding of our material dynamics behaviour may be investigated with new knowledge recently discovered by our group regarding the activation of the slow dynamics effect [13]. This constitutes the bulk of our upcoming investigation on thin sheet having no bending stiffness.
Acknowledgements
We are thankful to the faculty board at Blekinge Institute of Technology and VINNOVA for partial funding of this project. We also thank Mr. Yang Kaï for technical assistance.
References
[1] TenCate, J. A., Smith, E., Byers, L. W., Shankland, T. J., Slow Dynamics Experiments in Solids with Nonlinear Mesoscopic Elasticity, Nonlinear Acoustics at the Turn of the Millenium: ISNA
15, 15th International Symposium. AIP Conference Proceedings, Vol. 524, 2000, pp. 303-306.
[2] Carter, N.L., 1976. Steady state flow of rocks. Review of Geophysics and Space Physics,Vol. 14,
2000, pp. 301-360.
[3] Zener, C. Elasticity and Anelasticity of Metal. The University of Chicago Press, Chicago, 1948.
[4] Swartzenruder, L.J.; Bennett, L.H.; Vajda, F.; and Della Torre, E. Relationship between the Measurement of Accomodation and after-effect, Physica B 233, 1997, pp. 324-329.
[5] Haller, K.C.E., Hedberg, C.M. Sound Velocity Dependence on Strain for Damaged Steel, in
Nonlinear Acoustics - Fundamantals and Applications: ISNA 18 Stockholm, July 2008, edited by B. Enflo,C. Hedberg, L. Kari, AIP Conference Proceedings Vol. 1022 (American Institute of Physics, Melville, New York, 2008)
[6] Ramos, L., and Cipelletti, L. Ultraslow Dynamics and Stress Relaxation in the Aging of a Soft Glassy System, Phys. Rev. Lett. 87, 245503 (2001)
[7] Cipelletti, L., Ramos, L., Manley, S., Pitard, E., Weitz, D.A., Pashkovski, E.E., and Johansson, M.
Universal Non-Diffusive Slow Dynamics in Aging Soft Matter, Faraday Discuss., 123, 237-251
(2003).
[8] Guyer, R.; Johnson, P. Nonlinear Mesoscopic Elasticity: Evidence for a New Class of Materials.
Physics Today 52, 30-37 (1999).
[9] Clark, S. P. Handbook of Physical Constants. Geophys. Soc. Of Am., New York, 1966.
[10]Jaeger, J. C., and Cook, N. G. W. Fundamentals of Rock Mechanics. CRC Press, Boca Raton, Fla,
1979.
[11]Carmichael, R. S. CRC Handbook of Physical Properties of Rocks. CRC Press, Boca Raton, Fla,
1984.
[12]Bourbie, T., Coussy, O., and Zinszner, B. Acoustic of Porous Media. Gulf, Houston, Tex., 1987.
[13]Haller, K.C.E, and Hedberg, C.M. Constant Strain Frequency Sweep Measurements on Granite Rock, Physical Review Letters 100(6), 068501, 2008.