PhD Thesis
APPLICATION OF DISCRETE-EVENT SIMULATION TO
HEALTH SERVICES RESEARCH: ANALYSIS OF NEEDS
AND DEMAND FOR ELECTIVE SURGERY
PhD Student
Mercè Comas Serrano
PhD Advisors
Xavier Castells OIiveres (Institut Municipal d’Assistència Sanitària-IMAS; Universitat Autònoma de Barcelona-UAB)
Jaume Barceló Bugeda (Universitat Politècnica de Catalunya-UPC)
Doctorate in Technical and Computer Applications of Statistics, Operational Research and Optimization
Universitat Politècnica de Catalunya-UPC
Dedicat a la meva mare,
a la memòria del meu pare
i al Diego
“All models are wrong,
but some are useful”
Acknowledgements
Vull mostrar el meu agraïment a totes aquelles persones que m’han acompanyat aquests darrers anys i que han vist com aquesta tesi anava prenent forma. A alguns els haig d’agrair un munt d’hores de treball, a d’altres, potser només que m’hagin escoltat. Gràcies als que m’han llegit, per les seves correccions. Als que m’han aconsellat, per ajudar-me amb una simple paraula. Als que m’han cedit dades, perquè sense elles no podem parlar d’”aplicacions”. Als que m’han tret a passejar, per ajudar-me a desconnectar. Als que m’han posat un plat a taula, per deixar-me més temps per mi. Als que ja no hi són, per haver-hi estat. Als optimistes, per veure un final feliç. Als pessimistes, perquè, malgrat tot, un dubte sempre precedeix a una millora. Als amics, per ser-ho.
Podria fer una llarga llista de noms de les persones que, en un moment o altre, han participat en aquest projecte, però no em vull deixar ningú, i vosaltres ja sabeu qui sou. Podría hacer una larga lista de nombres de las personas que, en un momento u otro, han participado en este proyecto, pero no me quiero dejar a nadie, y vosotros ya sabéis quienes sois. I could write a long list with the names of the people who have participated in this project, but I don’t want to miss anyone, and you would know if I’m talking about you. Tanmateix, vull destacar especialment la feina feta pel Rubén Román, sense ell, l’abast i la correcció del treball no haguéssin estat els mateixos. L’aportació de la Lorena Hoffmeister també va ser important en molts aspectes, alguns dels quals és difícil plasmar en un paper, así como las dosis de asertividad de Javier Mar, que han sido un impulso importante en muchos momentos.
Vull agrair el dia a dia als companys del SAEC, especialment als que fa 10 anys que saben a quines hores tinc gana, però també a les noves incorporacions, els que ja han marxat, els “meus residents petits”... També al José Miguel Martínez, per tantes converses interessants i pels seus consells, especialment en aquesta fase final d’elaboració de la tesi.
Al Jaume Barceló li haig d’agrair d’haver-me empès a acabar el projecte final de carrera de la llicenciatura i fer-me caure en el doctorat sense donar-me temps a reaccionar. Han estat uns anys de bogeria, però ha valgut la pena.
Aquesta tesi ha rebut els ajuts per a finalització de tesis doctorals de la Universitat Politècnica de Catalunya i de l’Institut Municipal d’Investigació Mèdica (IMIM-Hospital del Mar).
Index
Chapter 0: Abstract ... 1
Chapter 1: Introduction... 3
1.1: The research project ... 3
1.2: Discrete-event simulation vs. Markov models ... 4
1.3: Importance of analyzing the cataract burden through simulation ... 6
1.4: Discrete-event simulation in health services research... 8
1.5: Objectives ... 10
1.6: Structure of the thesis ... 11
Chapter 2: Methodology ... 13
2.1: Introduction to discrete-event simulation ... 13
2.2: Methods ... 14
2.2.1: Definition of the conceptual model ... 14
2.2.2: Parameter estimation ... 20
2.3: Techniques... 46
2.3.1: General comments on the simulation model ... 46
2.3.2: Model implementation ... 47
2.4: Verification and Validation ... 65
2.4.1: Sensitivity analysis on the variability of the estimated parameters ... 66
Chapter 3: Results... 73
3.1: Verification and Validation ... 73
3.1.1: Verification of inputs ... 73
3.1.2: Validity of outputs ... 74
3.2: Analysis of the prioritization system... 83
3.2.1: Current scenario ... 83
3.2.2: Sensitivity analysis on waiting time ... 88
3.3: Needs assessment ... 90
3.4: Transferability of the methodology... 92
3.4.1: Analysis of the variations among Spanish Regions ... 92
3.4.2: Application to needs and demand for knee arthroplasty ... 95
Chapter 4: Discussion ... 101
4.1: Methodological contribution ... 101
4.2: Interpretation of results ... 103
4.2.1: Prioritization system ... 103
4.2.2: Needs assessment ... 105
4.3: Limitations ... 107
Chapter 5: Conclusions ... 109
Chapter 6: Bibliography... 111
Chapter 7: Publications derived from the thesis... 119
7.1: Articles in international journals ... 119
7.2: Articles in national journals ... 119
7.3: Oral communications in international conferences ... 120
7.4: Oral communications in national conferences ... 120
7.5: Poster presentations in international conferences... 122
Index of figures
Figure 2.1: Basic representation. ... 15
Figure 2.2: Representation of the model adding the exit event ‘Dead’. ... 16
Figure 2.3: Model flow chart separating first and second surgery... 16
Figure 2.4: Final conceptual model (including ‘Private Sector’). ... 17
Figure 2.5: Histogram of age by sex, population 50 years or older, Catalonia 2001. ... 29
Figure 2.6: Age distribution of projected prevalent cases, by sex... 32
Figure 2.7: Mortality rate by age and sex, Catalonia 2001. ... 33
Figure 2.8: Observed and adjusted instantaneous mortality rate by age and gender, Catalonia 2001... 34
Figure 2.9: Observed and estimated prevalence of need of cataract surgery by age and sex, NLES... 36
Figure 2.10: Estimated yearly incidence of need for cataract surgery and 95% Confidence Interval by age and sex (NLES)... 36
Figure 2.11: Flow chart of the selection of cases of cataract surgery, CMBD/AH Catalonia 1999-2003... 37
Figure 2.12: Number of cataract extractions (age≥50) overall and by sector (public/private), CMBD/AH, Catalonia, 1999-2003... 38
Figure 2.13: Observed data and adjusted model for the number of cataract extractions per month, CMBD/AH, Catalonia, 1999-2003... 38
Figure 2.14: Predicted number of interventions before and after December 2003... 39
Figure 2.15: Identification of first- and second-eye surgeries. ... 40
Figure 2.16: Observed and adjusted values for the probability of second-eye surgery (source: CMBD/AH, Catalonia 1999-2002). ... 41
Figure 2.17: Logarithmic-increasing function for the probability of second-eye surgery. Predicted values for a 5-year horizon... 42
Figure 2.18: Priority score distribution according to type of patient (bilateral, aphakic), CAHTAR’s pilot test. ... 45
Figure 2.19: Increase in priority score after a mean waiting of 7 months. ... 46
Figure 2.20: Model in SIMUL8 for cataract surgery. ... 48
Figure 2.21: Excel workbook for input and output information: input sheets. ... 49
Figure 2.22: Excel workbook for input and output information: some output sheets. ... 49
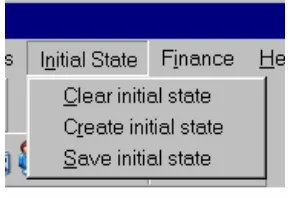
Figure 2.23: Contents of menu ‘Initial State’. ... 51
Figure 2.24: ‘Clear initial state’ dialog. ... 52
Figure 2.25: ‘Create initial state’ dialog. ... 52
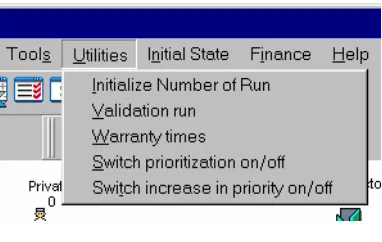
Figure 2.27: Contents of menu ‘Utilities’. ... 61
Figure 2.28: Dialog for ‘Initialize Number of Run’... 61
Figure 2.29: Dialog for ‘Validation run’. ... 62
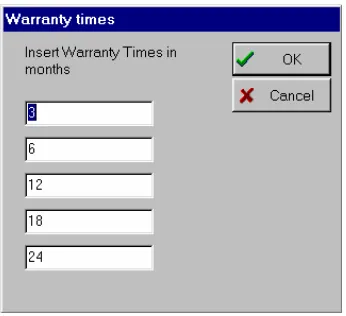
Figure 2.30: Dialog for ‘Warranty times’... 62
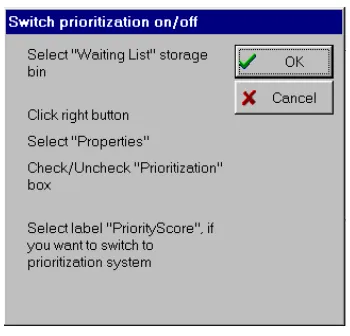
Figure 2.31: Dialog for ‘Switch prioritization on/off’... 63
Figure 2.32: Dialog for ‘Switch increase in priority on/off’. ... 63
Figure 2.33: Message box to notify the end of the trial. ... 63
Figure 2.34: Central value and 95% confidence interval for mortality hazard by sex. ... 71
Figure 2.35: Central value and 95% confidence interval for the number of surgeries through the simulation horizon... 71
Figure 2.36: Central value and 95% confidence interval for the probability of second-eye surgery through the simulation horizon. ... 71
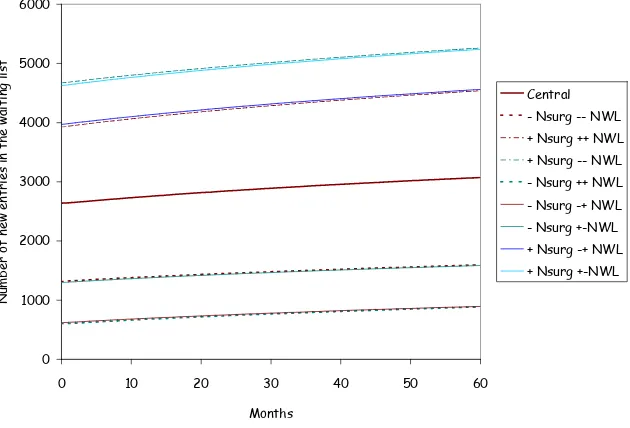
Figure 2.37: Central value and 95% confidence interval for the number of entries to the waiting list through the simulation horizon. ... 72
Figure 3.1: Distribution of age by sex, results per patient of a 5-year simulation. ... 73
Figure 3.2: Priority scores (at entry to the waiting list) for 1st and 2nd eye surgery. Five-year simulation results per eye of individuals entered to the waiting list... 74
Figure 3.3: Relationship between the priority scores (at entry to the waiting list) for 1st and 2nd eye surgery within patient. Five-year simulation results paired by patient. ... 74
Figure 3.4: Waiting time distributions, by waiting list discipline... 77
Figure 3.5: Comparison between waiting time distributions by waiting list discipline. ... 77
Figure 3.6: Relationship between priority score and waiting time, by waiting list discipline. ... 78
Figure 3.7: Comparison of the relationship between priority score and waiting time, by waiting list discipline... 78
Figure 3.8: Five-year evolution of the population with need for cataract surgery. ... 84
Figure 3.9: Priority score thresholds, and 95% confidence interval, to achieve several warranty times (prioritization system)... 86
Figure 3.10: Evolution through the time horizon of the priority score of the patients currently included in the waiting list, by waiting list discipline. ... 87
Figure 3.11: Evolution through the time horizon of the proportion of patients waiting for second-eye surgery currently included in the waiting list, by waiting list discipline... 87
Figure 3.12: Benefit of introducing the Prioritization System by raw time of operated patients under the FIFO (first-in, first-out) system... 89
Figure 3.13: Minimum priority score (x-axis) to achieve an eventual warranty time (y-axis). .... 89
Figure 3.14: Five-year evolution of prevalence of need for surgery, divided by category and by different visual acuity thresholds for indication criteria. ... 91
Figure 3.15: Minimum priority scores for warranty times. ... 95
Figure 3.16: Conceptual model for need and demand for knee arthroplasty... 96
Table 3.14: Summary of estimated parameters for the knee arthroplasty model. ... 97
Index of tables
Table 2.1: Distribution of Catalan population 50 years or older, by sex (year 2001). ... 29
Table 2.2: Prevalence of need for cataract surgery by age and sex, NLES. ... 30
Table 2.3: Prevalence by age, sex and group of need, NLES. ... 31
Table 2.4: Distribution of prevalent cases, by sex (projected on Catalan population, year 2001). ... 31
Table 2.5: Initial numbers of cases classified as ‘Non Expressed Need’. ... 32
Table 2.6: Coefficients for the Gompertz models for the instantaneous mortality rate... 33
Table 2.7: Prevalence and five-year incidence of need for cataract surgery by age and sex, NLES... 34
Table 2.8: Adjusted logistic model parameters for prevalence by age and sex, NLES... 35
Table 2.9: Estimated parameters of the logarithmic model (equation 2.12) for the monthly number of cataract surgeries, CMBD/AH, Catalonia, 1999-2003. ... 39
Table 2.10: Estimates of the coefficients for the logarithmic model for the probability of second-eye surgery (equation 2.14)... 41
Table 2.11: Reduction factor and percentage of reduction according to number of patients exceeding the maximum permitted for the waiting list... 43
Table 2.12: Distribution (%) at inclusion on a waiting list according to ‘type’ of patient, CAHTAR’s pilot test. ... 44
Table 2.13: Proportion of bilateral and aphakic cases in the waiting list, CAHTAR’s pilot test.. 44
Table 2.14: Priority score according to ‘type’ of patient, CAHTAR’s pilot test... 44
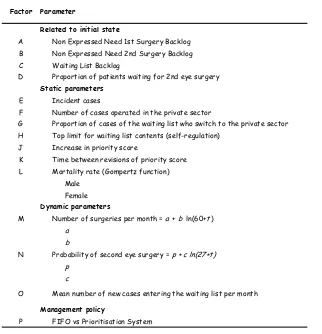
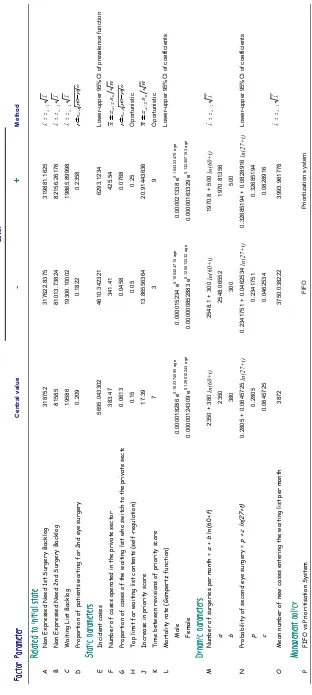
Table 2.15: Definition of factors for sensitivity analysis... 66
Table 2.16: Definition of response variables for sensitivity analysis ... 67
Table 2.18: Levels for sensitivity analysis. ... 70
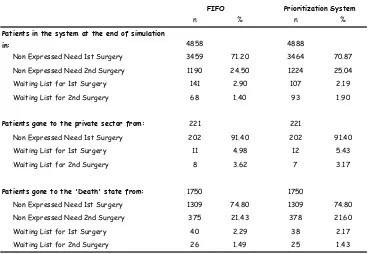
Table 3.1: Distribution of patients at the end of the simulation and origin of patients that left the system not by surgery in the public sector. ... 75
Table 3.2: Number of surgeries performed during the 5-year simulation... 76
Table 3.3: Descriptives of waiting time, by waiting list discipline... 76
Table 3.4: Percentiles of the waiting time distribution, by waiting list discipline... 76
Table 3.5: Descriptives of the priority score (at entry to the waiting list) of cases operated under both waiting list disciplines. ... 78
Table 3.6: Results of the sensitivity analysis (p_values and confounding structure for 2-factor interactions). ... 81
Table 3.7: Magnitude of the effects (statistically significant effects in bold)... 82
Table 3.9: Percentiles of the waiting time distribution, by waiting list discipline... 85
Table 3.10: Sensitivity analysis of raw and weighted waiting times by waiting list discipline and
scenarios of raw waiting time of operated cases and paired differences between disciplines. ... 88
Table 3.11: Visual acuity distribution among population with prevalence of need defined
according to different criteria for visual acuity. Data source: North London Eye Study (n=1,425). ... 92
Table 3.12: Descriptive information on senile cataracts in the autonomous regions studied. ... 93
Table 3.13: Raw waiting times (FIFO) and times weighted by priority score (prioritization
system). ... 94
Table 3.15: Raw and weighted waiting times of patients included in the waiting list stratified by
Index of Appendices
Appendix 1: Prioritization forms... 125
1.1: Prioritization form for cataract surgery ... 126
1.2: Prioritization form for knee and hip arthroplasty ... 128
Appendix 2: Articles derived from this thesis ... 131
2.1: Determining the lifetime density function using a continuous approach... 132
2.2: Time-trend and variations in the proportion of second-eye cataract surgery ... 135
2.3: Discrete-event simulation applied to analysis of waiting lists. Evaluation of a prioritization system for cataract surgery... 145
2.4: Unmet needs for cataract surgery in Spain according to indication criteria. Evaluation through a simulation model... 157
2.5: Geographical variations in the benefit of applying a prioritization system for cataract surgery in different regions of Spain ... 175
Appendix 3: Visual logic codes... 197
3.1: System initialization ... 197
3.1.1: Clear initial state ... 197
3.1.2: Create initial state ... 197
3.1.3: Save initial state... 197
3.2: In objects... 198
3.2.1: Incident cases... 198
3.2.2: Demand ... 199
3.2.3: Surgery ... 200
3.2.4: Private... 203
3.2.5: Dying... 205
3.3: Reset... 206
3.3.1: Before reset ... 206
3.3.2: On reset ... 207
3.4: Time checks ... 211
3.4.1: Update of dynamic inputs ... 211
3.4.2: Priority score and contents of the queues through time ... 212
3.4.3: Proportion of cases waiting for second eye surgery through time ... 212
3.5: End run... 213
3.6: End trial ... 231
Chapter 0: Abstract
Computer simulation techniques have allowed the introduction of modeling methodologies that analyze complex systems through virtual experimentation to assess the potential impact of interventions on health services. Discrete-event simulation is a well-known technique in operations research, and has mainly been developed in the context of military research and manufacturing systems. In the medical setting, Markov models and decision trees have been extensively used despite their limitations in reproducing healthcare problems accurately. Discrete-event simulation is gaining popularity because of its flexibility in representing real systems by taking into account patient characteristics and the scarcity of resources present in health services provision. This technique has been used to analyze problems related to healthcare resource management, but its possibilities to analyze larger problems related to population dynamics have been hardly explored. Traditionally, needs and demand for health services have been analyzed separately. In the present application, the response of the health system to both the population with need for surgery and to the patients included on a waiting list was analyzed.
In this sense, the main contribution of this thesis is the application of discrete-event simulation to health services research from an epidemiologic point of view. Moreover, the model was statistically complex because the variety of sources and characteristics of data defining the main inputs and rules of the modeled system asked for a specific ad hoc methodology to collect and process them to generate the inputs that the simulation model needs. Therefore a relevant part of this work has been devoted to develop such input data analysis methodology.
A discrete-event simulation model was built for needs and demand for cataract surgery in the Catalan public sector. The model reproduced the process of cataract surgery, from incidence of need for surgery, through demand, inclusion on a waiting list and surgery. The input data analysis methodology was described in detail. The model’s parameters were estimated from several sources, including administrative and research databases.
of Spain). Then, results of the model were used to analyze geographical variations of the impact of introducing a waiting list prioritization system. Moreover, information of the different regions was combined to use the model to assess the volume of need for cataract surgery in Spain according to different indication criteria for surgery. Transferability of the methodology to other elective surgeries was assessed by adapting the model to analyze needs and demand for knee replacement in Spain.
Chapter 1: Introduction
1.1: The research project
The present thesis was enclosed within a broader research project in the context of health services research. The name of the research project is “Definition of a model to estimate demand and waiting time for elective surgery: cataract surgery and knee and hip arthroplasty”. It
had funding from Agència d’Avaluació de Tecnologia Mèdica-AATRM (Catalan Agency of Health Technology Assessment and Research-CAHTAR), and from Fondo de Investigación Sanitaria-FIS (Health Care Research Fund), not only as a research project, but also within the research networks RedIRYSS (Spanish Network on Health Outcomes and Health Services Research) and RCESP (Epidemiology and Public Health Cooperative Network). Scientifically, RedIRYSS was focused on waiting lists for elective surgery and one of the research lines of RedIRYSS concerned analysis of needs and estimation of demand.
The principal investigator was Xavier Castells, from Institut Municipal d’Assistència Sanitària-IMAS (Municipal Institute of Health Care, Barcelona). The research team was composed by: Mercè Comas, Rubén Román, Lorena Hoffmeister, Francesc Cots, from IMAS; Mireia Espallargues, from AATRM; José Luís Pinto, from Universitat Pompeu Fabra-UPF; Javier Mar, from Hospital Alto Deba (Mondragón, Basque Country); Santiago Gutiérrez-Moreno, from Servicio de Planificación y Evaluación (Canary Islands); Enrique Bernal, from Instituto Aragonés de Ciencias de la Salud (Aragon); Alberto Jiménez-Puente, from Hospital Costa del Sol (Andalusia); and Darwin Minassian and Angela Reidy, from Institute of Ophthalmology (London). The research team was multidisciplinary as it included epidemiologists, statisticians, economists, sociologists, and also had collaborations of ophthalmologists and traumatologists.
available for utilization of elective surgery and waiting lists, the evidence on need for surgery is scarce and comes from specific research settings.
Study of needs and demand for health services is important since substantial unmet needs are observed. The gap between needs and services provision may be too great to be resolved, but models that assess the impact of changes in the amount of resources used or the impact of health policies on the management of need and demand are useful in decision-making[1].
The main objective of this thesis is to assist quantitatively the decision making process related to needs and demand for cataract surgery and knee arthroplasty. Quantitative decision making is based on the use of models of the systems on which decisions have to be made, Markovian models have been primarily proposed for the systems object of this thesis but, to be analytically tractable they have to rely on simplifications that severely limit their usefulness. Discrete-event simulation models appear as an alternative overcoming these drawbacks.
Moreover, the variety of sources and characteristics of data defining the main inputs and rules of the modeled system ask for a specific ad hoc methodology to collect and process it to generate the inputs that the simulation model needs. Therefore a relevant part of our work has been devoted to develop such input data analysis methodology.
1.2: Discrete-event simulation vs. Markov models
Computer simulation techniques have allowed the introduction of modeling methodologies that analyze complex systems through virtual experimentation to be used to assess the impact of complex interventions in health services. Discrete-event simulation is a well-known technique in operations research, and has mainly been developed in the context of military research and manufacturing systems. In the medical setting, Markov models and decision trees have been extensively used despite their limitations in reproducing healthcare problems accurately. Discrete-event simulation is gaining popularity because of its flexibility in representing real systems through time by taking into account patient characteristics and the scarcity of resources present in health services provision[2,3].
Related to (a), when modeling health services, discrete-event simulation is a more flexible technique than Markov models. While in Markov models the system is conceptualized in terms of ‘states’ and the ‘transitions’ among them, in discrete-event simulation the central concept is the occurrence of events. Both can represent changes in patients’ health status: in discrete-event simulation the health status is carried in attributes that change according to the model events, thus, the health status can be continuous or discrete; in Markov models it is represented through discrete states only. Discrete-event simulation has few restrictions and allows transparent representation of the underlying model, enabling all the characteristics of the real system (including facilities and resources) to be represented. Consequently, events may represent several kinds of action or changes. Moreover, although changes in the system are discrete, they occur on a continuous time scale, as each event is scheduled to happen at a time value drawn from a continuous random distribution. In Markov models, time is managed through ‘cycles’, which length should be chosen (months, years …) and they need half-cycle corrections to calculate the results of the model. Queues are a specific tool of discrete-event simulation. In our case, they allowed waiting list management to be modelled, which could not have been done with Markov models. Finally, individual patients (with their individual characteristics) are simulated more straightforward with discrete-event simulation than with Markov models.
Related to (b), the output of discrete-event simulation models is not only survival (or time spent) by state as in Markov models, but also the number of incident cases, population prevalence according to health status variables, and their evolution through the simulation horizon, among others. Moreover, any output of the simulation can be reported at any time during the simulation time horizon, not at the end only, as in Markov models. Additionally, the Markovian assumption is overcome because, by using events instead of states, dependence on prior events or attributes can be included as appropriate. In a Markov model, information prior to the current state is lost because only the current state is taken into account.
1.3:
Importance of analyzing the cataract burden
through simulation
During the last years, most of the rates of utilization in elective surgical interventions have increased in Western countries. This increase is a result from, on one hand, the aging of the population and, on the other hand, the introduction of less invasive technologies, which have decreased surgical risk and, therefore, enlarged indication criteria.[4] This fact applies not only for the elderly, but also for patients presenting a lower level of severity or disability.
Despite the increase of elective surgery rates in most of the European countries, a significant unmet need for surgery and long waiting lists (and times) have been observed, which would imply an unsatisfied demand.[5,6] Waiting lists in elective surgery are a characteristic of the public health services which have a lack of resources to face the increase of need and demand.
Related to needs assessment, special concern should be taken for the definition of need for surgery. A consequence of the widening in indication criteria is the great variations found in the level of visual impairment of the operated patients. Factors such as perceived need, variations in clinical practice or accessibility to health services play an important role in the opportunity of being operated of those patients with appropriate indication.
The concept of need is based on the expected benefit of the health care intervention rather than on disease or risk presence and its severity level.[7] However, the benefit of the intervention may vary according to patient sociodemographic and clinical characteristics. This fact is present in cataract surgery and knee arthroplasty, whose effectiveness has been proved, but its degree of benefit depends on the patients’ characteristics.[8] For instance, the benefit of cataract surgery in two patients with the same visual acuity might be different if one of them presents a higher limitation in performance of daily life activities. This way, expected benefit, need and priority are treated as synonymous concepts. To sum up, a prioritization system based on the expected benefit from surgery allocates patients on a waiting list ordered according to their level of need.
The idea is to establish a function to allow a definition of need and waiting time related to the behavior of the remaining parameters of the model (basically incidence/prevalence for each level of need, the expressed need and the supply capacity). This function would allow obtaining the threshold of need that the system does not have the capacity to supply.
the most frequent surgical procedures in developed and less developed countries, long waiting lists and waiting times are associated with the supply of cataract surgery.
Despite the increase in the rates of cataract surgery in most Western countries[9], there is a significant unmet need for surgery, explained by the widening of indication criteria and the ageing of the population[5]. Some population-based studies that analyze prevalence of cataract surgery[10-15] show that an important proportion (30%) of the population older than 65 would benefit from surgery. These studies found a weak association between waiting list and unmet needs. Several previous experiences have taken advantage of simulation to assess interventions on waiting list management, such as prioritization of patients requesting cataract surgery[16,17], but none from the needs assessment perspective.
In the last few years, the indication criteria for cataract surgery have been widened due to the introduction of less invasive technologies such as phacoemulsification and topical anesthesia, which have decreased surgical risk and improved the benefits of surgery. Thus, the relationship between benefit and risk [18] has been substantially modified. Broadening of the indication criteria has included lowering the threshold for visual acuity from 0.2 to 0.5 or 0.7[4]. However, the latest guidelines for cataract surgery indication[19] widen even more the indication criteria, as they take into account whether the decrease in visual function caused by cataracts influences the patient’s lifestyle, that is, whether the patient’s visual function cannot satisfy the patient’s needs, rather than a threshold for visual acuity.
A consequence of this change in the indication criteria is the wide variation found in the level of visual impairment in operated patients. Factors such as perceived need, variations in clinical practice, and accessibility to health services play an important role in the likelihood of undergoing surgery. Then, substantial differences are found among regions or even among hospitals of the same regions.
would also reduce the gap between demand and the available resources more efficiently, as the people who would receive a higher benefit from surgery will receive it earlier. In Spain, a project has recently been developed to work on prioritization criteria for cataract surgery and knee and hip replacement [25]. The resulting prioritization system includes clinical (severity and prognosis), functional (limitation of activities) and social (need or access to social support) criteria (see appendix 1). Possible scores range between 0 and 100, higher scores representing greater need. Thus, in this system, need and priority are equivalent. A pilot study to assess the introduction of the prioritization system in clinical practice was carried out in Catalonia[26], Andalusia and Aragon[27].
Important geographic variations in the utilization of elective surgery have been observed.[28,29] These geographic variations are explained by differences in supply and, specially, clinical practice. As a consequence, this might express problems in equity to the extent that they do not correspond to differences in need. Needs assessment models, as the one presented here, allow analyzing variations in utilization from a perspective of equity among geographic areas. The goal is to find whether the same waiting time in two geographical areas correspond to different levels of need. In Spain, each regional health system manages its own resources, probably involving substantial variations in resource utilization. The effect of introducing a prioritization system would differ in each region because health systems vary widely in terms of clinical practice and utilization rates. Studying these variations is of special interest within the Spanish health system.
1.4:
Discrete-event simulation in health services
research
Discrete-event simulation is an operations research technique that has been widely used and developed in different disciplines such as military research or manufacturing systems. Its potential has been little exploited in medical research. In health services research, other techniques such as decision trees and Markov chains have been used for cost-effectiveness analyses of new treatments.
The search was performed on November 27th, 2006. Entering the query "discrete-event"[All Fields] AND simulation[All Fields], 128 references were retrieved. Of these, 14 were articles in
which discrete-event simulation was not used (false-positive results of the search), 12 were reviews of methods and 102 were indeed applications of discrete-event simulation. The search was limited to these criteria, as the objective was to see which articles were directly accessible through Medline. An exhaustive search would have included reviewing the references lists of the retrieved articles, and making wider searches with different tools (Google searches, for example). This way, in addition to false-positive results, we would have acknowledged false negative results of the search on Medline only.
Of the 12 articles reviewing methodologies, 7 were focused on methods for pharmacoeconomics or economic evaluations[30-36], 8 included comparisons of discrete-event simulation with Markov models, decision trees or differential equations[30-34,36-38], 3 focused in modelling of systems[39-41] and one of them referred to veterinary medicine[37].
Of the 102 articles using discrete-event simulation as the methodology 67 (65.69%) applied it to epidemiologic or healthcare problems. The remaining articles applied it mainly to veterinary medicine, kinetics or biological models. The applications of discrete-event simulation in healthcare included models for economic evaluation of treatments or health technologies[42-44], planning of resources at different levels[45-49], screening programs[50-52] or transplants[2,53,54], among others; and were applied in specialties such as mental health[42,55], cardiology[43,44], oncology[50,52] or gastreoenterology[51].
Among the articles applying discrete-event simulation, some of them assess needs or demand of health services, focusing on planning of resources. Study of needs and demand for health services is important since substantial unmet needs are observed. The gap between needs and services provision may be too great to be resolved, but models that assess the impact of changes in the amount of resources used or of health policies on the management of need and demand are useful in decision-making[1].
1.5: Objectives
General Objective
To develop the methodology to define a mathematical model to analyze, through simulation, needs and demand of elective surgery related to the patients’ level of need (or priority).
Specific Objectives related to the methodology
1. To choose the appropriate mathematical model to achieve the objectives.
2. To define and describe a general conceptual model for elective surgery and its refinement to fit the model for cataract surgery.
3. To develop an ad hoc methodology to estimate the necessary inputs to implement the model.
4. To describe the application of the technique to the cataract surgery model.
5. To validate the implemented model.
Specific Objectives related to the application
6. To assess the impact of introducing a prioritization system (based on need for surgery) for patients on waiting lists.
7. To estimate the volume of unmet needs for cataract surgery.
8. To verify the transferability of the model for cataract surgery:
8.1. By changing the input data set (assessment of variations in the impact of introducing a prioritization system for cataract surgery waiting lists among different geographic areas).
1.6: Structure of the thesis
Chapter 2: Methodology
2.1: Introduction to discrete-event simulation
Discrete-event simulation methodology is appropriate to model the present problem because of the different reasons outlined in section 1.2, specially the fact that waiting lists should be treated as queues. Moreover, the system’s state changes at discrete instants of time, like transitions in Markovian processes. However, a Markov model for this type of problem would be analytically intractable, as it would have to deal with non poissonian and non homogeneous (i.e., time-dependent) transition probabilities, which will also be affected by queue prioritization. The mechanisms to generate the instants of occurrence of these events upon complex probability distributions -some time-dependent-, are based on Montecarlo processes computationally efficient, and treatment of priorities and their changes through time are also computationally direct.
The first step needed to build the model is a process of observation of the system in order to acquire knowledge about it. This knowledge should be formalized as a conceptual model, including a definition of each component of the model, that is, the events of the process to be studied, the subjects, their attributes and the parameters that should be estimated. The population and setting of the study must be defined, as well as the level of detail or the intended scope of the model.
The third step is to translate the conceptual model into a computational model. Healthcare systems are complex. We were interested in modeling discrete events occurring at any point in time. Although the underlying model is a Markov process, the probabilities governing the transitions among states are not easy to determine. Those related to utilization of surgery are not constant through the time horizon, thus, they are not of the Poisson-type. Moreover, the transition probabilities are derived from complex relationships among several parameters of the model and attributes of the entities (or patients). Consequently, the analytical approach is unfeasible and simulation (stochastic and dynamic) should be chosen to analyze such systems. The event scheduling approach was used to model discrete changes in the system (events) in discrete moments in time. Moreover, in our case, waiting lists are, in fact, queues because patients wait for a scarce resource.
The present thesis develops and presents the methodology to apply the methods and the techniques needed to develop the model to analyze needs and demand for elective surgery. The model is thoroughly described for cataract surgery, however, it includes general issues applicable to most elective surgeries.
2.2: Methods
2.2.1: Definition of the conceptual model
2.2.1.1: Definitions
• Subjects: General population, aged 50 years or older, who have or can develop cataracts
needing surgery. This definition excludes cases operated on both eyes. However, these cases will have to be considered when calculating incidence from prevalence.
• Setting: Needs for the population and demand in the public sector of the regions studied.
• Case definition (cataracts): Visual impairment due to lens opacity.
• Surgery indication criteria: Any lens opacity and visual acuity of 0.5 or less.
• No need: A person has no need for surgery if he or she does not meet indication criteria for
surgery. This includes people without cataracts or people with cataracts having visual acuity better than 0.5, and people presenting bilateral surgery.
• Incidence: We are interested in incidence defined as the moment in which a case that does
not have need for surgery starts to meet indication criteria for surgery.
• Need: A person has need for surgery if he or she presents the pathology and meets
• Non Expressed Need: People presenting need but not included on a waiting list.
• Expressed Need (or Waiting List): We considered that a person having need for
surgery has expressed his/her need if he/she has demanded surgery and, thus, has
been included on a waiting list of the public sector. A given individual can’t enter the waiting list without previously being through Non Expressed Need.
• Demand: The concept of demand was assimilated to the inclusion on a waiting list,
i.e., changing from Non Expressed Need to Expressed Need.
• Use: Surgery performed on patients included in the waiting list.
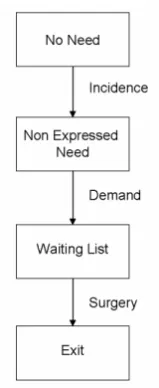
These last four definitions correspond to the basic stages of development and cure of the disease (not considering death). The following representation can be made:
[image:29.595.259.339.294.489.2]
Figure 2.1: Basic representation.
2.2.1.2: Model specification
However, we should translate the model in figure 2.1 to a discrete-event simulation model. Population will be classified into the categories ‘No need’, ‘Non Expressed Need’ and ‘Waiting List’. Changing from one to the other should be represented as events such as ‘Incidence’, ‘Demand’ or ‘Surgery’. In the following section, the basic model shown in figure 2.1 is developed in more detail. Later, each component of the model will be thoroughly defined: the cases included in each category and the events that change this categories.
• Dead: It is an exit event from the system and applies to all cases in the model. The model in
Figure 2.2: Representation of the model adding the exit event ‘Dead’.
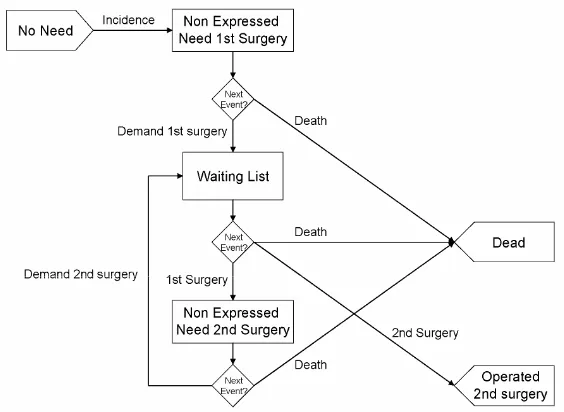
• Second surgery: Because cataracts affect a bilateral organ (eyes) and the eyes are
usually operated on one at a time, the first and the second surgery were differentiated. The ‘Non Expressed Need’ category was divided into ‘Non Expressed Need 1st Surgery’ and ‘Non Expressed Need 2nd Surgery’. The first surgery was considered as the event that changes the patient from being in a waiting list to have need for second-eye surgery (cataract surgery is usually ambulatory). For patients labelled as ‘Non Expressed Need 2nd Surgery’, the event ‘Demand 2nd surgery’ would include them back in the waiting list and they would wait to receive second-eye surgery. Those bilateral cases that never get their second operation will remain in ‘Non Expressed Need 2nd surgery’ until the event ‘Death’. The exit point ‘Operated’ is called now ‘Operated 2nd surgery’ to distinguish that the exit event is second-eye surgery. The reason to be an exit event is that these patients, as they will never have need for cataract surgery again, are no longer of interest in the model (figure 2.3).
• Private Sector: Surgery in the private sector was also considered through the event ‘Demand in the private sector’ leading to the exit point ‘Private Sector’. This event applies to patients who don’t express need in the public sector, but they express it directly in the private sector (thus labelled as ‘Non-Expressed Need 1st Surgery’) and to patients included in a waiting list. It was assumed that a patient switched to the Private Sector to undergo both surgeries, thus, no return to the public sector was considered. It was considered as an exit point for this reason and because our interest focused on the demand in the public sector only (figure 2.4).
Figure 2.4: Final conceptual model (including ‘Private Sector’).
• Levels of Need: The concept of ‘need’ is usually treated as a dichotomous variable:
need (expressed and not expressed), it would not be possible to know the distribution of priority scores for patients in ‘Non Expressed Need’. A function for worsening during wait (increase of the priority score) will be applied, provided that no improvement through time is assumed.
The following is a more detailed description of the cases included in each category and the possible events applying to each one.
• No Need: ‘No Need’ was defined as absence of indication criteria for surgery. It was treated
in the model as the starting point, as ‘Incidence’ represents the event of changing from ‘No Need’ to ‘Need’.
9 Includes: Conceptually, it includes people free of cataracts or having the disease in a
less severe stage than indication criteria. It would also include people operated on both eyes, although we would not take them into account in our model.
9 Possible Events: The event ‘Incidence’ represents changing from ‘No Need’ to ‘Need’.
• Non Expressed Need 1st Surgery: This category concerns those patients with bilateral
disease (they meet indication criteria for surgery) who still have not demanded their first surgery.
9 Includes: Patients with bilateral disease presenting indication criteria for surgery but not
included in the ‘Waiting List’. This is the case of patients who have barriers to access the health care system or patients who do not perceive their need for surgery.
9 Possible Events: The events ‘Death’, ‘Demand 1st surgery’ (in the public sector) and ‘Demand in the private sector’ apply. The ‘Non Expressed Need 1st Surgery’ category is acquired after the event ‘Incidence’.
• Non Expressed Need 2nd Surgery: This category concerns those patients already
operated of the first surgery who still have not demanded their second surgery.
9 Includes: Patients who have undergone their first surgery and still have not demanded
the second one.
9 Possible Events: The event ‘Demand 2nd surgery’ would return the patient to the ‘Waiting List’ to wait for second surgery. In absence of the event ‘Demand 2nd surgery’ (a patient may not demand second surgery for personal choice, for example), only the event ‘Death’ can happen. Those patients that enter the ‘Waiting List’ immediately after receiving the first surgery will spend a short time in ‘Non Expressed Need 2nd Surgery’. This category is acquired after the first surgery only (that is, after being in ‘Waiting List’).
• Waiting List: A patient is classified as ‘Waiting List’ after expressing his/her need for
this category only can receive surgery in the public sector. Patients in ‘Waiting List’ have an additional feature, CAHTAR’s priority score, which will be modified through the time a patient remains in ‘Waiting List’ before surgery.
9 Includes: Patients included in a ‘Waiting List’ for first or second surgery. It is assumed
that indication is always appropriate.
9 Possible Events: The events of entering a ‘Waiting List’ were named as ‘Demand 1st
surgery’ and ‘Demand 2nd surgery’ and are applicable to patients classified as ‘Non Expressed Need 1st Surgery’ and ‘Non Expressed Need 2nd Surgery’, respectively. The events that apply to patients in the ‘Waiting List’ are ‘Death’, ‘Demand in the private sector’, ‘1st surgery’ and ‘2nd surgery’. The ‘Waiting List’ should be treated as a queue then, the strategy to select the patients to be operated (first-in, first-out (FIFO) or the prioritization system) and the supply capacity of the public sector should be taken into account.
• Operated 2nd Surgery: Exit point accessible to patients in the ‘Waiting List’ only, through
the event ‘2nd surgery’. A patient that has had bilateral surgery leaves the system because he/she is no longer of interest for the model.
• Private Sector: Exit point accessible to patients in ‘Non Expressed Need 1st Surgery’ or in
‘Waiting List’ through the event ‘Demand private sector’. It is assumed that patients demanding surgery in the private sector will receive both surgeries and, therefore, will never demand cataract surgery in the public sector again, thus, these patients leave the system.
• Dead: Exit point accessible to all patients through the event ‘Death’.
• Incidence: Event representing the generation of a new case entering the model (from ‘No
Need’ to ‘Non Expressed Need 1st Surgery’).
• Demand: Event representing the entry to a ‘Waiting List’ from ‘Non Expressed Need 1st
Surgery’ (to wait for first surgery) or ‘Non Expressed Need 2nd Surgery’ (to wait for second surgery).
• 1st surgery: Event representing the first surgery in patients waiting at the public sector. The
patients classified as waiting for their first surgery are classified as ‘Non Expressed Need 2nd Surgery’ after this event.
• 2nd surgery: Exit event representing the second surgery in patients waiting at the public
• Demand private sector: Exit event representing the demand for cataract surgery in the private sector. It is applicable to patients classified as ‘Non Expressed Need 1st Surgery’ and ‘Waiting List’. After this event, patients leave the system.
• Death: Exit event applicable to all patients in the model. After this event, patients leave the
system.
2.2.1.3: Model assumptions
The assumptions that will be considered for this conceptual model are summarized below:
(1) Demand, depends on the supply capacity (as the supply increases, entries to the waiting list increase as well).
(2) No differentiation will be made between unilateral and bilateral patients. All incident cases will be considered as bilateral. This assumption is based on the fact that cataract is an age-related pathology and, although the evolution of both eyes might be asymmetrical, a small proportion of cases older than 50 years present it unilaterally.
(3) The simulation time horizon will be small enough to consider that the evolution of the population (in age and gender) and incidence remain constant through the time horizon. (4) When a patient switches to the Private Sector, no return to the public sector is allowed. (5) The level of need does not improve through time, that is, the priority score can increase or
stay the same, but not decrease while no surgery is performed. (6) Indication is always appropriate.
(7) Patients are operated on one eye at a time.
2.2.2: Parameter estimation
2.2.2.1: Patient characteristics
The behavior of each patient inside the system depended on his/her characteristics. It also depended on the characteristics of the rest of patients, because the ‘Waiting List’ is, in fact, a queue: the inputs and outputs of the ‘Waiting List’ followed an order, either by waiting time or by priority score.
• Sex (Male / Female)
• Age
• Type: z= in need; ⊕= operated;{=no need
Need: It is assumed that incident cases have the disease in its bilateral form.9 Bilateral: zz (includes z{ cases).
9 Unilateral (or aphakic): z⊕ (includes {⊕ cases).
No need:9 No cataract cases: {{.
9 Bilateral operated: ⊕⊕ (these cases were not taken into account).
This label is attached to all cases in the model. The cases were classified as follows:
• No Need: {{, ⊕⊕.
• Non Expressed Need 1st Surgery: zz.
• Non Expressed Need 2nd Surgery: z⊕.
• Waiting List: zz, z⊕.
• Priority score (1st/2nd surgery): Level of need for patients in the ‘Waiting List’ waiting for 1st/2nd surgery.
2.2.2.2: Information sources and methods
The following sections include the sources of information and the methods used to calculate each parameter. ‘Initialization’ explains how the initial state of the model was created. ‘Life Expectancy’ relates to the calculation of the distributions of the time to death, that is, the event ‘Death’. ‘Incidence’ relates to the event named ‘Incidence’. ‘Surgery rates’ include both the surgery rates of the public and the private sector (events ‘1st surgery’, ‘2nd surgery’ and ‘Demand private sector’) and the probability of second surgery in the public sector (event ‘Demand 2nd surgery’). ‘Inclusion on a waiting list’ addresses several issues related to the ‘Waiting List’ and the priority score in addition to the event ‘Demand 1st surgery’. ‘Disease progression’ relates to the calculus of the change in priority through time.
Initialization
9 Sources of information: Database of the Catalan population by age and sex from the census of 2001 obtained from IDESCAT (Institut d’Estadística de Catalunya) web page
(http://www.idescat.net). Register of waiting lists in Catalonia, patients waiting at June, 2004, obtained from CatSalut web page (http://www10.gencat.net/catsalut). Database of the North London Eye Study (NLES), a population-based study on prevalence of eye disease in North London[10]. CATHAR’s pilot test of the introduction of the prioritization system in the clinical practice[26].
9 Methods: The distribution according to age and sex of the Catalan population was obtained (Nij, i=50, …,100, j=male, female). Prevalence estimates of bilateral and aphakic cases obtained from NLES data (Pijk, k=bilateral, aphakic,
∑ ∑ ∑
=1i j kPijk ) were projected to the Catalan population (equation 2.1). All calculations were stratified by year of age and sex. The empirical distribution of age conditioned on sex was obtained through projected prevalent cases (nijk).
ijk ij ijk
N
P
n
=
(2.1)=
∑ ∑ ∑
i j kn
ijk Overall Prevalence of NeedThe number of cases classified as ‘Non Expressed Need’ (NEN1 and NEN2, 1
st and 2nd surgery respectively in equation 2.2) was calculated by subtracting the numbers in the waiting list, according to proportions of aphakic and bilateral cases obtained from CATHAR’s pilot test data, from the number of projected prevalent cases (nbilateral and naphakic).
WL
p
n
NEN
WL
p
n
NEN
aphakic aphakic
aphakic bilateral
−
=
−
−
=
2
1
(
1
)
(2.2)
Life expectancy
9 Sources of information: Data on the number of deceased in Catalonia in the year 2001 was obtained from INE (Instituto Nacional de Estadística) web page (http://www.ine.es). Data on
the population census of Catalonia of the year 2001 was obtained from IDESCAT web page.
( )
agee
age
h
=
α
β (2.3)The number of deceased was divided by the volume of population by year of age (from 50 to 95 or more) and sex. Then, two Gompertz models were adjusted to obtain the coefficients
α and β for men and women. According to survival theory, the cumulative hazard function (equation 2.4), the survival function (equation 2.5) and the distribution function (equation 2.6) can be obtained from the hazard function. However, as we wanted to condition lifetime to current age, the integration limits of the cumulative hazard function took current age as the lower bound (equation 2.4). The upper bound was current age plus a time variable which also depended on current age, as it took lower values as current age was higher (tage≥maximum age – age).
( )
[
age t age]
t age age u t age age u t age age
age
h
u
du
e
du
e
e
e
t
H
age age age age β β β ββ
α
β
α
α
⎥
=
−
⎦
⎤
⎢
⎣
⎡
=
=
=
+ + + +∫
∫
( ))
(
(2.4)( )
[
age tage age]
age
e e
t H
age
e
e
t
S
β ββ
α
− − −=
+=
) ( ) ( (2.5)( )
[
[
age tage]
age]
e e
age
age
S
t
e
t
F
β β β α − − +−
=
−
=
1
(
)
1
(2.6)Being age the current age, the cumulative distribution function represents the probability of
dying before tage years of a person age years old. The following step, as shown in appendix 2.1, was to calculate the density function for lifetime by taking derivatives of F(tage). However, for software requirements (the Gompertz distribution was not implemented), a formula was found to create a discrete probability mass function approximating the density function (equation 2.7). To achieve smoothness, the values of the probability mass function were calculated by month, from current age to 105 years (i.e., it doesn’t allow simulated
patients to be 105 years or older). Then the time units were transformed to
12
age age
i
t
=
,)
105
,...(
2
,
1
,
0
1
1
12
1
12
12
12 12 1 12 1 12age
i
e
e
e
e
i
age
F
i
age
F
i
age
f
age e e e e e e e e age age age age age i age age age i age age age i age age age i age−
=
−
=
=
⎥
⎥
⎥
⎥
⎦
⎤
⎢
⎢
⎢
⎢
⎣
⎡
−
−
−
=
=
⎟⎟
⎠
⎞
⎜⎜
⎝
⎛
−
+
−
⎟⎟
⎠
⎞
⎜⎜
⎝
⎛
+
=
⎟⎟
⎠
⎞
⎜⎜
⎝
⎛
+
⎥ ⎥ ⎥ ⎦ ⎤ ⎢ ⎢ ⎢ ⎣ ⎡ − − ⎥ ⎥ ⎥ ⎦ ⎤ ⎢ ⎢ ⎢ ⎣ ⎡ − − ⎥ ⎥ ⎥ ⎦ ⎤ ⎢ ⎢ ⎢ ⎣ ⎡ − − ⎥ ⎥ ⎥ ⎦ ⎤ ⎢ ⎢ ⎢ ⎣ ⎡ − − ⎥ ⎥ ⎦ ⎤ ⎢ ⎢ ⎣ ⎡ + ⎥ ⎥ ⎦ ⎤ ⎢ ⎢ ⎣ ⎡ − + ⎥ ⎥ ⎦ ⎤ ⎢ ⎢ ⎣ ⎡ − + ⎥ ⎥ ⎦ ⎤ ⎢ ⎢ ⎣ ⎡ + β β β β β β β β β α β α β α β α (2.7)By using equation 2.7, a discrete probability function (by month of age) of varying number of values according to current age was obtained. Adjusting a discrete probability function implies that the mortality rate is constant over periods of one month. The density function for lifetime represents the probability of a person aged age years of dying at age age+iage/12 given he/she has survived until age age+(iage-1)/12. Different functions will be adjusted for men and women.
)
There are published studies providing evidence of a higher mortality rate in patients with cataract. One of this studies[63] concludes that women with cataract have higher mortality than women without cataract. The hazard ratio was 1.7 (95% confidence interval from 1.1 to 2.7) for women and 0.9 (95%CI from 0.6 to 1.5) for men. As we estimated the mortality rate for overall population (including cases with cataract), the mortality rate for women was multiplied by 1.5, as less differences were expected between overall population and population with cataracts than between population with and without cataracts.Incidence
9 Sources of information: Raw data on prevalence of cataracts of the North London Eye Study (NLES)[10]. Data on the population census of Catalonia of the year 2001.
constant over the simulation time horizon and that mortality is not different in presence of the disease. Although we have considered a higher mortality rate for women with cataracts, we have applied this method because results are similar to those taking into account the estimation of differential mortality[65]. Due to the irreversibility assumption, prevalence should include operated cases. The formula for groupings of 5 years of age is the following:
i i i i
P
P
P
I
−
−
=
+1
5
,
(2.8)where Iiis the five-year cumulated incidence in age group i, Piis prevalence in age group i and Pi+5is the prevalence in the following five-year older age group. Yearly incidences will be obtained by applying equation (2.8) to the smoothed yearly prevalence obtained by adjusting a logistic model to the observed prevalence. The number of monthly incident cases (NI in equation 2.9) will be obtained by projecting the annual incidence to the Catalan population by age and sex, and dividing the total number by 12. The inverse of this average will be the parameter of an exponential distribution for the time between two incident cases (tI in equation 2.9).
I I
t N I
I
e
N
t
f
1
1
)
(
=
(2.9)Surgery rates
9 Sources of information: Minimum Data Set (CMBD/AH) of the Catalan Health System including cataract extraction procedures (according to ICD9-MC classification) from 1999 through 2003, obtained from the Health Authority. The database structure allowed differentiating public from private sector and identifying bilateral operations between 1999 and 2002. CATHAR’s pilot test of the introduction of the prioritization system in the clinical practice[26].
)
Methods: The inverse of the average number of surgeries per month in the public (NS) and the private sector (NP) were used as the parameters of two exponential distributions for the time between two successive surgeries in each sector (tSand tP in equations 2.10 and 2.11, respectively).S S
t N S
S
e
N
t
f
1
1
)
P P
t N P
P
e
N
t
f
1
1
)
(
=
(2.11)Surgeries in the private sector were applied to patients classified as ‘Non Expressed Need 1st Surgery’ and ‘Waiting List’ (event ‘Demand private sector’ in figure 2.4). The number of surgeries in the public sector was modeled to increase through time by adjusting a linear model to the number of monthly surgeries (equation 2.12) by the logarithmic transformation of time.
)
ln(
)
(
t
0 1t
N
S=
β
S+
β
S (2.12)Predictions using the estimated model were used for the parameter of the exponential distribution of equation 2.10 (NS) through the 60 months following year 2003.
Appendix 2.2[66] includes a detailed description of the following calculations. The 4-year horizon was used to match pairs of 1st and 2nd surgeries of the same patient and to assign a label of 1st or 2nd surgery to the patients with a single operation within those 4 years. The latter assignment was decided according to the time between surgeries of the paired interventions, that is, the waiting time (t) before which 95% of these patients have had
second surgery was taken into account to decide that single surgeries performed t or more
months after January 1999 were considered as first surgeries. This procedure was used in the public sector only. To know the proportion of second surgeries over the total number of operations (in the public sector) through time, the period from t months after January 1999
and further was considered. The probability of undergoing second-eye surgery (p) was
calculated as follows:
q
q
p
−
=
1
(2.13)where q is the proportion of 2nd eye surgeries over the total number of surgeries of the
period. The parameter p was the parameter of a Bernouilli distribution to indicate that the
patient enters again the waiting list for second-eye surgery. Again, a logarithmic model was adjusted to the probability of second-eye surgery through time (equation 2.14).
)
ln(
)
(
t
0 1t
p
=
β
p+
β
p (2.14)from ‘Non Expressed Need 1st Surgery’ was calculated using data from CAHTAR’s pilot test, which contained the reasons for leaving the waiting list.
)
For the event ‘Demand private sector’ from ‘Waiting List’, dependence on the waiting list discipline (on the time spent waiting or on the level of priority) was considered.Inclusion on a waiting list
9 Sources of information: Register of waiting lists in Catalonia, patients entered during the year 2003, obtained from the Health Authority. CATHAR’s pilot test of the introduction of the prioritization system in the clinical practice[26].
9 Methods: The times between successive inclusions in the waiting list (tE) were modeled as an exponential distribution, with a parameter equal to the inverse of the average number of patients entered in the waiting list per month (NE in equation 2.15). As second surgeries are entered to the waiting list after having first eye surgery, the distribution for entries to the waiting list will take into account first eyes only, that is, patients with bilateral disease. The parameter NE was considered to increase through time parallel to the number of surgeries (with a difference of d units, representing both the gap between supply and demand and the
volume of second eyes) and with a delay in time (lag, in equation 2.16, lag≥0). If lag is
greater than 0, the interpretation is that the current number of entries to the waiting list depends on the number of surgeries lag months before.
E E
t N E
E
e
N
t
f
1
1
)
(
=
(2.15)d
t
N
lag
t
d
t
N
E(
)
=
(
β
0S−
)
+
β
1Sln(
−
)
=
S(
−
1
)
−
(2.16))
0
(
)
0
(
=
−
=
=
N
t
N
t
d
S E (2.17)Waiting lists behave in a rather stable way. This leads to think that they have some sort of “self-regulation”. That is, ophthalmologists may indicate more surgeries when they know that the waiting list has reduced or when the surgery supply has increased. However, when this practice leads to an excessive increase of the waiting list volume, they may be required to reduce their number of indications, and then, the waiting list volume would reduce to reach for the previous equilibrium.
Surgery’ or from ‘Non Expressed Need 2nd Surgery’). The function (φ in equation 2.18) starts to be active when a maximum value for the number of patients on the waiting list is reached (MaxWL in equation 2.18). This maximum is defined as a percentage over the starting number of patients in the waiting list (NWL(t=0) in equation 2.18. For example, if the maximum permitted is a 15% more of the initial contents, and the initial contents were 19,586, then the self-regulation of the waiting list will start when its volume exceeds 22,524 patients. The formula used to reduce the entries to the waiting list is shown in equation (2.18).
1
)
0
(
1
)
),
0
(
(
+
−
=
=
=
WL WL
WL WL
Max
t
N
Max
t
N
φ
(2.18)To assign a priority score, the empirical distributions of CATHAR’s pilot test data were used, stratifying by type of patient (bilateral, aphakic). In order to account for correlations between the priority scores of the first and second surgery of the same patient, the priority score for the second surgery of bilateral cases was calculated as a function of the priority score of the first surgery plus a random value sampled from a normal distribution (equation 2.19).
PS2 = ρ * PS1 + ei (2.19)
Where ei ~ N(μ,σ) and ρ can be interpreted as the correlation we want the two priority scores to have. Obviously, scores resulting in values higher than 100 will be assigned a value of 100.
Disease progression
9 Sources of information: Comparison of CATHAR’s priority score of patients included in the waiting lists of Hospital de l’Esperança for cataract surgery: assessments at entering the waiting list and after a period of waiting between 3 and 9 months.