GLYCEMIC INDEX IN THE MANAGEMENT OF OBESITY AND METABOLIC
SYNDROME.
Martí Juanola Falgarona
Dipòsit Legal: T 1610-2015
ADVERTIMENT. L'accés als continguts d'aquesta tesi doctoral i la seva utilització ha de respectar els drets de la persona autora. Pot ser utilitzada per a consulta o estudi personal, així com en activitats o materials d'investigació i docència en els termes establerts a l'art. 32 del Text Refós de la Llei de Propietat Intel·lectual (RDL 1/1996). Per altres utilitzacions es requereix l'autorització prèvia i expressa de la persona autora. En qualsevol cas, en la utilització dels seus continguts caldrà indicar de forma clara el nom i cognoms de la persona autora i el títol de la tesi doctoral. No s'autoritza la seva reproducció o altres formes d'explotació efectuades amb finalitats de lucre ni la seva comunicació pública des d'un lloc aliè al servei TDX. Tampoc s'autoritza la presentació del seu contingut en una finestra o marc aliè a TDX (framing). Aquesta reserva de drets afecta tant als continguts de la tesi com als seus resums i índexs.
ADVERTENCIA. El acceso a los contenidos de esta tesis doctoral y su utilización debe respetar los derechos de la persona autora. Puede ser utilizada para consulta o estudio personal, así como en actividades o materiales de investigación y docencia en los términos establecidos en el art. 32 del Texto Refundido de la Ley de Propiedad Intelectual (RDL 1/1996). Para otros usos se requiere la autorización previa y expresa de la persona autora. En cualquier caso, en la utilización de sus contenidos se deberá indicar de forma clara el nombre y apellidos de la persona autora y el título de la tesis doctoral. No se autoriza su reproducción u otras formas de explotación efectuadas con fines lucrativos ni su comunicación pública desde un sitio ajeno al servicio TDR. Tampoco se autoriza la presentación de su contenido en una ventana o marco ajeno a TDR (framing). Esta reserva de derechos afecta tanto al contenido de la tesis como a sus resúmenes e índices.
Martí Juanola Falgarona
Glycemic index in the management of Obesity and
Metabolic syndrome
THESIS
Thesis supervisors:
Dr. Mònica Bulló and Prof. Jordi Salas-Salvadó
Unitat de Nutrició Humana
Departament de Bioquímica i Biotecnologia
UNIVERSITAT ROVIRA I VIRGILI
Mònica Bulló Bonet, professora Agregada del Departament de Bioquímica i Biotecnologia de la Universitat Rovira i Virgili,
CERTIFICO:
Que aquest treball, titulat “Glycemic index in the management of Obesity and Metabolic
syndrome”, que presenta el Sr. Martí Juanola Falgarona per obtenir el títol de Doctor, ha estat
realitzat sota la meva direcció en el Departament de Bioquímica i Biotecnologia d’aquesta Universitat i que acompleix els requeriments per poder optar a Menció Internacional.
Reus, 03 de Juliol de 2014
La Directora de la Tesis Doctoral,
Dra. Mònica Bulló Bonet Unitat de Nutrició Humana
Jordi Salas-Salvadó, Catedràtic de Nutrició i Bromatologia del Departament de Bioquímica i Biotecnologia de la Universitat Rovira i Virgili,
CERTIFICO:
Que aquest treball, titulat “Glycemic index in the management of Obesity and Metabolic
syndrome”, que presenta el Sr. Martí Juanola Falgarona per obtenir el títol de Doctor, ha estat
realitzat sota la meva direcció en el Departament de Bioquímica i Biotecnologia d’aquesta Universitat i que acompleix els requeriments per poder optar a Menció Internacional.
Reus, 03 de Juliol de 2014
El Codirector de la Tesis Doctoral,
Prof. Jordi Salas-Salvadó Unitat de Nutrició Humana
ABBREBIATIONS
BMI, Body Mass Index
CHD, Coronary Heart Disease
CRP, C-reactive protein
CVD, Cardiovascular Disease
GI, Glycemic index
GL, Glycemic load
HDL, High-density lipoprotein
LCD, Low-calorie diet
LDL, Low-density lipoprotein
MetS, Metabolic syndrome
NHANES, National Health and Nutrition Examination Survey
RCT, Randomized Clinical Trial
RR, Relative Risk
T2DM, Type 2 Diabetes Mellitus
VLCD, Very-low-calorie diet
Index
I. INTRODUCTION . . . 1
1. Overweight and obesity . . . 3
1.1. Prevalence and trends of obesity . . . 3
1.2. Obesity risk factors . . . 6
1.2.1. Non-modifiable factors . . . 6
1.2.1.1. Genetics . . . 6
1.2.1.2. Sex/age/ethnicity . . . 7
1.2.2. Modifiable factors . . . 8
1.2.2.1. Physical Activity . . . 9
1.2.2.2. Tobacco . . . 9
1.2.2.3. Diet . . . 9
1.3. Obesity as a risk factor . . . 13
1.3.1. Hypertension . . . 14
1.3.2. Type 2 diabetes mellitus . . . 14
1.3.3. Cardiovascular Disease . . . 14
1.3.4. Cancer . . . 15
2. Metabolic Syndrome . . . . 15
2.1. Pathology and diagnosis . . . 16
2.2. Prevalence and trends of Metabolic Syndrome . . . 16
2.3. Metabolic Syndrome as a cardiovascular risk factor . . . 18
3. Treatment of Obesity and Metabolic Syndrome . . . . 19
3.1. Surgical treatment . . . 20
3.2. Pharmacological treatment . . . 20
3.3. Lifestyle modification . . . 21
3.3.1. Physical activity . . . 21
3.3.2. Diet . . . 22
3.3.2.2. Hiperproteic diets . . . 26
3.3.2.3. Low-fat vs. low-carbohydrate . . . 27
4. Glycemic index and glycemic load . . . . 28
4.1. Glycemic index . . . 28
4.2. Glycemic load . . . 31
4.3. Epidemiological studies . . . 32
4.4. Clinical trials . . . 34
4.5. Potential mechanisms . . . 35
4.5.1. Substrate Oxidation . . . 35
4.5.2. Satiety . . . 36
4.5.3. Inflammation . . . 37
II. JUSTIFICATION . . . 39
III. HYPOTHESIS . . . . 42
IV. OBJECTIVES . . . . 44
V. METHODOLOGY . . . . 46
1. PREDIMED Study . . . . 46
2. GLYNDIET Study . . . . 52
VI. STUDY POPULATIONS . . . . 55
VII.PUBLICATIONS Publication 1. . . . 57
Design and methods of the GLYNDIET study; assessing the role of glycemic index on weight loss and metabolic risk markers. Martí Juanola-Falgarona, Núria Ibarrola-Jurado, Jordi Salas-Salvadó, Antoni Rabassa-Soler, Mònica Bulló.Nutr Hosp. 2013;28:382-90. Publication 2. . . . 67
Dietary glycemic index/load and peripheral adipokines and inflammatory markers in
elderly subjects at high cardiovascular risk. Mònica Bulló, Rosa Casas, María del Puy
Portillo, Josep Basora, Ramón Estruch, Ana García-Arellano, Arrate Lasa, Martí
Publication 3. . . . . 77
Effect of the glycemic index of the diet on weight loss, modulation of satiety, inflammation and other metabolic risk factors: a randomized controlled trial. Martí Juanola-Falgarona, Jordi Salas-Salvadó, Núria Ibarrola-Jurado, Antoni Rabassa-Soler, Andrés Díaz-López, Marta Guasch-Ferré, Pablo Hernández-Alonso, Rafael Balanza, Mònica Bulló. Am J Clin Nutr. 2014;100:27-35. Publication 4. . . . . 88
Dietary glycemic index and glycemic load are positively associated with risk of developing metabolic syndrome. Martí Juanola-Falgarona, Jordi Salas-Salvadó, Pilar Buil-Cosiales, Dolors Corella, Ramón Estruch, Emili Ros, Montserrat Fitó, Fernando Arós, Enrique Gómez-Gracia, Miquel Fiol, José Lapetra, Rosa Maria Lamuela-Raventós, Lluis Serra-Majem, Xavier Pintó, Miguel Ángel Muñoz, Valentina Ruiz-Gutiérrez, J. Alfredo Martínez, Itandehui Castro-Quezada, Mònica Bulló on behalf of the PREDIMED Study Investigators. VIII.DISCUSSION . . . . 108
IX. CONCLUSIONS . . . . 119
X. REFERENCES . . . . 121
XI. APPENDICES 1. General Medical Questionnaire . . . 177
2. Food Frequency Questionnaire . . . 182
3. 14-Item Mediterranean Diet Adherence Questionnaire . . . 187
4. Physical Activity Questionnaire . . . 189
LIST OF FIGURES
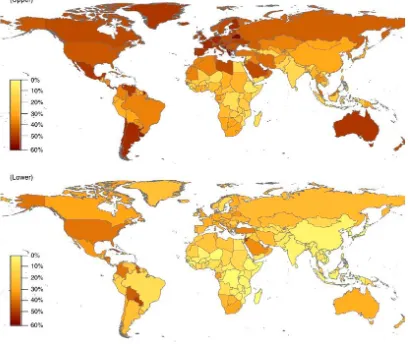
Figure 1 Worldwide age-standardized prevalence of overweight (upper) and obesity (lower) in
adults 20 years and older by country in 2005.
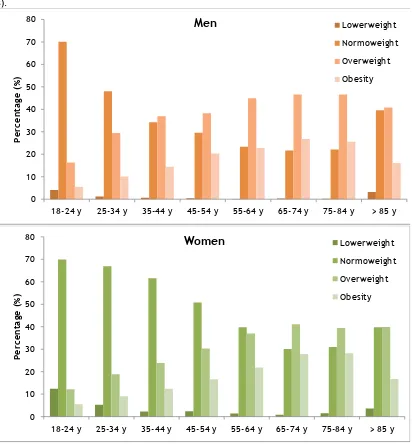
Figure 2 Prevalence of overweight and obesity by age groups among Spanish men and women.
LIST OF TABLES
Table 1 Criterion for Clinical Diagnosis of the Metabolic Syndrome.
I. INTRODUCTION
1. Overweight and obesity
Overweight and obesity are a complex multifactorial conditions characterized by excessive
accumulation and storage of body fat, increasing the risk of disease and decreasing the quality
of life. Both conditions are usually determined by the body mass index (BMI), defined as an
individual’s weight in kilograms divided by the square of the height in meters (kg/m2).
The World Health Organization (WHO) and National Institutes of Health defines overweight as
having a BMI between 25 to 29.9 kg/m2; and obesity as BMI greater than or equal to 30 kg/m2 (1).
Although BMI is a useful and easy measurement to assess overweight and obesity at a population
level, it has several limitations (2). The most important limitation of this measure is that it
doesn’t take into consideration the degree of fatness of individuals. Athletic individuals, normally
with higher percentage of muscle mass, may have a higher than normal BMI and yet have a normal
percentage of body fat. In addition, there are different obesity phenotypes according the fat
mass distribution in the body. Central or upper body distribution (android) has been more
correlated with an increased risk of disease (3–5) than general, peripheral or bottom (gynoid)
distribution.
1.1 Prevalence and trends of overweight and obesity
Obesity has received a considerable attention as a major health problem and has reached
epidemic proportion globally. This alarming increase affects both developed and developing
countries throughout the world. At least 2.8 million people die as a consequence of being
overweight or obese.
In the last 25 years, worldwide obesity prevalence has doubled. In 2008, the WHO estimated that
34% of men and 35% of women aged 20 or more were overweight; and 10% of men and 14% of
women were obese (Figure 1). With the current trend, by 2030 up to 58% of the world’s adult
regions with highest prevalence of overweight and obesity were in the American and European
regions (7). In the United States, 73 % of men and 66% of women have a BMI equal or greater than
25 kg/m2. The prevalence in many European regions is also considerable, both northern (Germany
and UK) and southern (i.e Spain and Greece). In UK, 66% of men and 58% of women could be
[image:23.595.82.490.271.615.2]considered overweight or obese (7).
Figure 1 Worldwide age-standardized prevalence of overweight (upper) and obesity (lower)
in adults 20 years and older by country in 2005.
In Spain, overweight and obesity rates are particularly alarming with and especial increase in the
[image:24.595.121.533.181.625.2]incidence of the disease during the last 25 years.
Figure 2 Prevalence of overweight and obesity by age groups among Spanish men and women
(8). 0 10 20 30 40 50 60 70 80
18-24 y 25-34 y 35-44 y 45-54 y 55-64 y 65-74 y 75-84 y > 85 y
P er ce n tage (%)
Men
Lowerweight Normoweight Overweight Obesity 0 10 20 30 40 50 60 70 8018-24 y 25-34 y 35-44 y 45-54 y 55-64 y 65-74 y 75-84 y > 85 y
In 1987, 45% of men and 34% of the women had a BMI higher than 25 kg/m2. The most recent
data extracted from the national health survey of 2011-2012 estimates that 63% of men and 44%
of women have overweight or obesity (Figure 2) (9).
Similar to adult, the prevalence in childhood obesity has been increased substantially over the
last three decades (10). It has been estimated that 170 million children (aged less than 18 years)
worldwide have overweight (11). An increase in BMI during childhood has also associated to
serious health consequences and can be considered a risk factor for cardiovascular disease (CVD),
type 2 diabetes mellitus (T2DM) and cancer (12,13). These diseases not also generate premature
mortality, but also long-term morbidity.
In USA, the prevalence of obesity has almost tripled among children and adolescents since 1980
(14). This data indicates that childhood obesity is increasing even more rapidly than adult
obesity, suggesting major problems for the population’s future health. A similar situation has
been observed in Spain where nearly 30% of the children or adolescents are overweight or obese
(9). Since 1987, the prevalence of overweight and obesity has increased 5% and 5,6% in boys and
girls, respectively.
1.2 Obesity risk factors
Overweight and obesity are consequences of a disturbance in energy balance, when total energy
intake (total amount of calories consumed) is higher than total energy expenditure (the
combination of physical activity, basal metabolic rate and food thermogenesis). However, we
still do not fully understand all underlying reasons of obesity because they are a complex mixture
of genetic, environmental, psychosocial, cultural and cognitive factors.
1.2.1 Non-Modifiable factors
Over the last 20 years, considerable strategies have been employed for the identification of
genetic determinants of obesity, including studies of sever forms of obesity, genome wide linkage
studies, candidate gene analyses and genome wide association studies.
During the eighties, twin and family studies suggested that 40-70% of the inter-individual
variation in obesity risk and BMI can be attributed to genetic factors (15). Before 1995, the major
attention in genetics of common obesity was candidate gene studies. Those studies were focused
on genes with a suspected role in physiological pathways regarding body weight regulations and
energy metabolism. One of the most studied is the melanocortin 4 receptor (MC4R) gene, widely
expressed in the central nervous system. MC4R plays a key role in the regulation in food intake
and energy metabolism. Functional mutations in MC4R are the commonest monogenic cause of
sever early-onset obesity (16). However, in the past few years, genome wide association studies
have led to breakthrough progress in the identification of obesity-susceptibly genes. To date,
large-scale meta-analyses have identified 32 genetic loci associated with BMI, 14 loci associated
with waist-to-hip ratio and 2 associated with percentage of body fat (17,18). Surprisingly, the
combined effect of all-obesity associated variants is very modest and only explains 2% of the BMI
heritability (19). The difference with the heritability of BMI estimated by twin and family studies
(between 40% and 70%) could be partially explained by the modifying effects of environmental
factors on genetic predisposition of obesity.
1.2.1.2 Gender/age/ethnicity
Gender, age and ethnicity are classical non-modifiable factors related to obesity. Gender
differences in prevalence of overweight and obesity are no constant across regions or countries
and sometimes are influenced by ethnicity and socioeconomic status.
Generally, epidemiological studies show that men have higher overweight and obesity prevalence
than women in the majority of regions and countries, but not all of them. In USA, the gender
difference in the combined overweight and obesity was small, as the prevalence in men (67.0%)
34.0% (20). On the contrary, in Spain, the prevalence of overweight was 45.2% in men and 28.2%
in women, whereas obesity rates for men and women were 18% and 16%, respectively (8).
Significant age differences in the prevalence of overweight and obesity have been reported in
various countries. In general, overweight and obesity prevalence is higher in adults than children
in most countries. Part of the differences could be explained by the different diagnosis criteria
used between children and adults (BMI vs. Age-sex-specific BMI percentiles), whereas others are
actual differences due to age differences in physiology and health behaviors related to energy
balance. Traditionally, prevalence of obesity has taken a “Λ” shape in relation to age. Several
observational studies have found a gradual increase of obesity prevalence until 65 years of age,
and a slightly decrease after that (21,22). Again, if we revise the data published in the last
national health survey in Spain, similar trends were observed, although high obesity prevalence
are carried around 75 years of age (9).
Ethnic differences among overweight and obesity prevalence have also been reported (20,23).
Studies conducted in US populations have shown large differences in obesity prevalence between
ethnic groups, especially among women. Data from the US National Health and Nutrition
Examination Survey (NHANES) indicate that the prevalence of obesity was 30.2, 42.3 and 53.9%
in white, Mexican American and black women, respectively (20).
1.2.2 Modifiable factors
Despite the role of non-modifiable determinants on weight gain, the epidemic proportions in
obesity worldwide over the last 25 years cannot be explained by gender, ethnicity or genetic
factors alone. The obesity epidemic is a reflection of changes in lifestyle, which have been too
fast for our genes to adapt to (24,25). The increasingly obesogenic environment we live in is
characterized by sedentary lifestyles, increased portion sizes, an abundance of energy dense,
1.2.2.1 Physical Activity
Physical inactivity is one of the factors associated with the prevalence of overweight and obesity.
A large cohort study in American nurses found that in 50,000 non-obese nurses, those who
watched more television and had a sedentary lifestyle were at greater risk of developing obesity
during 6 years of follow-up. The authors estimated that 30% (95%CI 24–36%) of new cases of
obesity could be prevented by adopting a relatively active lifestyle (<10 h/week TV viewing and
≥30 min of brisk walking per day) (26). Also, the results of a multicenter prospective cohort study
conducted in 23 centers in 10 European countries including 405,819 healthy volunteers showed a
strong inverse association between total physical activity and BMI and waist circumference.
Changing to one level of physical activity to another (Inactive, moderately inactive, moderately
active and active) corresponded to a difference of 1 cm in waist circumference and to a
difference of 0.25 kg/m2 in the BMI (27). In the last 2011-2012 Spanish Health National Survey,
59% of the participants performed light or no physical activity in the last seven days, and 35.9%
of men and 46.6% of women declare themselves as sedentary (9).
1.2.2.2 Tobacco
Obesity and smoking are main causes of preventable morbidity and mortality around the globe
(28). Smoking cessation have been associated with an increased risk of weight gain (29), due to
a reduction in energy expenditure (30). However, the association between smoking and obesity
is more complex. Several studies have found lower body weight and lower BMI among smokers
than non-smokers (31). Smoking initiation in girls could be related to weight control (32), and
among adult women, attempts for smoking cessation could be limited by fear of weight gain (33).
In addition, smokers could also shear other obesity risk behaviors such as poor dietary habits and
sedentary (34).
1.2.2.3 Diet
Several dietary factors have been associated with weight gain and a greater risk of obesity.
Energy density, obesogenic environment and food behaviors are determinants related to energy
balance that the scientific community has focused their attention. Short term feeding trials have
found that lower-energy dense food choices lead to a higher amount of food consumption but
lower energy intakes compared to higher-energy density diets. An observational study, assessing
whether dietary energy density predicts weight change over 6 y among a sample of non-Hispanic,
white women, found that consumption of a lower-ED diet moderates weight gain. These results
are supported by those observed in a randomized clinical trial (RCT) where 658 prehypertensive
and hypertensive persons were randomly assigned to 1 of 3 groups: the established group received
an intervention of 18 sessions implementing well-established hypertension recommendations, the
established+Dietary Approaches to Stop Hypertension (DASH) group received an intervention of
18 sessions also implementing the DASH diet, and the advice group received 1 session on these
topics. Authors concluded that both large and modest energy density reductions were associated
with weight loss and improved diet quality. This suggests that lower-energy density diets may
lead to better appetite regulation and improved body weight control (35–37). In line with these
results, some investigators have pointed out that portion size of foods as other contributing factor
of weight gain. Current scientific evidence shows that the portion size of foods are related to
the amount of food intake, and also to the perception of the individuals towards food (38). Other
factors such skipping breakfast or snaking have also been associated with weight gain, however
the results are controversial and inconsistent (39).
The so-called obesogenic environment is also a determinant factor that contributes to increase
the prevalence of obesity. The absence of supermarkets in local neighborhoods, principal source
of vegetables and fruits, and long distance to supermarkets are associated with higher BMI (40–
42).
Additionally, moderately strong evidence now indicates that some dietary patterns, including
Mediterranean diet or Vegetarian diet, could play a role in the prevention of overweight and
obesity (43,44). Mediterranean diet, characterized by a high intake of olive oil, fruit, nuts,
vegetables, and cereals; a moderate intake of fish and poultry; a low intake of dairy products,
inversely associated with BMI and obesity (45–54). The results of an observational study
conducted in 3162 Spanish men and women aged 25–74 y showed that increasing adherence to
the traditional Mediterranean dietary pattern reduced the obesity risk. Those individuals in the
highest tertile of Mediterranean diet adherence had a 40% less risk to be obese than those in the
lowest (47). Vegetarian diet has also been proposed as a valid dietary pattern for the prevention
of obesity. Several observational studies have evaluated the associations between vegetarian
diet and BMI (44,55–58). All of them found that those individuals who followed a vegetarian diet
had a lower BMI, than those who followed an omnivore diet. Rosell et al., conducted a
prospective cohort study to evaluate 5-year changes in body weight among the participants of
the EPIC-Oxford study. The authors categorized 21,966 healthy adults in 6 groups: meat-eating,
fish-eating, vegetarian, vegan, reverted and converted. Those who during the follow-up period
had changed their diet in one or more steps in the direction vegan > vegetarian > fish-eater >
meat-eater, were classified as 'reverted' and subjects who had changed their diet by one or more
steps in the opposite direction were classified as 'converted'. Among those who did not change
their diet, meat-eaters were those with more weight gain, whereas among those who changed
their diet, converted had the lowest weight gain and reverted the highest (44).
Finally, some nutrients and specific foods have also been associated with body weight. Dietary
fat is the macronutrient with the highest energy content; however it exerts a weak satiating
effect. Thus, it has been suggested that high-fat diets could be associated with weight gain due
to the poor satiating effect of dietary fat that could lead to overconsumption. Evidence from
epidemiologic studies linking fat intake to weight gain or obesity is weak (59–61) and inconsistent
(62–68). The results from the Nurses' Health Study among 41,518 women reported weak positive
associations between total fat intake and weight gain over 8 years, although there was a strong
positive association with the percentage of energy from animal fat, saturated fat, and trans fat
(69). On the contrary, Forouhi et al. didn’t found a significant association between the amount
or type of dietary fat and subsequent weight change in 89,432 men and women from 6 cohorts
Dietary carbohydrates have also been associated with body weight and obesity. The majority of
epidemiological studies evaluating the associations between carbohydrates intake and measures
of overweight and obesity (BMI and waist circumference) have shown and inverse correlation (71–
82). Carbohydrate intake was found inversely associated with body weight gain in a cohort of 376
Danish men and women (81). Higher carbohydrate intake was also associated with lower risk of
obesity among 63,307 United States women in the Cancer Prevention Study II Nutrition Cohort
(82).
The role of dietary protein on body weight is highly controversial. Owing to the high satiating
effect of dietary protein, it has been suggested that high-protein diets could be associated to a
decreased energy intake. However, there is not sufficient evidence to support this theory (83–
89). Current scientific evidence suggests a differentiated role of dietary protein depending on
the source (animal or vegetal). Kahn and coworkers evaluated changes in BMI and waist
circumference in a cohort of 29,236 adults with a follow-up of 10 years. Increased BMI was
positively associated with meat intake (89). In 2010, Vergnaud et al., evaluated the association
between meat intake (red meat, poultry and processed meat) and weight gain in 270,348 women
and 103,455 men during 5 years of follow-up. After controlling for potential confounders, the
authors found a positive association between meat consumption and a higher BMI (88).
Dietary fiber has been related with several health benefits, including body weight management
by several mechanisms. Cross-sectional prospective studies have associated dietary fiber intake
with a lower weight gain (90–92). This association has also been observed in longitudinal studies
(93–97). Koh-Banerjee et al., showed that the increase in dietary fiber coming from fruit and
whole-grain cereals was inversely associated with weight gain at long-term in a cohort of 27,082
adult healthy men (97).
Dietary glycemic index (GI) and glycemic load (GL) has also been associated with BMI and obesity,
1.3 Obesity as a risk factor
Obesity is an important risk factor of hypertension, T2DM, dyslipidemia, CVD and some types of
cancer (98) (98), increasing the risk of mortality and decreasing quality of life.
1.3.1 Hypertension
It is estimated that at least 75% of the incidence of hypertension is related directly to obesity
(99). Experimental animal studies have demonstrated a consistent rise in blood pressure with
excess weight gain induced by prolonged high fat diet (100,101). Epidemiological data
unequivocally support the link between body weight and BP. Data from the NHANES indicates
that the prevalence of hypertension among obese individuals was 42.5% compared with the 27.8%
for overweight individuals and 15.3% for those with normal BMI (102). Additionally, higher BMI is
also associated with greater risk of having hypertension. In the Framingham Heart Study,
compared to those individuals with normoweight, the relative risk of developing hypertension in
long-term follow-up were 1.48 and 1.70 for overweight men and women and 2.23 and 2.63 for
obese men and women, respectively (103). Clinical studies also suggest that excess weight gain
is a key contributor to elevated blood pressure in most patients with primary hypertension.
Weight loss between 5%-10% decreases blood pressure in normotensive as well as in hypertensive
obese subjects and reduces the need for antihypertensive medication (104).
Mechanisms underlying the link between obesity and hypertension include the
renin-angiotensin-aldosterone system , the sympathetic nervous system (SNS), metabolic dysregulation (including
hyperinsulinemia, adipokine imbalance, and increased inflammatory cytokines). Activation of
renin-angiotensin-aldosterone system system thought basically the SNS is a major factor of the
obesity-related hypertension (105). Insulin and Leptin, both increased in individuals with obesity
(106), have also found to activate the SNS (107) and, therefore, contribute to obesity-related
hypertension. I addition, insulin has direct effect on sodium retention in the kidney (108).
Another contributing factor in obesity-associated hypertension is vascular stiffness which is
1.3.2 Type 2 diabetes mellitus
The prevalence of T2DM and Obesity are both increasing exponentially. Evidence from
epidemiological studies show that obesity and weight gain are associated with an increased risk
of diabetes (110,111). BMI, waist circumference and hip-to-waist ratio are anthropometric
measurements used as risk indicators for T2DM (112,113). Recently, a meta-analysis of 15
prospective studies has found that waist circumference and waist-to-hip ratio (markers of
abdominal obesity or visceral fat) could be better indicators of T2DM risk than BMI (marker of
general obesity) (114).
Obesity-induced T2D has been recognized as an inflammatory disease. The systemic low-grade
inflammatory response that is often observed in obesity detrimentally affects both insulin
signaling and beta-cell function and may thus contribute to the development of T2D (115–117).
1.3.3 Cardiovascular Disease
Cardiovascular disease is caused by disorders of the heart and blood vessels, and includes
coronary heart disease (myocardial infraction), cerebrovascular disease (stroke), raised blood
pressure (hypertension), peripheral artery disease, rheumatic heart disease, congenital heart
disease and heart failure. Now a days, CVD are the leading cause of mortality in developed
countries (118) and it is estimated that it will increase, especially in low and middle income
countries (119).
As stated before, obesity is a precursor of hypertension, diabetes and their associated risks, and,
therefore a risk for CVD. Epidemiological evidence have shown a positive association between
overweight and obesity, and coronary heart disease (CHD) and stroke (120–122). Data from a
meta-analysis including 21 cohort studies with more than 300,000 participants showed a
significant increased risk of CHD independently of traditional risk factors (blood pressure and
cholesterol concentrations). Relative Risk (RR)s (95% CI) for moderate overweight and obesity
compared with normal weight were 1.32 (1.24-1.40) and 1.81 (1.56-2.10), respectively (122). In
case of stroke, another meta-analysis of prospective studies with 2 million participants showed
After adjusting for potential confounders, RR (95% CI) for ischemic stroke was 1.22 (1.05–1.41)
for overweight and 1.64 (1.36–1.99) for obesity (120).
1.3.4 Cancer
Epidemiological estimations shows that 20% of all cancers are caused by excessive body weight
(123). In postmenopausal women, in particular, approximately 50% of all cancers can be
attributed to obesity (124). Many prospective epidemiological studies have demonstrated a
positive association between overweight and cancer, even though obesity alone does not
apparently heighten cancer risk in all tissues by the same amount (12,123–128).
A recent systematic review and meta-analysis of prospective observational studies, with 282,000
incident cancer cases and a follow-up greater than 133 million person-years, has demonstrated
that the obesity and cancer association is sex specific over a wide range of malignancies, and
this remains mostly true for different geographic populations (125).
The reports of international agencies for cancer research have showed that most common types
of cancer in obese individuals are endometrial, esophageal adenocarcinoma, colorectal,
postmenopausal breast, prostate, and renal (12,128).
Apart of from BMI, other anthropometrical measurements including waist circumference or
waist-to-hip ratio have been investigated as adiposity indicators of cancer risk. Several cancers, such
as colon, premenopausal breast, endometrium, and esophageal adenocarcinoma, together with
pancreas tumors, have been more associated with abdominal obesity than BMI (129–133).
Due to the great variety of cancers associated with abdominal and general obesity, the list of
possible mechanisms linking both pathologies is also extensive. Lifestyle, genetic and molecular
factors have been related obesity to cancer (134–141).
2. Metabolic Syndrome
2.1 Pathology and diagnose
The metabolic syndrome (MetS) was used, simultaneously, for the first time at the end of the
seventies by Haller (142) and Singer (143) to describe different combinations of metabolic
disorders such as central obesity, diabetes mellitus, hyperlipoproteinemia, hyperuricemia,
hepatic steatosis, gout and hypertension. In 1988, this concept, also called insulin resistance
syndrome (144), was unified by Reaven (145), although obesity was not present in this definition.
Now a day, the MetS is defined as a cluster of several cardiometabolic risk factors including
central obesity, hyperglycemia, hypertension and atherogenic dyslipidemia. This term was
officially institutionalized by the WHO (146) and the Third Report of the National Cholesterol
Education Program’s Adult Treatment Panel (ATP III) (147,148). Additionally, similar, but not
equal, definitions were described by other institutions (149–151).
In 2009, an unique definition was established by the International Diabetes Federation and
American Heart Association/National Heart, Lung, and Blood Institute (152). They agreed that
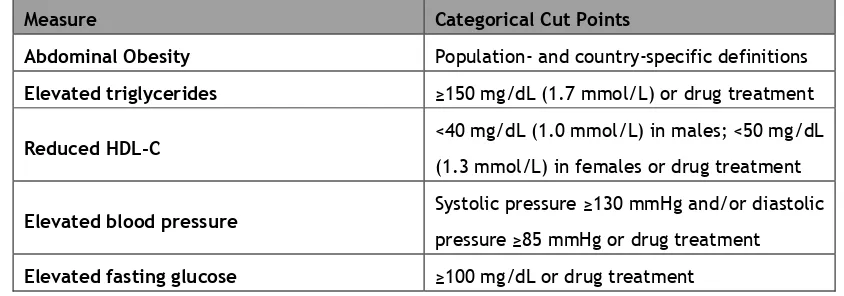
the presence of any 3 of the 5 risk factors constitutes a diagnosis of MetS. In Table 1 are shown
[image:35.595.70.492.432.580.2]the 5 criteria used for its definition.
Table 1 Criteria for Clinical Diagnosis of the Metabolic Syndrome(152).
Measure Categorical Cut Points
Abdominal Obesity Population- and country-specific definitions
Elevated triglycerides ≥150 mg/dL (1.7 mmol/L) or drug treatment
Reduced HDL-C <40 mg/dL (1.0 mmol/L) in males; <50 mg/dL
(1.3 mmol/L) in females or drug treatment
Elevated blood pressure Systolic pressure ≥130 mmHg and/or diastolic
pressure ≥85 mmHg or drug treatment
Elevated fasting glucose ≥100 mg/dL or drug treatment
Like the obesity epidemic, the MetS has become one of the major health problems worldwide. It
is estimated that the prevalence of the MetS among worldwide adult individuals is reaching 25%
of the population (153–156).
In the U.S., approximately one-fifth of the adult population is at high cardiovascular risk
(154,155). Data from the NHANES indicates that, between 2009 and 2010, the age-adjusted
prevalence of MetS in adult population was 22.9% (95% CI: 20.3% to 25.5%). The same authors
found a slightly decrease in the prevalence of the MetS between 1999 [25.5% (95% CI: 22.5% to
28.6%)] and 2010 [22.9% (95% CI: 20.3% to 25.5%)] due to a decrease in hypertriglyceridemia
prevalence (33.5% to 24.3%), as did elevated blood pressure (32.3% to 24.0%) (155). They suggest
that the decrease in hypertriglyceridemia and hypertension is correlated with an increase in in
lipid-modifying and anti-hypertensive drugs, respectively.
Similar situations have been observed in several European countries. A study with 11 European
and one US population-based cohorts found that almost 25% of the adult population had MetS.
They also found that the prevalence increased with advanced age, from 3.7 with age between
[image:36.595.168.477.426.634.2]20 and 29 years to over 30% with age 70 years or more.
Countries with a higher prevalence of MetS were Lithuania (>60%), Greece (40%) and Spain (40%),
whereas those with lower prevalence were Italy (Sardinia) (<10%), Sweden (>10%) and Belgium
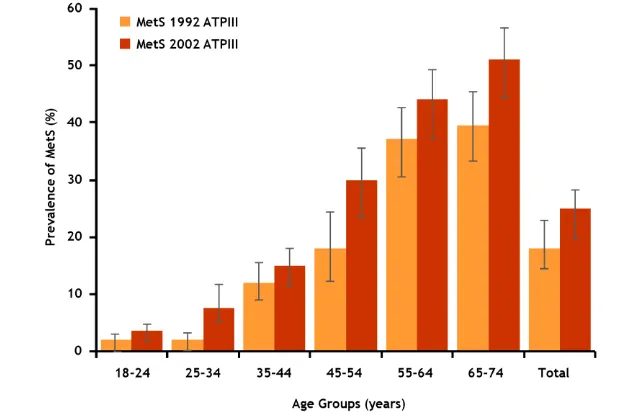
(<20%). In the Mediterranean population of Catalonia, Spain, the prevalence of MetS between
1992 and 1993 were 18.4% (95% CI 15.8–21.1%) using the ATPIII criteria and 25% (95% CI 22.0–
28.0%) with IDF. After 10 years, the prevalence had increased a 6.4% when ATPIII criteria were
used and a 3.5% when IDF criteria were used (Figure 3) (157).
2.3 Metabolic Syndrome as a cardiovascular risk factor
As stated before, the MetS is a cluster of CVD risk factors and therefore, it is reasonable to thing
that those individuals with MetS could be more exposed to develop CVD. Many studies have
evaluated the associations of prevalence of MetS and risk of CVD (158–165).
In a recent meta-analysis of 87 prospective observational studies which included nearly one
million men and women with a mean follow-up of ranging from 1.0 to 32.7 years, Mottillo et al.
investigated the associations of MetS and risk of CVD, CVD mortality, stroke, myocardial
increased risk of CVD (relative risk [RR]: 2.35; 95% CI: 2.02 to 2.73), CVD mortality (RR: 2.40; 95%
CI: 1.87 to 3.08), all-cause mortality (RR: 1.58; 95% CI: 1.39 to 1.78), myocardial infarction (RR:
1.99; 95% CI: 1.61 to 2.46), and stroke (RR: 2.27; 95% CI: 1.80 to 2.85). They also found that RR
for all estimates of cardiovascular risk was slightly higher in women than men, especially in
all-cause mortality.
The pathophysiological mechanisms linking the MetS with an increased risk of CVD is still unknown
(152). However, it is largely accepted by the scientific community that insulin resistance is an
underling process of the MetS. Insulin resistance, represented by hyperinsulinemia and
hyperglycemia, lead to the activation of the sympathetic nervous system triggering sodium
retention and volume expansion and, thus, higher BP (166,167). Also, hepatic production of very
low-density lipoproteins is increased in those individuals with insulin resistance, leading to
hypertriglyceridemia, low High Densisty Lipoprotein (HDL) cholesterol, elevated apolipoprotein
B, elevated small Low Density Lipoprotein (LDL) cholesterol, and consequently, atherosclerosis
(168–170).
3. Treatment of Obesity and Metabolic Syndrome
The main goals of Obesity and MetS treatment include sustained weight loss with a primary focus
on abdominal obesity, improvement of obesity-related health risks and quality of life, and
reduction of mortality. Intentional weight loss normally is associated with reduced mortality,
improved blood pressure and lipid profile, mental health and quality of life (171). A modest
weight loss of 5-10% significantly reduces obesity-related risks (171,172).
Mainly, there are three strategies for obesity treatment. Bariatric surgery can be considered for
patients with more severe disease and who meet its indications. Pharmacotherapy may be useful
in some individuals for whom non-pharmacological approaches alone are ineffective or
insufficient. However, lifestyle management, including diet and physical activity, is
3.1 Surgical treatment
The International Federation of Surgical Obesity has in consideration several selection criteria
which make a patient suitable for bariatric of weight-loss surgery. Patients must have a BMI ≥ 40
kg/m2 or those with a BMI ≥ 35 kg/m2 who have associated high-risk comorbid conditions such as
atherogenic diseases, or T2DM; reasonable attempts at other weight loss techniques; age
between 18-65 years; obesity related health problems; no psychiatric or drug dependency
problems; a capacity to understand the risks and commitment associated with the surgery and
pregnancy not anticipated in the first two years following surgery.
Traditionally, bariatric surgery has been classified in three categories based on anatomical
changes, restrictive, restrictive-malabsorptive and malabsorptive. However, clinical benefits of
bariatric surgery in weight loss and improving metabolic comorbidities have been attributed to
changes in the physiological responses of gut hormones and adipose tissue metabolism (173,174).
The most common techniques performed in bariatric surgery are Laparoscopic Adjustable Gastric
Banding, Laparoscopic Sleeve Gastrectomy and Roux-en-Y Bypass. Mean percent weight loss is
estimated to be between 25% to 95% of total excess weight, depending on the procedure (175).
Several studies have demonstrated a decrease in co-morbid conditions and improvement in health
after surgery for obesity (176–178). Data from the Swedish Obese Subjects study showed a
decrease in prevalence of cancer and a 28% reduction in the adjusted all-cause mortality rate in
those subjects in the surgical group compared with conventionally treated obese (177,178). Data
from 7,925 patients of the Utah study also supports these results showing a 52% lower rate of
death from all-causes (176).
3.2. Pharmacological treatment
Improving diet combined with reinforced physical activity constitutes the first-line management
for overweight or obesity, but adherence to lifestyle measures is difficult to achieve. Individuals
who cannot achieve significant weight loss by lifestyle interventions alone may benefit from
Weight loss medications have been classified in two major categories: appetite suppressants and
gastrointestinal fat blockers. Appetite suppressing medications have targeted three monoamine
receptor systems in the hypothalamus: noradrenergic, dopaminergic and serotonergic (179). In
the other hand, Orlistat is a potent slowly reversible inhibitor of pancreatic, gastric, and
carboxylester lipases and phospholipase A2, which are required for the hydrolysis of dietary fat
in the gastrointestinal tract into fatty acids and monoacylglycerols (180).
Orlistat, lorcaserin, and phentermine plus topiramate-ER, the most used weight-loss drugs at this
time, increases the chances to achive a >5% of weight loss after 1 year when are used in
conjunction with lifestyle intervention (181). However, in Spain, Orlistat is the only accepted
pharmacological treatment for obesity.
3.3. Lifestyle modification
The key element of obesity treatment is assisting patients to develop healthy lifestyle habits
through the improvement of better dietary and physical activity choices that will lead to a
gradual weight loss. The initial goal is to achieve a 5% to 10% weight loss over the initial 6 months
of treatment (182). Caloric restriction is the most important component in achieving weight loss,
focusing in fat mass, whereas increased and sustained physical activity is particularly important
in maintaining the lost weight and reducing the loss of fat free mass (183–185).
3.3.1 Physical activity
It has been well established that weight control is a delicate balance between energy intake and
energy expenditure, of which energy physical activity is the most variable and modifiable
component of the energy expenditure side of the energy balance equation. Physical activity is
ranged between 10% and 40% of total daily energy expenditure and thus plays an important role
in the treatment of overweight and obesity (186). The American College of Sports Medicine
recommends 150 to 250 minutes per week to prevent weight gain(187) and 225 to 420 to promote
Epidemiological data suggest that physical activity is a key element in weight gain (186,188–190).
Data from 9325 individuals of NHANES showed that low levels of self-reported recreational
physical activity were associated with a 3-fold and 5-fold increased risk of weight gain in men
and women, respectively (191).
However, the results obtained from studies investigating weight loss as a result of aerobic
exercise training are very heterogonous. The Dose Response to Exercise in Women study found
no significant changes in body weight in 464 postmenopausal women exercising at 50% (− 0.4 kg),
100% (− 2.2 kg) and 150% (− 0.6 kg) of public health guidelines for 6 months despite greater than
89% adherence in all ET groups. Also, the Inflammation and Exercise study (n=129) observed no
significant weight loss after 4 moth of exercise training (-0.4 kg) compared with the control group
(0.1 kg) (192). On the contrary, the Diabetes Aerobic and Resistance Exercise study showed
significant weight loss in the exercise training group (-0.74 kg) compared to the control group
after 22 weeks of intervention in 251 adults with T2DM.
Although approximately >2 kg can be achieved by exercise training alone, most studies of
short-term weight loss interventions show that the most significant weight loss occurs when a
combination of diet and exercise is used (183,193–195).
3.3.2 Diet
Dietary treatment of obesity has as a primary objective to achieve a sustained weight loss which
allows decreasing obesity-related risks to health. During the last decades, numerous attempts
have been done to deal with obesity.
The majority of the international societies studying obesity recommend low-energy diets as the
most valid approximation to obesity treatment (196–204). Although low-energy diet has not a
specific definition, scientific community and health professionals have established low-energy
total energy intake greater than 800 kcal/d. Macronutrient composition of the low-calorie diet
(LCD) is still a matter of debate, although a standard composition for a well balance diet has
been proposed (Table 2) (197). The use of this type of diets, with a treatment period between
6 and 12 months, has been associated with a mean loss of about 8%, although, with longer periods
(3-4.5 years), the loss decreases to about 4% (205). To achieve the calorie reduction, several
strategies have been proposed including low energy density foods, meal replacements and
portion size.
Some studies have evaluated the effect of energy density of foods as obesity treatment (206–
209). Ello et al. conducted a 1-year randomized controlled trial to evaluate the effect on weight
loss of 2 strategies, one low-fat group and one low-fat group + low energy density foods, for
reducing the energy density of the diet. After one year, both groups had significant weight loss,
although low energy density foods group had significantly higher loss (209).
Table 2 Recommended macronutrient composition for treatment of obesity(197).
Energy Percentage
Carbohydrates 45-55%
Proteins 15-25%
Lipids 23-35%
Saturated Fatty acids <7%
Monounsaturated Fatty acids 15-20%
Polyunsaturated Fatty acids <7%
Trans Fatty acids <2%
Fiber 20-40g
One of the most important factors which affect weight-loss diets is the treatment adherence. A
suggested strategy to facilitate diet adherence has been to use meals replacements. Meal
replacements products have also been shown to improve weight loss (210,211). In 2003,
487 participants and a follow-up between 3 and 51 months. A significant higher weight loss was
observed in the group using meal replacements (7% loss of the initial body weight) than the
control group (4% loss of the initial body weight). Meal replacement has also been investigated
as nutritional strategy for weight maintenance. A randomized controlled trial was conducted to
assess the long-term effects of 2 energy-restricted diets on weight loss in 100 participants. During
the first 3 months, one of the intervention groups replaced 2 of the 3 meals with
meal-replacement shakes, soups or hot chocolate. During this initial phase, the meal-meal-replacement
group lost 11.3+/-6.8%, whereas the control group lost 5.9+/-5.0% (210). In a second phase of
the same study, both groups were prescribed the same energy-restricted diet with one meal and
one snack replacement for an additional 4 year to maintain the weight loss. At the end of follow
up, both groups maintained the initial weight loss and average weight loss of meal-replacement
group was consistently greater than control group (p = 0.001).
Portion size is an important determinant of energy intake. The number of calories ingested by
subjects at a meal has been directly correlated with the serving size offered (212,213). A
6-month clinical trial evaluating the effect of portion size vs. usual care in 130 obese individuals
found that those individuals in the intervention group loss more weight than those in the control
group (mean ± SD, 1.8% ± 3.9% vs 0.1% ± 3.0%, P = .006) (214). Larger studies are needed to
assess the utility of portion size tools in obesity treatment.
A similar approximation to low-energy diets are very-low-calorie diets (VLCD). VLCD are
commercially formula foods, providing about 450–800 kcal/d, replacing all meals and snacks. The
use of this type of diets are reserved for patients with severe obesity (BMI ≥ 30 kg/m2) (215) and
should only be used for fewer than 16 weeks because of clinical adverse effects (216). Scientific
evidence regarding VLCD suggest that this type of diets is not more effective at long-term than
conventional low-calorie diet (203). The majority of the studies found that participants who
completed a comprehensive VLCD program (that included lifestyle modification) generally lost
15% to 25% of initial weight in 3 to 4 months (217–223) in comparison to the 8% achieved with the
between 6 to 26 months, Tsai et al. found that, compared with the LCD, VLCD generated a higher
short-term weight loss (9.7± 2.4% vs. 16.1±1.6%, respectively; P = 0.0001), although similar
long-term weight losses were found between the two type of interventions (5.0 ± 4.0% vs. 6.3 ± 3.2%,
respectively; P > 0.2) (223).
Calorie restriction can achieve a moderate amount of weight loss in a short term basis, but often
this dietary induced weight-loss cannot be maintained long term (205). A large number of dietary
strategies with different proportions of lipids, proteins, and carbohydrates are currently being
investigated. There is an intense debate about the different diets and macronutrient proportions
that are most effective for treating overweight or obesity. Several trials assessing dietary
composition have been conducted to improve both weight loss and weight maintenance.
3.3.2.1 Low-fat diets
Over the last 30 years, high-carbohydrate, low-fat diets are recommended as ‘healthy’ for the
population in general (224) as well as for individuals susceptible to heart disease (225), cancer
(226), hypertension (225,227), and diabetes (228). Traditionally, low-fat diets have been the
primary approach of the dietary intervention for obesity treatment (197,201,202,204). There are
several reasons for targeting dietary fat intake (229,230). Compared with carbohydrates and
proteins, fat is the most concentrated source of energy, providing ≈38 kJ g–1 as opposed to 17 kJ
g–1 for carbohydrate or protein, and is preferentially stored in adipose tissue (231). High-fat foods
are relatively less satiating than are isoenergetic portions of high-carbohydrate or high-protein
foods; thus individuals on a high-fat diet would tend to consume more total energy to gain the
required amount of carbohydrate as someone on a low-fat diet (232). Furthermore, the improved
taste and palatability of fatty foods increase the potential for active overconsumption.
Several clinical trials have evaluated the effect of energy-restricted low-fat diets on weight loss.
A multicentric intervention trial evaluated whether an energy-restricted low-fat diet (25%) was
superior to an energy-restricted moderate high-fat diet (40%) for the treatment of obesity. At
fat group (p>0.05). However, more subjects lost >10% in the low-fat group than in the
high-fat group ((20.8%, n = 70) versus (14.7%, n = 46) (P = 0.02) (233). Powell et al conducted a clinical
trial with thirty-five obese women 25 to 45 years of age where randomly allocated into one of
four energy- restricted dietary fat groups, with 10%, 20%, 30%, or 40% of caloric intake as dietary
fat. After 12 weeks, no significant differences in the rate or amount of body weight or percent
body fat lost across the four groups (234).
3. 3.2.2 Hyperproteic diets
Now a days, hyperproteic diets, based on carbohydrates substitution for protein, has become a
popular alternative due to the potential benefits for obesity treatment. Traditionally, dietary
recommendations for protein intake has been established around 10-15% of the total energy
intake, however, the protein intake of actual hyperproteic diets is around 20-30%. Among the
most popular hyperproteic diets there are the Atkins diet, the Zone diet and most lately the
Dukan diet. Although these type of diets have become extremely popular among general
population, scientific community have not yet reach a clear opinion either hyperproteic diets are
a good alternative for body weight or not.
Short-term clinical trials assessing the effect of high-protein intake have found a modest positive
effect on weight loss, although this beneficial effect is not sustained in a long term basis (197).
A recent meta-analysis of 24 RCT evaluated energy-restricted, isocaloric, high-protein, low-fat
diets with standard-protein, low-fat diets on weight loss, body composition, resting energy
expenditure, satiety and appetite, and cardiometabolic risk factors. The authors found a
moderate beneficial effect of high-protein, low-fat diets on weight loss at short-term on
comparison of standard-protein, low-fat diets [mean difference, 95% CI: -0.79 kg (-1.50, -0.08),
P=0.03, respectively). Also, in comparison to standard-protein, fat diets, high-protein,
low-fat diets had greater reductions in low-fat mass (−0.87 kg; 95% CI: −1.26, −0.48 kg), in low-fat-free mass
(0.43 kg; 95% CI: 0.09, 0.78 kg) and resting energy expenditure (595.5 kJ/d; 95% CI: 67.0, 1124.1
kJ/d) (235). Despite the moderate beneficial effects at short-term, RCT comparing high-protein
the study of Gardner et al. compering 4 different diets (Atkins, Zone, Ornish y LEARN) found
significant greater body weight reductions among those in the Atkins diet (low-carbohydrates and
a 27% of protein content) than the rest of intervention diets (243). However, the study was only
conducted in women (n=311) and the rest of the intervention diets were not traditional
high-carbohydrates diets but different popular diets.
One of the major concerns about high-protein diets was their long-term safety (244). In 2007 two
prospective observational studies were published evaluating the associations of protein
consumption and cardiovascular and all-cause mortality. The first study was conducted in 42,237
Swedish women, with a mean follow-up of 12 years, where those individuals with higher protein
and lower carbohydrate intakes had a 37% more risk of cardiovascular death and an 11% more
risk of all-cause mortality (245). Similarly, the authors of the second study, conducted in 22,944
Greek adults (mean follow-up of 10 years), found that also those participants in with higher
intake of carbohydrates and protein had an increased risk of all-cause mortality (per 5 units, HR:
1.22; 95% CI 1.09 to 1.36) (85). However, some authors suggests that protein source could be a
key element in the associations between protein intake and mortality (84,246).
3.3.2 3 Low-fat vs. Low-carbohydrate diets
Although international institutions and public health guidelines promote high carbohydrates, low
fat, energy-restricted diets as the first option for obesity treatment, the persistence of obesity
epidemic have been increasing for the last decades and new dietary strategies have to be
evaluated to overcome this epidemic.
Low-carbohydrates diets have been proposed as a valid alternative to low fat-diets. The logic
explanation to carbohydrate restriction is that, in response to postprandial hyperglycemia,
changes in regulatory hormones, insulin and glucagon, will increase fat oxidation and decrease
A great number of trials and several meta-analyses have compared the effects of low-fat diets
vs. low-carbohydrates diets on weight loss (247–250). In 2006, two similar meta-analyses of RCT
were published comparing the effects of low-carbohydrates diets vs. low fat diets (248,249).
First, Nordmann et al. published a meta-analysis of 5 RCT compering low-carbohydrates diet
without caloric restriction vs. energy-restricted fat diets. The results showed that
low-carbohydrates diets exert a greater weight loss than low-fat diets during the first 6 months,
although this effect was not significant at 12 month. Similar results were found in another
meta-analysis of 6 RCT conducted by Levine and coworkers. The authors conclude that
low-carbohydrates diets resulted in a higher weight loss than low-fat at 6 months
4. Glycemic index and glycemic load
4.1 Glycemic index
The concept of the GI was derived from the dietary fiber hypothesis proposed by Burkitt and
Trowell, who suggested that foods with a slow absorption rate could have better metabolic
benefits in relation to western societies’ diseases such diabetes and coronary heart disease (251).
The origin of the GI concept was to establish a valid and robust measure to calculate the impact
of the carbohydrates present in foods on blood glucose concentrations. In 1981,Prof David Jenkins
and coauthors defined the GI concept as the incremental area under the blood glucose response
curve of a 50g carbohydrate portion of a test food expressed as a percent of the response to the
same amount of carbohydrate from a standard food taken by the same subject (252). Thus, the
GI is a property of the carbohydrates present in the foods, and it’s determined by several factors
including the nature of the monosaccharide forming the carbohydrates, the amount of
carbohydrates absorbed and the amount that are metabolized. The methodology for GI
calculation is recognized and described by the International Standards Organization (26 642:2010)
and by the Food and Agriculture Organization of the United Nations (253). Intrinsic and extrinsic
factors that alter the rate of gastrointestinal motility, digestion and absorption, and the nature
of the starch, cooking method, particle size, and the presence of fiber, fat, and proteins were
by these foods could differ between individuals with different metabolic conditions, the GI of
foods is very similar regardless of the pathophysiological condition of the individuals (256). The
GI of a diet can be calculated through the individual GI values of the foods composing the whole
diet, and it can estimate the quality of the dietary carbohydrates regardless of the amount
consumed (257).
Due to glycemic responses generated by carbohydrates are strongly related to insulin responses
(258,259), GI has been investigated as a possible tool for the prevention or treatment of chronic
diseases (260–262). GI was firstly used as a dietary tool to T2DM management, however
subsequent studies have associated GI with other chronic diseases such CVDs, cancer and obesity
with inconsistent results.
Several investigators have suggested that hyperglycemia generated by high-GI diets can be a key
dietary factor in the pathogenesis of the T2DM. Prospective cohort studies have found strong
positive associations between GI and risk of T2DM incidence (263–267). A recent meta-analysis of
21 prospective cohort studies has evaluated a systematic literature review and dose-response
meta-analysis of evidence from prospective cohorts. The results of this recent meta-analyses
indicated significant a dose-response RR for GI (1.08 per 5 GI units; 95%CI: 1.02 to 1.15) (268).
Also, several RCT have evaluated the effect of dietary GI as a dietary approach to the treatment
of T2DM. Ajala et al. published a systematic review and a doses-response meta-analysis of RCT
evaluating the effect of GI on the overall strategy of diabetes management. Beneficial effects
on glycated hemoglobin was found on those individuals allocated in a low-GI versus other diets
(high-GI, high fibre or American Diabetes Association recomendations) (Mean difference: -0.14;
95%CI: -0.24, -0.03, respectively) (269).
Postprandial state has been recognized as a key point on the development of cardiovascular risk
factors. Elevated postprandial glycemia and insulinema present after the consumption of high-GI
GI have also been explored as a dietary alternative to reduce the carbohydrate absorption rate,
and hence to treat CVD. Two independent meta-analyses of 28 RCTs with a follow-up between 4
and 78 weeks have shown a beneficial effect of low-GI vs. high-GI on total cholesterol and LDL
(275,276). However, these results were not supported by the data of another recent
meta-analysis of 14 RCTs with a follow-up greater than 6 month where no effect was found between
interventions with different GI and blood lipids. However, the authors reported a beneficial
effect of low-GI interventions in C-reactive protein (CRP) and insulin concentrations (277).
In this context, observational studies have associated high dietary GI with an increased risk of
coronary heart disease and stroke. Four different meta-analyses of observational studies have
assessed the link between GI on CVD risk and have found similar results (278–281). The most
recent and more extensive of them found 26% increased risk of CHD in women, but not in men,
allocated in the highest quartile of dietary GI in comparison with those in the lowest. Similar
results were found when stroke was the main outcome, although in this case increased risk was
associated in both men and women (278).
Several investigators have suggested that metabolic effects generated after the consumption of
high GI food could be associated with an increased risk of several types of cancer (282–288). In
particular, hyperinsulinemia have been pointed as the unifying mechanism for the developing of
several types of cancer (289,290). Observational studies evaluating the associations of GI and
cancer have found different results depending on the type of cancer. A recent meta-analysis
evaluating diabetes-related cancers (bladder, breast, colon–rectum, endometrium, liver and
pancreas) found a pooled RR (95 % CI) of diabetes-related cancers of 1.07 (1.04, 1.11) in a
comparison of the highest and lowest categories of GI. In an specific analysis of cancer type, only
increased risk of breast cancer (RR 1.06; 95 % CI 1.02, 1.11) and colorectal cancer (RR 1·08; 95
% CI 1·00, 1·17) was associated with higher dietary GI (291). Molholland et al. conducted a
meta-analysis of 23 cohorts and case-control studies evaluating the associations of GI and risk of
cancer types, although authors stated that there were insufficient data for the majority of the
types (287).
4.2 Glycemic load
As stated before, the concept of the GI is based exclusively on the type of carbohydrates
compounding the food and a fixed amount of available carbohydrates, normally 50 g. The
quantity restriction was established to provide a food ranking, however, this point can create
some limitations of daily management in which different carbohydrates amounts are eaten during
meals. Because this, Walter Willet and colleagues at Harvard defined the GL in 1997 as the
arithmetic product of GI and carbohydrate amount (264).
Firstly, the physiological validity of the GL concept was questioned due to its mathematical
conception and the lack of experimental studies evaluating its correlation with glycemic and
insulinemic responses evoked by different foods. Trying to resolve this, Brand-Miller et al.
conducted a feeding trial where glycemic and insulinemic responses were measured in healthy
subjects after the consumption of 10 different foods. The results of this feeding trial
demonstrated that calculated GL can predict both glycemia and insulinemia (292). However, the
study has several limitations. First, the participants of the study were healthy lean subjects and
the obtained results cannot be extrapolated to other populations with associated disease.
Second, tested foods were only individual foods and the GL ability to predict glycemic and
insulinemic responses to mixed meals was still unknown. To resolve this second question, the
group of Professor Brand-Miller conducted a new study a few years after where several individual
foods and mixed meals were evaluated (293). Again, the results indicated that GL have a better
prediction of glycemic (92%) and insulinemic (77%) responses of individual foods than
carbohydrate content. When mixed meals were tested, similar, but lower correlations were found
between GL and glycemic (76%) and insulinemic (68%) responses.
Ultimately, the validity of GL has been demonstrated with the observational and intervention