ECONOMÍA
SERIE DOCUMENTOS
No. 47, julio de 2004
Performance and Efficiency in Colombia’s Power
Distribution System: Effects of the 1994 Reform
Carlos Pombo
Rodrigo Taborda
BORRADORES DE
INVESTIGACIÓN BORRADORES
DE
©Centro Editorial Rosarista © Facultad de Economía
© Autores del libro: Carlos Pombo, Rodrigo Taborda
Todos los derechos reservados Primera edición: julio de 2004 ISSN: 0124-4396
Impresión digital: JAVEGRAF - Colombia
POMBO, Carlos
Performance and efficiency in Colombia’s power distribution system : effects of the 1994 reform / Carlos Pombo, Rodrigo Taborda. — Bogotá: Centro Editorial Rosarista, 2004.
40 p. : cuad., tab. –- (Economía. Serie Documentos, Borradores de Investigación; 47). Incluye bibliografía.
ISSN: 0124-4396
P
ERFORMANCE AND EFFICIENCY INC
OLOMBIA’
S POWER DISTRIBUTION SYSTEM:
EFFECTS OF THE1994
REFORMC
ARLOSP
OMBO*capombo@urosario.edu.co
Facultad de Economía Universidad del Rosario Calle 14 # 4 – 69 Bogotá, Colombia
R
ODRIGOT
ABORDArtaborda@urosario.edu.co
Facultad de Economía Universidad del Rosario Calle 14 # 4 – 69 Bogotá, Colombia
A
BSTRACTWe assess evolution in performance, efficiency and productivity of Colombia's power distribution utilities before and after the 1994 regulatory reform that introduced electricity market activities for the power sector in 12 distribution companies from 1985 to 2001. Performance is evaluated contrasting changes in mean and median by Wilcoxon Rank Sum and Pearson tests on financial and other performance indicators. Technical efficiency is measured by means of Data Envelopment Analysis (DEA). The nature of the dataset allows the estimation of Malmquist productivity index and its evolution in time. Results show a recovery after the reform in the main performance indicators of profitability, partial input productivity, and output. Plant efficiency and productivity increased after the reform, mainly in the largest utilities used as benchmarks in the DEA effi-ciency scores measures. Meanwhile, the less efficient power distribution companies did not improved after the reform and were not able to undertake plant restructuring to catch up in plant efficiency with respect to the Pareto efficient input allocations. Econometric results on DEA efficiency scores suggest a positive effect of policy reform.
Key words: Electricity distribution, productive efficiency, power sector Colombia, Malmquist productivity index
JEL Classification: L510, L940, Q490.
* Associate professor and director graduate studies, Department of Economics, Universidad del Rosario.
R
ESUMENEl documento evalúa el desempeño, la eficiencia y la productividad de las empresas de distribución de energía eléctrica en Colombia antes y después de la reforma regulatoria de 1994, para 12 compañías de distribución entre 1985 y 2001. El desempeño se evalúa al contrastar cambios en medias y medianas mediante las pruebas de Wilcoxon Rank-Sum y Pearson, sobre indicadores financieros y de desempeño. La eficiencia técnica se mide con la metodología de Data Evelopment Análisis (DEA). La naturaleza de los datos permita la estimación de índice de productividad de Malmquist y su evolución en el tiempo. Los resultados muestran una recuperación después de la reforma en los indicadores de ganancias, productividad parcial de insumos y del producto. La eficiencia y productividad aumento después de la reforma, principalmente en las empresas de mayor tamaño que se usan como empresas de referencia en las medidas de eficiencia DEA. Así mismo, las empresas menos eficientes no mejoraron después de la reforma y no lograron llevar a cabo una reestructuración para lograr alcanzar la eficiencia indi-vidual respecto a las distribuciones Pareto eficientes. La evaluación econométrica sobre los indicadores de eficiencia DEA sugieren un efecto positivo generado por las políticas de reforma.
1. I
NTRODUCTIONThe 1994 regulatory reform of the Colombian power sector was one of first reforms in Latin America to introduce a market system for the wholesale electricity transactions, and the first to implement a bidding system for its pool electricity market in the region. In this sense, the reform took a step forward from the Chilean an Argentinean experiences, which wholesale electricity prices were based on declared costs rather than on marginal supply prices by 1994.1
The reform introduced competition, established a new industry structure and a new indepen-dent regulatory agencies, setting up the basis for expansion and diversification of power gen-eration sources, improving both the sector's efficiency and reliability.
The reform focused on offering incentives for utility efficiency and productivity levels through the introduction of market competition, independent grid access, and markup price regulation for power distribution. Inspired in the British reform, the regulatory reform split the traditional vertical monopoly structure of the power sector into four different activities: generation, trans-mission, distribution and commercialization of electricity. Power distribution as domiciliary public service provider faces two types of regulation. The first one is price regulation. The regulatory commission, Comisión de Regulación de Energía y Gas (CREG), currently sets the markup formula for distributors and the design of the pass through component in the final user's tariffs. In particular, CREG determines: i) direct purchase costs such as the pool sale price and transportation charges, ii) capacity charges, and iii) costs of the reserve provisions to stabilize the system and prevent bottlenecks in the transmission system.2 The second type of
regulation concerns quality control, companies are subject to sanctions if their service fails to meet minimum quality standards. The reforms and regulations led power holdings to undertake a generalized divestiture process across electricity holdings in order to fully separate power generation, transmission, distribution, and the setting up of new commercialization activities. Thus, privatization arose as one instrument for promoting market competition and industry restructuring, and became a complementary policy within a broad deregulatory context.
The aim of this paper is to provide new empirical evidence on the effects of the regulatory reform in power distribution in Colombia. To the best of our knowledge there is no a micro-study assessing the effects of a regulatory reform for power distribution. Nonetheless, several studies on the Colombian electricity sector after a decade of the regulatory reform have been published recently. Pombo and Ramírez (2003) test performance in the privatized power hold-ings and measured plant efficiency for Colombia's thermal stations showing a generalized in-crease in productive efficiency due to market entry, introduction of cost-saving technologies, and a positive effect of the new regulation that implied the setting up of a non-regulated
mar-1 A presentation of the regulatory reform in Colombia can be found in Pombo (2001). Estache and Rodriguez-Pardina (1998) and Mendoça and Dahl (1999) outlines a general presentation of the process in Latin America. Guash and Spiller (1999) and Kessides (2004) are comprehensive presentations of privatization, regulatory policy instruments, contract designing and results for several Latin American and developing countries. Nonetheless, the development of the power sector in Colombian has been poorly documented. IADB Inter-American-Develop-ment-Bank (2001) provides a short analysis of the sustainability of the power sector reforms in Latin America. For an international review see Newbery (1999).
ket of large clients that boosted transactions of forward electricity contracts. García and Arbelaez (2002) evaluate the likelihood of merging among power generators acting in the wholesale electricity market. Larsen, et al. (2004) present a set of aggregate statistics of Colombia's power sector to highlight the lessons derived from the implementation of market deregulation policies in Colombia for network industries since 1994.
Despite the above, studies on several dimensions of the electricity market are still pending, i.e., price collusion on the pool market, consumers' welfare effects, quality regulation and regu-latory capture, among others topics. This paper provides empirical evidence on the effects induced by the regulatory reform, focusing on the efficiency and productivity effects upon power distribution. The paper presents an ex-post performance analysis for regional power distribution companies based on four elements: i) direct measures of productive efficiency scores and Malmquist productivity index through data envelope analysis programming (DEA), ii) changes in means and medians of firm performance variables of profitability, operating efficiency, labor, investment and sales, iii) an econometric analysis regarding the determinants and micro-fundamentals of firm efficiency scores by the regional power distributing compa-nies, and iv) a evaluation of the policy effectiveness on plant efficiency using a two step DEA decomposition procedure of changes among policy regimes.
The paper structure is organized along four additional sections. Section 2 describes the data set and the methodology employed to assess utility efficiency in power distribution. Section 3 analyses the results of the performance indicators through the changes in means and medians and the measurement outcomes of plant efficiency and productivity through DEA efficiency scores and the construction of a Malmquist index. Section 4 reports an estimation of the policy effects on plant efficiency resulting from the industry reform and an econometric analysis about the determinants of utility efficiency scores. Section 5 concludes.
2. D
ATA AND METHODOLOGY2.1 D
ATAThe data set used for this study includes 12 large electricity distribution companies (EDC) that cover the 20 largest cities belonging to the so-called National Interconnected System (NIS). The NIS is the result of the integration of five power systems and markets that the country used to be divided into before 1994. It covers the Andean region and the Atlantic Coast -country's northern provinces-.3
One effect of the 1994 regulatory reform was the separation of utility business activities that were vertically integrated under a monopoly industry. The 1994 “Electric Law” (Law 143) stated that firms, combining generation and transmission activities had to split up and sell their share of the transmission grid in order to guarantee a fair entry process for new generators. Firms sharing generation and distribution were allowed to retain ownership in both activities as long as they
kept separate managerial and accounting procedures for each in order to avoid cross-subsidizing non-profitable services. The same criteria applied for new power companies. Therefore, the in-dustry reached an almost complete separation of services, promoting competition in generation, keeping the natural monopoly structure of transmission and local distribution, and allowing some sort of contestability for the distribution services given a strict regulation and follow-up of regu-latory agencies able to impose sanctions or changes in ownership upon bad performance.
Before 1994, Colombia's power sector was divided into five big regional markets, which per-form all types of activities: the Bogotá Power Company [Empresa de Energia de Bogotá (EEB)]; the Atlantic Coast Regional Electric Corporation [Corporación Regional de la Costa Atlántica (CORELCA)], Public Enterprises of Medellín [Empresas Públicas de Medellín (EPM)], Cali Power Company [Empresas Municipales de Cali (EMCALI)] and the Cauca Valley Corporation [Corporación Autónoma del Valle del Cauca (CVC)] and finally the Colombian Power Institute [Instituto Colombiano de Energía Eléctrica (ICEL)]. These holdings were formed by publicly owned utilities at municipally or regionally levels. In addition, the national grid company [Interconexión Eléctrica S.A (ISA)] was the largest nationwide power generator and transporter.4
Table 1 synthesizes the pre-reform and post-reform structure of each of the above holdings. There are two sources that explain power sector restructuring. One came from direct divesti-tures i.e.: ISA. The other relied on privatization and equity transfers contracts. Privatization started with the selling of power generating units, such as hydroelectric substations and ther-mal plants. Then it moved toward power distribution companies and networks. Power transmis-sion remained concentrated in ISA as the natural monopoly.5
Before the reform three out of the seven power holdings participated in power generation, transmission and distribution. To comply with Law 143, EEB was partially privatized and divested into three independent firms: EMGESA (generation), EEB-transmisión (transmis-sion) and CODENSA (distribution). CORELCA was divided into four firms: GENDELCA (generation), TRANSELCA (transmission) which was acquired for ISA, and two distribution firms ELECTRICARIBE and ELECTRO-COSTA which were sold to foreign investors. EPM split its management but kept its ownership structure. On the other hand, the reform led to privatization of CVC.
EMCALI and ICEL holdings, which were formed mainly by electricity distribution companies, were only required to separate managerial and accounting functions for each activity. Therefore, only two out of five power distribution networks have been privatized. It is important keep in mind that the city of Bogotá is still the largest shareholder of CODENSA and EMGESA. More-over, EPM, EMCALI, and ICEL are still owned by municipalities, therefore are public utilities. They cover around 50% of residential users for the NIS. Privatization, financial restructuring, and
4 Interconexión Eléctrica S.A (ISA) was founded in 1967. By that time, the sectoral development view was to consoli-date ISA as the largest nationwide power generator and transporter of bulk electricity following the vertically integrated natural monopoly model of Electricité de France. EMCALI and CVC belong to the same regional electricity market. The city of Cali, the third largest in the country, is the capital of the Valle del Cauca province. For more details about Colombia’s power sector history see the World-Bank (1991). A description of the regulatory reform is in Pombo (2001) and Interconexión-Eléctrica-S.A. (1995-1999)
entry competition remain a pending and unfinished task in local power distribution. Finally, ISA was split into two independent companies: ISA the Grid Company, and ISAGEN the publicly owned enterprise that kept ISA's former power generation assets.6
T
ABLE1
P
OWERD
ISTRIBUTION ANDT
RANSMISSIONS
TRUCTURE6 The 1995-1998 privatizations in Colombia implied a equity transfer of 48% for EEB, 65% in the case of CORELCA
in power distribution and transmission, and 56% for EPSA. The National Grid Company ISA sold 30% of its equity through the stock market in 2000. ICEL is a holding of 14 regional power distribution companies, and EMCALI is the power distribution company of the city of Cali see Pombo and Ramírez (2003).
The working dataset consists of 12 larger power distribution companies that belong to the pre-reform regional electricity markets, which together compose the national interconnected system. For each company we gathered information regarding the utility's financial state-ments, number of users by category (i.e. residential, industrial, commercial, and official), number of employees, power losses, sales, commercial demand, and final user tariffs for the 1985-2001 period.
Tables 2 and 3 report the main features of the panel structured dataset. First, the panel is balanced. There are 17 observations for each EDC. For the case of EEB where the company was broken in three independent enterprises, the series where chained with the power distri-bution company -CODENSA- series after 1997. The privatization of CORELCA focused on power distribution companies. Six regional power distributors companies were gathered into two utilities, ELECTROCOSTA and ELECTRICARIBE, after 1998. Thus the series
Before Regulatory Reform After Regulatory Reform
Holding / Company Generation Transmission Distribution Holding / Company Generation Transmission Distribution
EEB x x x EMGESA x
EEB x
CODENSA x
EPM x x x EPM x x
EMCALI x EMCALI x
ICEL x x ICEL x x
CORELCA x x x GENDELCA x
TRANSELCA x
ELECTRICARIBE x
ELECTROCOSTA x
CVC x EPSA x
ISA x x ISA x
ISAGEN x
were chained according to the post-privatization structure. Regarding the ICEL holding, its utilities are still the same. The companies included in the study sample are: i) Centrales Eléctricas del Cauca (CEDELCA), ii) Centrales Eléctricas de Nariño (CEDENAR), iii) Centrales Eléctricas del Norte de Santander (CENS), iv) Central Hidroeléctrica de Caldas (CHEC), v) Electrificadora de Santander S.A. (ESSA), vi) Electrificadora del Huila S.A. (HUILA), and vii) Electrificadora del Tolima S.A. (TOLIMA).7 Finally, EPM and EMCALI
regional markets complete the study sample.
T
ABLE2
S
TUDYS
AMPLE- P
OWERD
ISTRIBUTIONC
OMPANIES7 Each of the ICEL companies is a regional company likewise the Regional Electric Companies in the UK. Each name is associated with one province of the country’s central regions. The ICEL companies excluded from the study sample are: Empresa Antioqueña de Energía (EADE), Electrificadora de Boyacá (EBSA), Electrificadora del Caquetá (CAQUETA), Electrificadora del Choco (CHOCO), Electrificadora del Meta (META), Empresa de Energia de Cundinamarca (EEC). The exclusion of these EDC responds to several factors such as bad quality of the primary data, incomplete series, and most important the unavailability to estimate the basic inputs like the number of transformers, substations, and the distribution network extension necessary to perform a DEA exercise.
Before Privatization/Reform After Privatization/Reform
Regional
Market Acronym Utility Name Acronym Utility Name
EEB EEB Empresa de Energia de Bogota CODENSA CODENSA S.A. ESP
EPM EPM Empresas Publicas de Medellin EPM Empresas Publicas de Medellin
CVC EMCALI Empresas Municipales de Cali EMCALI Empresas Municipales de Cali E.S.P
ELECTRANTA Electrificadora del Atlantico
ELECTROCESAR Electrificadora del Cesar
GUAJIRA Electrificadora de la Guajira
ELECMAG Electrificadora del Magdalena
ELECTRICARIBE Electrificadora del Caribe S.A. E.S.P
ELECTROBOL Electificadora de Bolivar S.A
CORDOBA Electrificadora del Cordoba S.A
CORELCA
SUCRE Electrificadora de Sucre S.A.
ELECTROCOSTA Electrificadora de la Costa Atlantica S.A.
E.S.P.
CEDELCA Centrales Eléctricas del Cauca CEDELCA Centrales Eléctricas del Cauca S.A E.S.P
CEDENAR Centrales Eléctricas de Nariño CEDENAR Centrales Eléctricas de Nariño S.A E.S.P
CENS
Centrales Eléctricas Norte de
Santander CENS
Centrales Eléctricas Norte de Santander S.A. E.S.P
CHEC Central Hidroelectrica de Caldas CHEC Central Hidroelectrica de Caldas S.A E.S.P
ELECTOLIMA Electrificadora del Tolima TOLIMA Electrificadora del Tolima S.A E.S.P
ESSA Electrificadora de Santander S.A ESSA Electrificadora de Santander S.A E.S.P
ICEL
HUILA Electrifidadora del Huila S.A HUILA Electrifidadora del Huila S.A E.S.P
Second, the study sample is representative due to its high share within the entire power sector. The sample represents on average 54% of commercial demand, 75% of total customers, 70% of industry direct employment, and around 80% of industry fixed assets value. Before the reform the last indicator exhibit lower levels because the vertically integrated structure of the companies, while after 1998 integrated utilities have to keep separate records by business activity. The study sample share on the industry has increased over time and has become more representative of the industry.
T
ABLE3
S
TUDY SAMPLE CHARACTERISTICSBY PERIODNotes: Value series in millions of current pesos Source: FEN (1996), SIVICO (1997-2001)
2.2 D
ATAE
NVELOPMENTA
NALYSISThe general approach to measure firm productive efficiency is through non-parametric lin-ear programming Data Envelope Analysis (DEA) algorithm. The basic intuition in the mea-surement of a plant productive efficiency from DEA estimation is the following: consider a set of plants that use different combinations of inputs to produce a given unit of an homogeneous output (electricity fits concept). If every plant is producing efficiently, all are in best practice isoquant. In the case that one plant is demanding more inputs in order to produce that unit of output, we are able to say that the plant is inefficient relative to the best practice isoquant.
DEA uses a sequence of linear programming problems to construct the best practice (cost or production) frontier for a given a technology, in order to compute efficiency measures. Technical inefficiency is measured as the ratio of the radial distance from the origin to the combination of input usage in an input space and the radial distance from the origin to the frontier or best practice frontier, which is built from the input combinations of the remaining group of firms which are considered efficient (i.e. pair wise input - one output in an Cartesian plane). This ratio will take a value between zero and one. If a plant has an efficiency score of 1, it is technically efficient. If the score is less than 1 then the plant is inefficient. For
in-Number of Employees Commercial Demand (GWh)
Periods Industry Sample Sample Share Industry Sample Sample Share
1985-1989 21,253 17,000 0.7999 29,302 17,533 0.5985 1990-1993 22,245 18,213 0.8197 34,755 21,218 0.6109 1994-1997 20,866 16,456 0.7882 42,250 22,872 0.5435 1998-2001 15,043 10,984 0.7275 42,863 24,014 0.5607
Average 19,852 15,663 0.7084 37,292 21,409 0.5318
Number of Users Total Fixed Assets (Millions $)
Periods Industry Sample Sample Share Industry Sample Sample Share
1985-1989 4,121,812 3,198,773 0.7766 1,875,327 1,199,751 0.6398
1990-1993 5,345,779 4,095,942 0.7663 5,166,010 3,642,329 0.7051
1994-1997 6,503,943 4,996,946 0.7682 9,653,314 7,715,436 0.7993
1998-2001 7,837,579 6,005,516 0.7667 16,666,786 14,372,504 0.8623
stance if plant B has a score of 0.8 and plant A has a score of 1, given they are over the same radial measure of efficiency, plant B is 20% inefficient relative to the production frontier and Firm A. That is, if plant B uses its inputs as plant A, then she would increase its output in 20%. This measurement is called non-parametric input-oriented efficiency scores.8
The advantages and disadvantages of using DEA over stochastic estimation in frontier analysis to measure efficiency are well known in the literature.9 Specifically in our work, DEA suits our
needs of efficiency estimation against stochastic frontier (SF) for several reasons. First, DEA is directly aimed to frontier and efficiency estimation, rather than a central or biased tendency as in SF measures. Second, there is no a priory assumption on the analytic form of the production function. Third, is suitable for measuring technical efficiency in multi-input/output production process. Forth, allows the use of environmental variables or variables not directly included into the production function but have effects on the input/output usage. Fifth, the determination of type of returns and its effect on efficiency is straightforward. But also DEA imposes some shortcomings in our work. First, DEA results are sensitive to errors in the data, inclusion and exclusion of observations and variables, and model specification. Second, the relationship among the number of units as-sessed and the number of input/output variables used, also have influence on the efficiency results. These disadvantages of the methodology are addressed in different ways in our study.
On the other hand, stochastic frontiers allow for an error term in the measurement of effi-ciency and assume a specific functional form for the underlying technology. This last feature becomes important when the Decision Making Unit (DMU) is a profit maximizing unit and the researcher knows input prices in order to estimate plant overall economic efficiency. A stochas-tic error also becomes important when output or productivity is subject to external shocks. There are different problems in using stochastic frontiers. First, efficiency scores are sensitive to the assumption regarding the distributional form of the error term (Green (1980)). Second, the usage of flexible production/cost functions, which might approximate a flexible technol-ogy, is costly in terms of degrees of freedom and the large number of parameters needed in the maximum likelihood function. Third, comparing with DEA, the error term usually “absorbs” most of the inefficiency leaving few magnitudes attributable to pure technical inefficiency. Finally, stochastic frontiers does not allow for multiple efficient firms as DEA does, leaving no space for idiosyncratic differences that may suggest two different firms are efficient given its own characteristics (Cubbin and Tzanidakis (1998)).
2.3 M
ALMQUIST PRODUCTIVITYINDEXOne advantage of our data is that given its panel structure allows us to undertake productivity analysis by means of Malmquist productivity indices (MPI). Figure 1 illustrates the case when there is a productivity improvement without technological change, in an input oriented sense; this is input reduction given an output level. We have an efficient frontier made up of efficient
combina-8 The literature of DEA as well as their applications is extensive. The following references provide a good
introduc-tion and reviews on the topic: Fried, et al. (1993), Coelli, et al. (1998),and Thanassoulis (2001).
9 For a basic discussion of the issue see Pollit (1995) and Coelli, et al. (1998). Further evidence on the estimation of
tions of inputs X1,2 by firms A to E Technical inefficiency in time t for DMU Gt is given by the
ratio of the radial distances OU and OGt, and in time t+1 is given by the ratio of OV and
1
t
OG+ ; where U and V are the hypothetical input combinations that would make DMU G effi-cient for in each period considered.10 Change in the productivity index is the ratio of both measures
of efficiency or its change in input usage between time t and t+1 to become totally efficient:
1
1
t
t t
OU OV
PI
OG OG +
+
= (1)
Firm productivity change under this setup is equal to the shift on the radial distance from period t to t+1, reflecting the fact that new input combinations can eliminate technical
ineffi-ciency.
Following the case for no technological change, Figure 2 illustrates the case when there is technological change, implied by the shift in the production frontier from Q0 to Q1. MPI for DMU G is written as the geometric mean of productivity or input usage evolution in each
period. First against Qt and then against Qt+1, as the ratio of the corresponding measures
MPI is defined as the geometric mean of both effects.
F
IGURE1
P
RODUCTIVITYINDEXFORTHECASE OFNOTECHNICALCHANGE1 0 Formally this is the assumption that there is a convex combination of production plans that also belongs to the
constructed production set; a mathematical and economic assumptions for DEA estimation. A detailed presenta-tions of this assumppresenta-tions and variapresenta-tions see Tulkens and Eeckaut (1995).
V
E D
C B A X1
U
O
Gt
X2 Gt+1
Q(X1; x2)
F
IGURE2
P
RODUCTIVITYINDEX FORTHECASEOFTECHNICALCHANGESource: (Thanassoulis, 2001)
According to Figure 2 the MPI is given by the following equation
1 1 1 1 t t t t t t t t OV OV OG OG MPI OU OU OG OG + + + + = × (2)
Equation (2) can be written as Equation (3). In this formulation the MPI is decomposed in two terms where an industry level productivity change is observed, called “boundary shift effect”11
and firm level productivity change, called “catch-up effect” . The first one shows the radial dis-tance between the frontiers from period t to t+1. The second component shows the radial distance for a given DMU to the frontier at t+1 relative to the distance to the frontier at t.
1 0.5
1
1 1
Boundary shift component Catch up component
t
t t t
t t t
t
OV
OG OU OV
MPI
OU OU OV
OG + + + + = × ×
(3)
1 1 Our presentation of MPI is taken from Thanassoulis (2001) and Coelli, et al. (1998). A formal derivation of the MPI
can be found in Caves, et al. (1982) and its standard presentation as a geometric mean is due to Färe et al (1994). O At+1 X2 Bt+1 Ut+1 Ct+1 Vt+1 Dt+1 Et Gt+1 Dt Ct Ut Vt At G
t
Qt+1 (X1; X2) Qt (X1; X2)
[image:13.612.124.474.131.332.2]Following the interpretation of Färe, et al. (1994), equation (3) says that changes in productiv-ity at firm/DMU level are the cross product of gains in productive efficiency relative to industry's benchmark and, a technical change component as a result of innovation. Equation (3) is imple-mented in our DEA's measurement exercises straightforward under a constant returns to scale, input-oriented linear programming setup. Equation (2) implies four linear programming programs with respect to periods t and t+1 for each DMU: i) two linear programming problems regarding
their own time-frontiers and ii) two linear programming models crossing time frontiers.12
3. P
ERFORMANCE ANALYSIS ANDDEA
MEASURES3.1 N
ON-
PARAMETRIC TESTS ON FINANCIAL INDICATORSThis section reports the results on performance for the power distribution companies and the measurements of efficiency scores across them. The first exercise relies on testing struc-tural changes in means and medians before and after the reform for each performance indicator. The analysis follows the approach of firm assessment used in privatization and ownership studies such as Megginson, et al. (1994), La Porta and López-de-Silanes (1999) and Dewenter and Malestra (2001) who focuses on utilities' direct measures of profitability, efficiency, assets and investments, and sales before and after changes on ownership. The changes in means pro-vide the direction of the effect the reform might have caused on firm performance. Changes in medians indicate how successful the reform was. From the statistical point of view the idea is to study the reform as an experiment where the year 1994 is a breaking point applied to matched samples, and test the null hypothesis if the reform was effective. This test is non-parametric because the data is ordered according to events belonging to individuals from different groups. Hence, the experiment is considered effective if the observed change is statistically robust and matches the expected one. The dataset is a balanced panel of the 12 utilities for the 1985-2001 period with 108 and 96 observations (N) before and after the reform, respectively.
Table 4 reports the results of the raw data and adjusted indicators.13 The latter are ratios
relative to EPM indicators. EPM was chosen as the control group since historically it has been the most efficient utility nationwide, making it an appropriate benchmark.14 Several comments
result from the raw indicators measures. First, there is general improvement in the profitability indicators. The mean (median) of net income to sales ratio rose from -11% (-2.4%) to 4.2% (3.5%) after the reform. That increase was sharper if one considers fixed capital returns. The mean (median) of operating income to PPE ratio increases from 40% (23%) to 51% (45%), and the mean (median) of operating income to net worth rose from 56% (33.6%) to 81% (48.7%). The above changes were significant at 1% percent levels.
Second, the performance in operating efficiency mirrors the profitability indicators. For in-stance, the mean (median) of sales to plant, property and equipment (PPE) ratio grew 43%
1 2 For more details see Thanassoulis (2001).
1 3 Appendix 1 reports the definition and methodology of each indicator.
(67%) after the reform, and the sales to employee ratio changed in 65% (75%). The above changes are significant at 1% levels. Therefore, profitability gains are explained by the better performance in operative efficiency. There were several sources that might have had an in-fluence on such result, such as the reform and the new regulation requiring utilities to fulfill financial, efficiency, and quality service targets. In particular, since 1995 the regulatory com-mission has annually set directions to improve utility performance. The covered time span after the reform for the study sample, allows us to assert that plant restructuring has taken place in those companies that underwent such processes. The most noticeable cases of firm restructuring were the privatization of the CORELCA holding and the EEB that took place from 1996 to 1998.15
Employment cuts and new investment were not sources of operative efficiency gains according to the results reported in Table 4. The mean (median) of total employment de-creased 15% (16.5%) after the reform that is an average of 2.1% per year. The average plant size moved from 835 employees per utility before the reform to 718 employees after the reform. The mean (median) of capital stock, which is proxied by each utility PPE, increased on average in 8% (16%) after the reform that is equivalent to a growth rate of 1% (2%) per year.16 The PPE to labor ratio also exhibited a positive change. Nonetheless, the above changes
were not statistically significant.
Third, final sales pushed labor as well as capital productivity. The three output indicators show important improvements. The mean (median) of total sales at constant 1998 prices grew 50% (41.5%) implying an annual rate of 6.3% (5.2%) per year. Total sales in GWh increases by 2.8% per year after 1994 and sales to residential users did so at 3.2% per year. The above changes are significant at 1% and 10% levels. The above outcome was not induced by an increase on aggregate commercial electricity demand, which experienced a slowdown after 1995.17
The effect came from a reduction in the non-technical losses, which implied better invoicing and tariff collection processes by the utilities. The average change in the technical loss index was 1.7 points after the reform. However, if one considers the three largest utilities there is an effective reduction of 1.5 points in the loss indices.18 The increase in residential tariffs also
contributed to boost the utilities' sales. The mean (median) increased by 33% (30%) in the post reform period. That is an annual rate of 4.1% (3.7%). In contrast, there were no statistically significant changes in industrial tariffs.
1 5 A complete efficiency analysis of the privatized power generation utilities is in Pombo and Ramírez (2003). The
main findings regarding the sources of efficiency gains until 1998 were: i) privatization induced new investment in incumbent firms, ii) employments cuts were not significant, and iii) there were positive efforts in reducing power losses.
1 6 There is a caveat to bear in mind concerning PPE series. The chain for EEB only accounted the power distribution
assets represented in the new company of CODENSA after 1997. We run a t-test and z-test without this utility and the changes in means were positive (6%) but no statistically significant.
1 7 Total aggregate demand for electricity grew on average 5.2% per year for the 1985-1994 period, while for the
1995-2001 period electricity demand grew on average at 1.3% per year.
T
ABLE4
T
ESTON CHANGESIN PERFORMANCE: R
AWAND ADJUSTEDINDICATORSNon-adjusted Adjusted
N N Mean before Mean after t-stat N N Mean before Mean after t-stat
Variable
Before After Median before Median after z-stat Before After Median before Median after z-stat
I. Profitability
Net Income / Sales 108 96 -0.1104 0.0416 -3.30 a 99 88 -0.6651 -0.0535 -3.557 a
-0.0239 0.0351 -2.45 a -0.1998 0.0489 -2.395 a
Operating income / PPE 108 96 0.3998 0.5140 -2.19 a 99 88 2.2791 3.6118 -3.374 a
0.2288 0.4515 -4.49 a 1.3208 2.6409 -4.704 a
Operating income / Net Worth 108 96 0.5600 0.8185 -2.39 a 99 88 1.9047 6.1910 -4.139 a
0.3365 0.4874 -2.81 a 1.2121 2.8277 -6.743 a
II. Operating Efficiency
Log (sales/PPE) 108 96 -1.2714 -0.8447 -4.24 a 99 88 0.7210 0.4547 4.300 a
-1.4748 -0.7956 -4.49 a 0.8374 0.4270 4.415 a
Log (sales / employees) 108 96 4.7201 5.3771 -7.07 a 99 88 0.7740 0.8449 -4.910 a
4.5179 5.2698 -6.63 a 0.7512 0.8285 -5.294 a
Loss index 108 96 0.2104 0.2270 -1.70 a 99 88 1.5934 1.6637 -0.891 c
0.1870 0.2199 -2.03 a 1.4343 1.5743 -0.866 c
Loss index1 27 24 0.1817 0.1750 1.60 b
0.1626 0.1593 1.36 c
III. Labor
Log (employees) 108 96 6.7273 6.5777 1.64 c 99 88 0.9505 0.9428 0.539 c
IV. Assets
Log (PPE) 108 96 12.7188 12.7995 -0.04 c 99 88 0.8527 0.8389 1.673 b
12.4484 12.6076 -0.28 c 0.8395 0.8362 1.653 b
Log (PPE / Employees) 108 96 5.9915 6.2119 -1.13 c 99 88 0.7630 0.7504 1.395 c
V. Output
Log (Sales $) 108 96 11.4474 11.9549 -3.35 a 99 88 0.8696 0.8950 -2.202 a
11.3440 11.7588 -3.31 a 0.8635 0.8866 -2.293 b
Log (Sales residential GWh) 108 96 6.1939 6.4528 -2.02 a 99 88 0.7990 0.8234 -1.495 b
5.9834 6.2610 -2.18 a 0.7724 0.8049 -1.732 b
Log (Sales total GWh) 108 96 6.8552 7.0775 -1.55 b 99 88 0.8043 0.8147 -0.622 c
6.6472 6.9475 -1.74 b 0.7868 0.8076 -0.950 c
VI. Tariffs
Log Residential tariffs 108 96 4.1688 4.5052 -12.62 a 99 88 1.0409 1.0313 1.419 c
4.1758 4.4692 -10.33 a 1.0395 1.0318 2.025 a
Log Industrial tariffs 108 96 4.8054 4.7924 0.40 c 99 88 1.0192 1.0550 -4.616 a
4.7858 4.7789 0.21 c 1.0138 1.0349 -3.895 a
Notes: a. significant at 5%, b. Significant at 10%, c. Non-significat significance Value series are at 1998 prices and deflated by CPI
Loss index1: includes only the three larger systems: EEB/CODENSA, EPM, EMCALI
Includes the following 12 EDCs: CEDELCA, CENS, CEDENAR, CHEC, EPM, CODENSA/EEB, EMCALI, ELECTROCOSTA, ELECTRICARIBE, ESSA, HUILA, TOLIMA
The industry-adjusted indicators show that profitability ratios improved. In most cases the change of means and medians doubles with respect the control group. This outcome as well as the improvement in the raw indicators suggests positive changes in managerial procedures oriented to the financial recovery of the utilities. The adjusted indicators for operative efficiency exhibited mixed results. On one hand the mean (median) capital productivity fell by -0.26% (-0.41%), but on the other the mean and median of labor productivity increased both by 7% relative to EPM after the reform. This finding suggests that EPM rationalized capital spending relative to their competitors. Also the privatized utilities were either capitalized before or after the equity transfer to private investors. For instance, the CORELCA subsidiaries were capitalized in 1997 by the government before their privatization. This caused PPE real value to double by the end of 1998 in these utilities.19 The above changes were significant at 1 percent level. On the other hand, input
levels of capital stock, employment and capital-labor ratios did not experience structural changes after the reform. The only significant change, at 10 percent level, was the mean of PPE level that decreased from 0.85 to 0.83 relative to the control group.
Output and sales increased in all cases reflecting positive efforts in invoicing and tariff collection. In particular, residential sales and total value sales gained on average 3 percentage points relative to EPM’s indicators. Higher tariffs contributed partially to this result. The mea-surements show that the mean (median) of the relative industrial tariff grew by 3.6% (2%) after the reform. This change is significant at 1 percent.
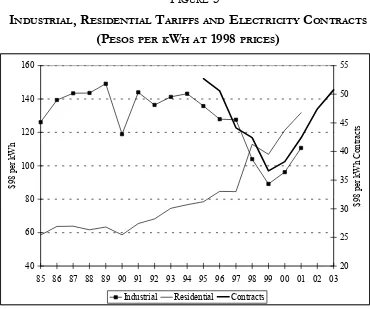
Table 5 reports the average tariffs for industrial and residential users by each EDC. The 1994 reform changed the trend in pricing behavior. Industrial users are better off after the reform. Prices dropped 24% since 1997, which is an annual average of 4.8% per year. This outcome is the result of the setting up of the wholesale electricity market for contracts transac-tions since mid 1995. Figure 3 describes residential and industrial tariffs and the series of electricity contract mean prices.20 Residential users were affected by higher tariffs. The slope in
the tariff trend became steeper after 1996. Real tariffs rose on average at a rate of 10% per year for the 1997-2001 period. The three largest utilities drove industry price setting. Among them it is clear that the former EEB, did an effort to reduce industrial tariffs and non-technical power losses. But on the other hand residential tariffs rose in 2.2 times after company's privatization in 1997.21 Some utilities that increased both tariffs steadily since 1985, turned out to be the bad
performers in terms of productive efficiency from the DEA analysis. The next section turns attention to the analysis of technical efficiency and productivity measures for the 12 power distribution companies under study.
1 9 ELECRICARIBE’s plant, property, and equipment rose from US$ 163 to US$ 308 millions in 1998 at constant
prices of that year. ELECTROCOSTA did from US$ 90 to US$ 302 millions.
2 0 Notice the U-shape of contract prices. The first generation of purchase power contracts had a time span from 3 to
5 years. Clearly the inflexion point in mid 1999 is a consequence of the renewal of former contracts, the end of the second El Niño cycle of the nineties that shifted up spot prices up during 1997-1998, and the security deterioration regarding transmission towers blow-ups. Those elements changed agent’s price expectations toward an increasing trend in electricity prices.
21 The market share of EEB is on average 28% within the study sample and 15% with respect to nationwide
T
ABLE5
I
NDUSTRIAL ANDR
ESIDENTIAL TARIFFS BYCOMPANY AND FIVE-
YEARPERIODSSources; SINSE, CREG, SSPD
Notes: The largest utilities are EEB, EPM and EMCALI
3.2 DEA
EFFICIENCY SCORES, M
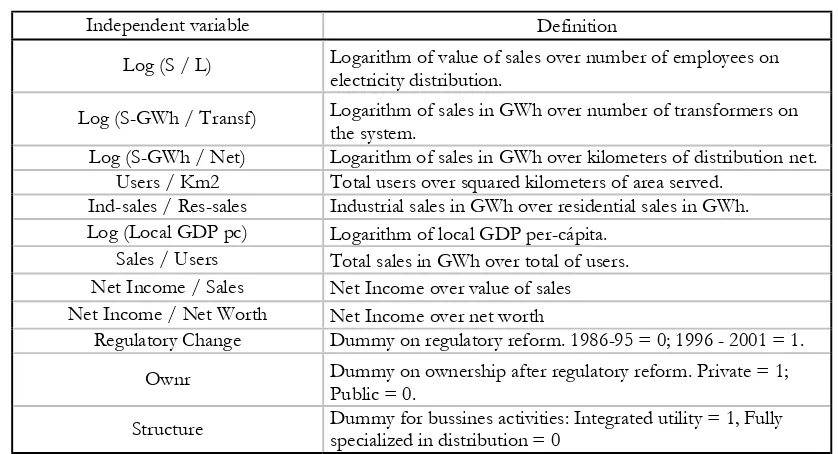
ALMQUISTPRODUCTIVITY INDEX AND POLICYEFFECTIVENESSThe measurement of technical efficiency for power distribution through non-parametric linear programming poses the problem of defining correctly the production function characterization of the electricity distribution industry; several studies on efficiency, performance and productivity in electricity distribution tackle this problem classifying variables within inputs, output and environ-mental variables. Hjalmarsson and Veiderpass (1992) do so using DEA to estimate Malmquist Productivity indices in Sweden and Førsund and Kittelsen (1998) in Norway; Miliotis (1992) uses DEA analysis to assess effects of policy and ownership in efficiency for Greece, as well as Bagdadioglu, et al. (1996) for Turkey, Pacudan and de Guzman (2002) for the Philippines, finally Agrell, et al. (2003) for Scandinavia offers a insightful discussion of DEA estimation for electricity distribution.22
Looking for an appropriate definition of a DEA model for power distribution and in order to obtain comparable results with the existing literature in the topic we have classified the vari-ables into inputs, outputs and environmental ones following Neuberg (1977) and similar stud-ies previously quoted. Several definitions of a proper DEA model for electricity distribution can be formulated, ranging from the whole consideration of inputs/outputs/environmental variables to simply defining as input the number of employees and output the number of
cus-2 cus-2 Filippini, et al. (2004) undertakes a very similar study to ours using a stochastic frontier estimation. Industrial Tariffs
CEDELCA CEDENAR CENS CHEC EEB E-CARIBE E-COSTA EPM
1985-90 120.7 118.1 94.8 91.6 191.8 134.0 126.3 109.2
1991-96 120.8 155.1 127.3 120.0 153.7 153.5 155.7 119.6
1997-01 143.2 191.5 112.4 89.3 114.0 118.0 113.4 85.9
EMCALI ESSA HUILA TOLIMA Three
largest
Weighted
average Price change
1985-90 107.7 123.3 118.3 103.3 136.3 136.8
1991-96 121.0 124.1 152.9 120.0 131.4 138.1 0.0096
1997-01 88.2 115.4 141.1 101.4 96.0 105.5 -0.2359
Residential Tariffs
CEDELCA CEDENAR CENS CHEC EEB E-CARIBE E-COSTA EPM
1985-90 69.1 59.7 63.1 55.1 55.6 71.0 70.4 54.4
1991-96 68.4 59.4 73.7 71.1 73.3 80.0 68.1 67.3
1997-01 89.3 96.5 101.9 95.2 163.0 95.5 89.6 83.1
EMCALI ESSA HUILA TOLIMA Three
largest
Weighted
average Price change
1985-90 75.7 73.2 60.0 55.3 61.9 61.6
1991-96 89.6 80.6 80.0 78.8 76.7 74.7 0.2120
tomers, leaving the remaining variables exogenous to the utilities' output decision-making. The dual classification input/output/environmental variables come along with a suitable character-ization of the DMU functions. Focusing in electricity distribution if we take transformers and length of the power line network as inputs, the assumption is that those are control variables for each utility. In this industry the demand is endogenous to environmental variables such as: geographical dispersion, topography, population density, urban migration; which determine the utilities' new investment in power lines network, substations and transformers. Thanassoulis (2001) discusses the selection of variables and the definition of the input/output/environ-mental variables. In particular, he stresses that there must be some prior knowledge regarding the utility's operational characteristics. DEA itself imposes a constraint on the formulation of a final model, the use of a big number of inputs and outputs against a small number of DMU's assessed will bring most of the DMUs into the frontier leaving few for efficiency evaluation. Therefore, adopting a reduced model for efficiency assessment lowers the trade-off between relative efficiency and number of DMUs.
Table 6 presents the distribution into input / output / environmental variables for the esti-mated model. The output is represented by the energy sold in Gigawatts per hour (GWh), the input variables are: labor proxied by the number of employees in power distribution and com-mercialization, and capital proxied by number of transformers and length of the distribution network. The last two variables were not observed for the entire period and it was necessary to
40 60 80 100 120 140 160
85 86 87 88 89 90 91 92 93 94 95 96 97 98 99 00 01 02 03
$9 8 p er k W h 20 25 30 35 40 45 50 55 $ 9 8 per kW h C o nt ra ct s
Industrial Residential Contracts
F
IGURE3
I
NDUSTRIAL, R
ESIDENTIALT
ARIFFS ANDE
LECTRICITYC
ONTRACTS(P
ESOS PERKW
H AT1998
PRICES)
[image:19.612.119.489.93.402.2]rely on backward series extrapolation.23 The environmental variables are utility exogenous
vari-ables such as regional per capita GDP, power generating capacity, number of customers, and urban areas covered in Km2.
The data used in the DEA estimation comprised information for 12 DMUs in 17 years for a total of 204 observations; this data structure suggests a broad spectrum of DEA estimations. From estimating a year-by-year DEA to a timeless estimation considering every observation as an independent DMU, we call the former “cross-section DEA” and the latter a “pooled DEA”. Within this range it is also possible to run what is known as “window DEA” which consist of several DEA estimations which sample is defined by a growing or constant number of observations (keeping a balanced sample of DMU assessed). In our estimations we chose the extreme possibilities in the spectrum, that is the cross-section and the pooled DEA in order to avoid the issues of window procedures in DEA outlined in Asmild, et al. (2004), specially for the following Malmquist estimation.24As mentioned previously a small sample for cross-section DEA imposes limitations
to the methodology, this is why the cross section and pooled DEA offer a robustness test for our results. Bauer, et al. (1998) propose six consistency conditions that efficiency measures derived from different efficiency estimations should meet: i) Comparable distributional properties; ii) Similar efficiency rankings; iii) Similar best and worst practice institutions; iv) Reasonable stability over time estimation; v) Reasonable consistency with competitive conditions; vi) Reasonable consis-tency with standard non-frontier measures. Except for condition 5 the estimation results shown below meet these requirements comparing against different window and pooled DEA estimations for the model proposed in Table 6 and against an additional model where the same variables were used but the only variables classified as discretionary were employees and total customers.
T
ABLE6
M
ODELFORDEA
ESTIMATION INP
OWERD
ISTRIBUTION2 3 Appendix 2 explains the methodology and the base regression equations that supported the backward forecasts
applied to the number of transformers and power lines distance series.
2 4 The results for this additional estimation are quite similar to those presented here, for additional results and
consistency on Bauer, et al. (1998) check list see Taborda (2003).
2 5 We should recall that the expected technology in power distribution is a fixed coefficient constant return to scale
(CRTS) according to the peak-load model in Steiner (1957).
Table 7 summarizes the results of the efficiency scores of the DEA estimation under con-stant returns to scale and its decomposition into Variable Return to Scale (VRTS) and Scale Efficiency (SE).25 This decomposition is useful to find if the scale of operation becomes a
source of inefficiency for the firms and is obtained from equation (4).
Input Output
Discretionary variables Employees in power distribution and commercialization Total Sales (GWh)
Number Transformers Total customers
Power Lines Network (Kms.)
Environmental Regional GDP per-capita Urban area served
[image:20.612.87.530.462.541.2]CRTS =VRTS SE× (4)
Under the assumption of CRTS, DEA efficiency scores show that six out of the twelve electricity distribution companies are totally efficient. The lowest efficiency score corresponds to CHEC for 13 years and CEDELCA for 3 years. For the period under study four utilities exhibit VRTS meaning that they could reduce technical inefficiency through internal scale econo-mies by means of an increase in sales, customers or in area served. Four utilities present serious technical inefficiencies in power distribution according to these measurements: CEDELCA, CHEC, ESSA and HUILA, which exhibit decreasing trends. Moreover, their efficiency scores worsened after the reform. CEDELCA and CHEC ended up on average with scores equal or less than 40% in 2001, while ESSA and HUILA exhibited efficiency scores of 57% and 65% respectively. Such inefficiency is reflected by an operative scale problem illustrated by the scale efficiency parameter that by 2001 three of them had scales below of 71%. Those are utilities that serve medium-sized cities with low population density. In addition, these utilities show on average high financial and operating costs, high levels of non-technical losses in power distri-bution, and contraction in their regional per-capita consumption of electricity relative to the benchmark utilities.26 On the other hand, ELECTROCOSTA was only the case that showed an
efficiency improvement after its privatization in 1997 reaching efficiency scores of 1.
For yardstick regulation purposes (Shleifer (1985)), DEA output also suggests the frontier ref-erence DMU(s) the inefficient DMU should mimic in order to become efficient. We will concen-trate in the EDC that are stable frontier reference DMUs, which are several continuous years as reference DMU for the group of inefficient ones. EEB stand as a reference benchmark for all the inefficient EDC, specifically for ESSA, CHEC and HUILA for 14, 15 and 16 years, respectively; while EPM is reference for CEDELCA, CHEC, and ESSA for 7, 7 and 5 years, respectively. Finally, ELECTRICARIBE is reference for Huila, ESSA and CENS for 16, 16 and 8 years
Productivity measurement is carried out by means of Malmquist productivity indices (MPI), which complements the DEA efficiency analysis. According to equation (2). The measurement of efficiency scores for two-year periods across the sample of DMUs will yield three types of firms. The firs type, are the efficient DMUs in period t and t+1 who remain on the frontier. Their radial distance for each period will be equal to 1, there is no gain in “catch-up effect” but its productivity gain is reflected through the industry's boundary displacement or “boundary effect”. The second type are non efficient firms in both periods, but for period t+1 their inef-ficiency has been reduced, those firms are experiencing both effects, catch-up and boundary productivity improvements, they are closing their distance against the frontier in time t+1 and
at the same time are moving along with the frontier. Finally there is a third group of firms who lost relative efficiency at time t+1, from its observed efficiency level observed in t. Figure 4 and Table 8 report the results of the Malmquist productivity decomposition. For each utility the MPI is estimated by equation (2) based on the cross-section DEA estimations. The table
T
ABLE7
DEA
EFFICIENCYS
CORES- P
OWERD
ISTRIBUTIONC
OMPANIESpresents the average for two sub-periods, emphasizing the turning point created by the 1994 reform. The last two columns report the average of the 12 utilities under study, and the cumu-lative MPI indices that reflect the evolution of productivity levels across time.27
Three main comments arise from this exercise. First, the utilities used as benchmarks in the DEA analysis show small or negligible changes in their MPI indices. This is the case of EEB, EPM, EMCALI, ELECRICACARIBE, and TOLIMA.28 Every year these utilities are on the production
2 7 We choose to estimate year-by-year Malmquist index in order to avoid the problems related with Malmquist decomposition into catch up and boundary effects outlined in Asmild, et al. (2004).
2 8 The former three are the largest power distributors nationwide with an average market share above 60% within the study sample. They are the electricity distributors of the three largest cities in the country: Bogotá, Medellín, and Cali. Constant Returns to Scale
1986-1987 1988-1989 1990-1991 1992-1993 1994-1995 1996-1997 1998-1999 2000-2001
CEDELCA 0.71 0.76 0.87 0.78 0.72 0.58 0.67 0.34
CEDENAR 1.00 1.00 1.00 1.00 1.00 1.00 1.00 1.00
CENS 1.00 0.83 1.00 0.89 0.85 0.92 0.96 1.00
CHEC 0.55 0.56 0.62 0.49 0.45 0.52 0.40 0.40
EEB 1.00 1.00 1.00 1.00 1.00 1.00 1.00 1.00
ELECTRICARIBE 1.00 1.00 1.00 1.00 1.00 1.00 1.00 1.00
ELECTROCOSTA 0.91 0.96 1.00 0.97 0.98 1.00 1.00 1.00
EMCALI 1.00 1.00 1.00 1.00 1.00 1.00 1.00 1.00
EPM 1.00 1.00 1.00 1.00 1.00 1.00 1.00 1.00
ESSA 0.84 0.79 0.89 0.84 0.82 0.72 0.59 0.57
HUILA 0.91 0.72 0.92 0.83 0.69 0.92 0.69 0.65
TOLIMA 1.00 1.00 1.00 1.00 1.00 1.00 1.00 1.00
Variable Returns to Scale
CEDELCA 1.00 1.00 1.00 1.00 1.00 0.92 1.00 0.99
CEDENAR 1.00 1.00 1.00 1.00 1.00 1.00 1.00 1.00
CENS 1.00 1.00 1.00 1.00 1.00 1.00 1.00 1.00
CHEC 0.55 0.57 0.64 0.50 0.45 0.53 0.48 0.56
EEB 1.00 1.00 1.00 1.00 1.00 1.00 1.00 1.00
ELECTRICARIBE 1.00 1.00 1.00 1.00 1.00 1.00 1.00 1.00
ELECTROCOSTA 0.97 1.00 1.00 0.97 1.00 1.00 1.00 1.00
EMCALI 1.00 1.00 1.00 1.00 1.00 1.00 1.00 1.00
EPM 1.00 1.00 1.00 1.00 1.00 1.00 1.00 1.00
ESSA 0.86 0.79 0.89 0.84 0.82 0.73 0.61 0.66
HUILA 0.97 0.80 1.00 0.89 0.77 1.00 0.94 1.00
TOLIMA 1.00 1.00 1.00 1.00 1.00 1.00 1.00 1.00
Scale efficiency
CEDELCA 0.71 0.76 0.87 0.78 0.72 0.62 0.67 0.35
CEDENAR 1.00 1.00 1.00 1.00 1.00 1.00 1.00 1.00
CENS 1.00 0.83 1.00 0.89 0.85 0.92 0.96 1.00
CHEC 1.00 1.00 0.97 0.99 1.00 0.98 0.84 0.71
EEB 1.00 1.00 1.00 1.00 1.00 1.00 1.00 1.00
ELECTRICARIBE 1.00 1.00 1.00 1.00 1.00 1.00 1.00 1.00
ELECTROCOSTA 0.94 0.96 1.00 1.00 0.98 1.00 1.00 1.00
EMCALI 1.00 1.00 1.00 1.00 1.00 1.00 1.00 1.00
EPM 1.00 1.00 1.00 1.00 1.00 1.00 1.00 1.00
ESSA 0.98 1.00 1.00 1.00 1.00 0.99 0.96 0.87
HUILA 0.93 0.89 0.92 0.93 0.91 0.92 0.74 0.65
TOLIMA 1.00 1.00 1.00 1.00 1.00 1.00 1.00 1.00
frontier and are the source behind overall efficiency boundary shifts. On average, boundary changes were 4.8% per year after the reform in contrast to the 3.2% average for the pre-reform period. Second, there were no improvements in the utilities' efficiency catch-up. Except for one case, all non-benchmark DMUs exhibit values less than one, meaning that those utilities are farther from their boundary after the reform. Third, the source of productivity is mainly driven from the sharp increase observed in the boundary effect after the reform. Moreover, the most inefficient utilities present the higher boundary shifts rates after the reform. For instance, CEDELCA had a 23% annual average boundary shift after 1995, followed ESSA with 13.8%, and HUILA with 7.7%.
The above findings confirm that there were important productivity gains in the power distri-bution system after the 1994 regulatory reform, explained by a strong and positive evolution of the largest utilities placing a veil of good indicators over the less efficient firms. The above results are conclusive in the direction that the overall gain in productive efficiency came from changes from the benchmark utilities and there was no effort for low performers to catch-up to the industry's average efficiency levels; basically the same result observed in performance analysis where big EDC outperformed over the sample. The assessment of policy effectiveness is an important issue analyzing competition policy and market reforms. DEA allows evaluating effi-ciency within a group of DMU's working under different policy regimes.
T
ABLE8
M
ALMQUIST PRODUCTIVITYDECOMPOSITION BYP
OWERD
ISTRIBUTIONC
OMPANYTotal Malquist Index
CEDELCA CEDENAR CENS CHEC EEB E-CARIBE E-COSTA EMCALI EPM ESSA HUILA TOLIMA Sample average
MPI Levels 1987-1994 1.075 1.001 1.050 1.057 1.000 1.000 1.021 1.002 1.000 1.063 1.050 1.000 1.027 109.183
1995-2000 1.050 1.000 1.044 1.051 1.001 1.000 1.019 1.000 1.005 1.056 1.050 1.000 1.023 130.793
Average 1.064 1.001 1.048 1.054 1.001 1.000 1.020 1.001 1.002 1.060 1.050 1.000 1.025 118.445
Std deviation 0.088 0.003 0.071 0.079 0.002 0.000 0.034 0.005 0.008 0.097 0.099 0.000 0.027 13.564 Boundary shift
CEDELCA CEDENAR CENS CHEC EEB E-CARIBE E-COSTA EMCALI EPM ESSA HUILA TOLIMA Sample average
MPI Levels 1987-1994 1.077 1.001 1.065 1.081 1.000 1.000 1.012 1.002 1.000 1.067 1.082 1.000 1.032 110.204
1995-2000 1.230 1.000 1.028 1.087 1.001 1.000 1.011 1.000 1.005 1.138 1.077 1.000 1.048 145.399
Average 1.143 1.001 1.049 1.084 1.001 1.000 1.012 1.001 1.002 1.097 1.080 1.000 1.039 125.287 Std deviation 0.286 0.003 0.096 0.134 0.002 0.000 0.021 0.005 0.008 0.138 0.178 0.000 0.063 23.247
Catch-up
CEDELCA CEDENAR CENS CHEC EEB E-CARIBE E-COSTA EMCALI EPM ESSA HUILA TOLIMA Sample average
MPI Levels 1987-1994 1.007 1.000 0.996 0.987 1.000 1.000 1.009 1.000 1.000 1.003 0.986 1.000 0.999 100.717
1995-2000 0.948 1.000 1.022 0.980 1.000 1.000 1.008 1.000 1.000 0.948 0.999 1.000 0.992 97.452
Average 0.982 1.000 1.007 0.984 1.000 1.000 1.009 1.000 1.000 0.979 0.992 1.000 0.996 99.318
Std deviation 0.242 0.000 0.118 0.120 0.000 0.000 0.039 0.000 0.000 0.140 0.160 0.000 0.046 4.710
Source: Author’s calculation
The procedure is called by Thanassoulis (2001) as “disentangling managerial and policy efficiency”, an application of the work of Charnes, et al. (1981); which implies a window DEA analysis for two periods chosen on the change of regulation and industry structure. From a benchmarking regulation perspective, disentangling managerial effect from the regulatory ef-fect becomes a useful and innovative application of the methodology to assess policy effec-tiveness, in our case to assess regulatory change on public utilities.29
The intuition behind disentangling managerial from policy efficiency is to separate the effects induced in efficiency from variables directly related to the DMU's activity from idio-syncratic variables affecting the industry, in our case the introduction of a new industry and regulatory framework. In order to apply the procedure we have defined two policy groups, according to the pre and post reform periods, all the estimations were done grouping the data in a “pooled DEA” in order to introduce the changes in the industry as a policy for a homoge-neous set of firms.30 The approach involves a two-step procedure. The first stage consists in
obtaining DEA efficiency scores for each policy group (pre and post reform). Therefore, each inefficient DMU in each policy group is brought to the frontier using the feasible com-bination of inputs that would take them to become totally pareto efficient. In the first stage we have observed inefficiency for DMU into its policy group and then we have eliminated the inefficiency concerning the management under the specific policy, in our case the inefficiency under pre and post regulatory reform assigned to management of EDC. Afterwards the second step starts by pooling all units from both policies, and run a new DEA. Any inefficiency scores obtained is attributable to the corresponding policy. Summing up, at the first stage managerial inefficiency is eliminated by taking all units under a specific policy to the frontier, at the second stage policy inefficiency is observed given that there is no other source, besides that the DMU's are working under a new set of constraints, i.e. new regulatory and industry structure.
Table 9 summarizes the results of this exercise, which are very consistent with those re-ported in our performance, efficiency and productivity analysis. It is undeniable the positive effect on efficiency because the reform reducing drastically any remaining inefficiency. Accord-ing to Table 9, nine out of twelve utilities reduced, on average, 6 points its inefficiency because of the reform. The remaining units stayed fairly constant. Again we have a set of EDC which efficiency was strongly and positively affected by regulatory reform, while the already efficient ones kept its position.
The next section turns attention to modeling efficiency scores under constant and variable return to scale as functions of utility characteristics, ownership structure, and regulatory policy variables for the study sample of power distribution companies.
2 9 To the best of our knowledge there are no available studies using this procedure to assess the effectiveness of
regulatory change on public utilities. For a discussion of choosing the window length in DEA, see Asmild, et al. (2004).
3 0 In other words, data is staked according to firm-year observations for each of one the 12 utilities before and after
F
IGURE4
M
ALMQUISTP
RODUCTIVITYI
NDEXL
EVELS(1986=100)
80 90 100 110 120 130 140 150 160 170 180
1987 1988 1989 1990 1991 1992 1993 1994 1995 1996 1997 1998 1999 2000
Index
MPI Boundary-Shift effect Catch-up effect
Source: Authors' calculations based on inputs/output and environmental variables dataset used in Table 7
T
ABLE9
M
ANAGERIAL ANDR
EGULATORYP
OLICYE
FFICIENCYPolicy inefficiency
1986-1994 1995-2001
CEDELCA 1.0000 0.9988
CEDENAR 1.0000 0.9976
CENS 0.9353 0.9733
CHEC 0.8782 0.9790
EEB 0.9638 0.9827
ELECTRICARIBE 0.9979 0.9998
ELECTROCOSTA 0.8590 0.9811
EMCALI 0.9293 0.9961
EPM 0.9561 0.9824
ESSA 0.8486 0.9775
HUILA 0.9991 1.0000
TOLIMA 0.9957 0.9871
Industry average 0.9469 0.9880
Source: Authors’ calculations
[image:25.612.121.490.88.381.2]