Relation of osteocalcin with insulin resistance and
histopathological changes of non alcoholic fatty liver disease
Rocio Aller,*,** Jose Luis Perez Castrillon,* Daniel Antonio de Luis,* Rocio Conde,* Olatz Izaola,*Manuel González Sagrado,* María Concepción Velasco,* Tomas Alvarez,*,** David Pacheco*
*Center of Investigation of Endocrinology and Clinical Nutrition,
Medicine School and Unit of Investigation. Hospital Rio Hortega. University of Valladolid. Valladolid Spain. ** Hospital Clinico Universitario. Valladolid, Spain.
ABSTRACT
Background. Osteocalcin is a hormone with a complex cross-talk between adipose tissue and the skeleton. The aim of the present study was to explore the relation of osteocalcin with histopathological changes of NALFD patients. Subjects. A population of 69 NAFLD patients was analyzed. A liver biopsy was realized. Weight, fat mass, body mass index, basal glucose, insulin, insulin resistance (HOMA), total cholesterol, LDL-cholesterol, HDL-LDL-cholesterol, triglycerides and osteocalcin levels were measured. Results. Patients were divided in two groups by median osteocalcin value (11.34 ng/mL), group I (patients with the low values) and group II (patients with the high values). Only liver fibrosis frequencies were different between groups (group I: 22.9% vs group II: 9.4%; p < 0.05). Patients in group I had higher levels of glucose (115.6 ± 28.1 mg/ dL vs. 103.7 ± 24.3 mg/dL; p < 0.04), HOMA (4.6 ± 3.1 units vs. 3.6 ± 1.8 units; p < 0.04), weight (102.9 ± 32.4 kg vs. 85.9 ± 16.8 kg; p = 0.002) and body mass index (38.3 ± 11.4 kg/m2vs. 30.1 ± 5.7 kg/m2; p = 0.001))
than patients in group II. Osteocalcin was inverse correlated with glucose (r =-0.4; p = 0.002) and HOMA (r = -0.3:p = 0.01). Conclusion. Osteocalcin is associated with liver fibrosis. However, this association disap-peared in a multivariate analysis, and HOMA remained as an independent factor.
Key words. Adipose Tissue. Non Alcoholic Fatty Liver Disease. Obesity. Osteocalcin.
Correspondence and reprint request: Dr. D. A de Luis Professor Associated of Nutrition
Executive Director of Institute of Endocrinology and Nutrition. Medicine Schooll. Valladolid University.
C/Los perales 16 Simancas 47130. Valladolid Spain Phone: 34983420400. E-mail: [email protected]
Manuscript received: October 21, 2010. Manuscript accepted: December 11, 2010. INTRODUCTION
Epidemiologic evidence of the rising tide of obesi-ty and associated pathologies has led, in this cen-tury, to a dramatic increase of research on the role of adipose tissue as an active participant in contro-lling the body’s physiologic and pathologic proces-ses.1 The current view of adipose tissue is that of an
active secretory organ, sending out and responding to signals that modulate appetite, insulin sensitivi-ty, energy expenditure, fat liver deposits and bone formation.
Osteocalcin has been viewed as a constituent of the bone extracellular matrix. Osteocalcin con-tains three glutamic acid residues that are gamma
carboxylated (gla residues),2 hence the alternative
name of osteocalcin, bone gla protein.3 Because this
postraslational modificaction confers high affinity for minerals, it was thus assumed that osteocalcin is involved in bone extracellular matrix mineraliza-tion.4 Also, osteocalcin shows some features of
hor-mone. For instance, it is encoded by a cell-specific gene and it is present in blood. Homozygous osteo-calcin-gene deficient mice have low insulin levels, high blood glucose levels, and decreased insulin se-cretion and insulin sensitivity.
Patients with chronic liver disease are at increa-sed risk of develop metabolic bone disease.6 The
etio-logy of the osteopathy of patients with chronic liver disease has not been clarified untile now; among other causes, decreased serum osteocalcin levels has been related with this entity.7 Nonalcoholic fatty
li-ver disease (NAFLD) is a common lili-ver disease cha-racterized by elevated serum aminotransferase levels, hepatomegaly and accumulation of fat in li-ver accompanied by inflammation and necrosis res-embling alcoholic hepatitis in the absence of heavy alcohol consumption.8 It is important to discern
the development of NAFLD. Perhaps, the role of os-teocalcin on insulin actions could influence on histopathological changes of NAFLD.
To the best of our knowledge, a well-defined group of patients with NAFLD has not been exami-ned so far for influence of osteocalcin levels in liver changes. Accordingly, the aim of the present study was to explore the relation of osteocalcin with un-derlying histopathological characteristics of NALFD patients.
SUBJECTS AND METHODS
Subjects and procedure
A population of 69 NAFLD patients was analyzed in a cross sectional study in a hospital-based set-ting. Patients were recruited in a consecutive pros-pective way in the Digestive Departament. The exclusion criteria were hepatitis B, C, cytomegalovi-rus, Epstein Barr infections, monogram-specific auto antibodies, alcohol consumption, diabetes me-llitus, intolerance fasting glucose, medication (and diabetic drugs, blood-pressure lowering medication and statins) and hereditary defects (iron and copper storage diseases and alpha 1-antitrypsin deficiency). Diabetes mellitus and intolerance fasting glucose were has been excluded with basal glucose after 8 hours of fasting state.9 The study was approved by
an institutional ethics committee.
A liver biopsy was realized. Weight, basal glucose, insulin, insulin resistance (HOMA), total cholesterol, LDL-cholesterol, HDL-cholesterol, triglycerides and osteocalcin blood levels were measured. A bioimpe-dance was performed.
Assays
Serum total cholesterol and triglyceride concen-trations were determined by enzymatic colorimetric assay (Technicon Instruments, Ltd., New York, N.Y., USA), while HDL cholesterol was determined enzymatically in the supernatant after precipitation of other lipoproteins with dextran sulphate-mag-nesium. LDL cholesterol was calculated using Frie-dewald formula. Plasma glucose levels were determined by using an automated glucose oxidase method (Glucose analyser 2, Beckman Instruments, Fullerton, California). Insulin was measured by en-zymatic colorimetric (Insulin, WAKO Pure-Chemical Industries, Osaka, Japan) and the homeostasis mo-del assessment for insulin sensitivity (HOMA) was calculated using these values.10
Total osteocalcin was analyzed in duplicated using a commercially available ELISA kit (Immuno-diagnostics System Ltd (IDS Ltd), Boldon, UK). As-say sensitivity was 0.5 ng/mL and interasAs-say and intraassay coefficients of variation were less than 5.1 and less than 2.2, respectively.
Anthropometric measurements
Body weight was measured to an accuracy of 0.1 kg and body mass index computed as body weight/ (height2). Waist (narrowest diameter between
xi-phoid process and iliac crest) and hip (widest diame-ter over greadiame-ter trochandiame-ters) circumferences to derive waist-to hip ratio (WHR) were measured, too. Tetrapolar body electrical bioimpedance was used to determine body composition11 (Biodynamic Model
310e, Seattle, WA, USA).
Liver biopsy
Liver tissues were stained with hematoxylin-eosin, reticulin, and Gomori trichrome stains and scored by an experienced hepathologist. All cases showed macrovesicular steatosis affecting at least 5% of hepatocytes and were classified as steatosis. In addition to steatosis, the minimum criteria for the diagnosis of steatohepatitis included the presen-ce of lobular inflammation and either ballooning presen- ce-lls or perisinusoidal/pericellular fibrosis in zone 3 of the hepatic acinus. All cases were scored using the method of Brunt.12 Steatosis was graded as
follo-ws: grade 1 (> 5% and < 33% of hepatocytes affected); grade 2 (33-66%); or grade 3 (> 66% of he-patocytes affected). Grades 2 and 3 were combined for statistical analysis (high grade) and grade 1 (low grade). Fibrosis was assessed with the Masson trichome stain.13 Other histological features
evalua-ted in haemtaoxylin-eosin sections included lobuli-llar inflammation and portal inflammation.
Statistical analysis
with stepwise variable selection were used to test for significant relations in histopathological lesions (stea-tosis, fibrosis, lobulillar and perinusoidal inflamma-tion) with adjustment for possible confounders. A p-value under 0.05 was considered statistically signifi-cant. SPSS 15.0 software (IL, USA) was used.
RESULTS
Sixty-nine patients gave signed informed consent and were enrolled in the study (approved by Ethical Committee of HCU). The mean age was 43.2 ± 12.2 years, the mean BMI was 33.8 ± 11.2 with 44 males (64.3%) and 25 females (35.7%).
Table 1 shows differences between high grade of steatosis and low grade of steatosis. Patients with high grade of steatosis have higher levels of weight, body mass index, insulin and HOMA levels than low grade steatosis.
Table 2 shows differences between patients with lobular inflammation vs. no lobular inflammation. Patients with this type of inflammation have higher levels of body mass index, weight and fat mass than patients without inflammation.
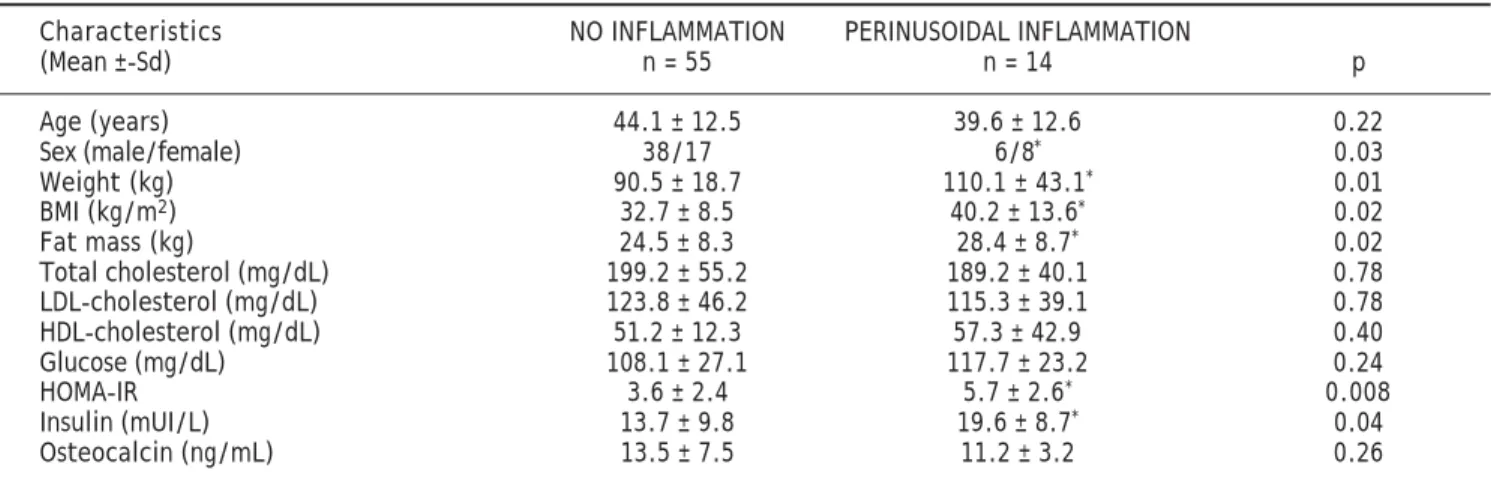
Table 3, shows differences between patients with portal inflammation vs. no portal inflammation. Patients with this type of inflammation have hig-her levels of body mass index, weight, fat mass,
in-Table 1. Clinical and epidemiological characteristics (low grade vs. high grade of steatosis).
Characteristics LOW GRADE HIGH GRADE
(Mean ± Sd) n = 30 n = 39 p
Age (years) 45.7 ± 11.1 41.4 ± 12.9 0.14
Sex (male/female) 9/21 16/23 0.48
BMI (kg/m2) 31.0 ± 7.3 36.8 ± 11.4* 0.02 Weight (kg) 85.3 ± 18.3 101.7 ± 11.3* 0.02 Fat mass (kg) 24.2 ± 9.1 26.2 ± 8.1 0.52 Total cholesterol (mg/dL) 203.3 ± 56.1 184.1 ± 44.2 0.14 LDL-cholesterol (mg/dL) 134.1 ± 50.7 112.8 ± 35.8 0.18 HDL-cholesterol (mg/dL) 52.9 ± 12.1 52.1 ± 28.2 0.89 Glucose (mg/dL) 106.2 ± 26.1 113.1 ± 7.3 0.31
HOMA-IR 2.7 ± 1.5 5.1 ± 2.8* 0.001
Insulin (mUI/L) 10.3 ± 3.6 18.7 ± 11.3* 0.001 Osteocalcin (ng/mL) 13.9 ± 8.1 12.4 ± 5.9 0.37
BMI: Body mass index. LDL: Low density lipoprotein. HDL: High density lipoprotein. HOMA-IR: Homeostatic model assessment (glu-cose (mmol/L*insulin uU/mL)/22.5). T-Student test used. Insulin and HOMA-IR have non-parametric distribution (U-Mann test used). (*) p < 0.05.
Table 2. Clinical and epidemiological characteristics lobulillar inflammation (no inflammation vs. lobulillar inflammation).
Characteristics NO INFLAMMATION LOBULAR INFLAMMATION
(Mean ± Sd) n = 28 n = 41 p
Age (years) 42.7 ± 12.4 43.6 ± 12.2 0.48
Sex (male/female) 22/6 22/19* 0.04
BMI (kg/m2) 31.4 ± 7.2 36.5 ± 11.4* 0.04 Weight (kg) 88.3 ± 15.3 99.2 ± 31.3* 0.02 Fat mass (kg) 21.7 ± 9.1 26.8 ± 7.8* 0.05 Total cholesterol (mg/dL) 204.1 ± 60.2 192.2 ± 45.9 0.12 LDL-cholesterol (mg/dL) 126.1 ± 54.1 119.6 ± 37.4 0.61 HDL-cholesterol (mg/dL) 53.3 ± 11.9 52.0 ± 27.1 0.81 Glucose (mg/dL) 106.6 ± 12.1 112.5 ± 27.3 0.38
HOMA-IR 3.4 ± 2.6 4.6 ± 2.5 0.68
Insulin (mUI/L) 13.2 ± 12.1 16.2 ± 7.7 0.38 Osteocalcin (ng/mL) 14.5 ± 8.8 12.1 ± 5.1 0.15
sulin and HOMA than patients without inflamma-tion.
Table 4, shows differences between patients with fibrosis vs. no fibrosis. Patients with fibrosis have higher levels of insulin, HOMA BMI, and fat mass
than patients without fibrosis. However, patients with fibrosis have lower levels of osteocalcin.
Patients were divided in two groups by median os-teocalcin value (11.34 ng/mL), group I (patients with the low values) and group II (patients with the
Tabla 5. Liver histopathological changes by median osteocalcin.
Frequencies Low osteocalcin High osteocalcin
n = 35 n = 34 p
High grade of esteatosis 54.3% 60.6% 0.53 Lobulillar inflammation 62.9% 56.3% 0.58
Portal inflammation 20.0% 21.9% 0.85
Fibrosis 22.9% 9.4%* 0.04
High frequency of portal inflammation in high visfatin group, Other pathological changes without differences. Chi square test used (*) p < 0.05.
Table 3. Clinical and epidemiological characteristics portal inflammation (no inflammation vs. portal inflammation). Characteristics NO INFLAMMATION PERINUSOIDAL INFLAMMATION
(Mean ±-Sd) n = 55 n = 14 p
Age (years) 44.1 ± 12.5 39.6 ± 12.6 0.22
Sex (male/female) 38/17 6/8* 0.03
Weight (kg) 90.5 ± 18.7 110.1 ± 43.1* 0.01 BMI (kg/m2) 32.7 ± 8.5 40.2 ± 13.6* 0.02 Fat mass (kg) 24.5 ± 8.3 28.4 ± 8.7* 0.02 Total cholesterol (mg/dL) 199.2 ± 55.2 189.2 ± 40.1 0.78 LDL-cholesterol (mg/dL) 123.8 ± 46.2 115.3 ± 39.1 0.78 HDL-cholesterol (mg/dL) 51.2 ± 12.3 57.3 ± 42.9 0.40 Glucose (mg/dL) 108.1 ± 27.1 117.7 ± 23.2 0.24
HOMA-IR 3.6 ± 2.4 5.7 ± 2.6* 0.008
Insulin (mUI/L) 13.7 ± 9.8 19.6 ± 8.7* 0.04 Osteocalcin (ng/mL) 13.5 ± 7.5 11.2 ± 3.2 0.26
BMI: Body mass index. LDL: Low density lipoprotein. HDL: High density lipoprotein. HOMA-IR: Homeostatic model assessment (glu-cose (mmol/L*insulin uU/mL)/22.5). T-Student test used. Insulin and HOMA-IR have non-parametric distribution (U-Mann test used). (*) p < 0.05.
Table 4. Clinical and epidemiological characteristics liver fibrosis (no fibrosis vs. fibrosis). Charactersitics No fibrosis Fibrosis
(Mean ± Sd) n = 58 n = 11 p
Age (years) 42.7 ± 11.9 46.0 ± 14.2 0.42
Sex (male/female) 40/18 4/7* 0.04
BMI (kg/m2) 32.4 ± 7.6 43.8 ± 15.6* 0.001 Fat mass (kg) 23.9 ± 8.1 30.6 ± 8.2* 0.02 Total cholesterol (mg/dL) 197.9 ± 49.3 192.5 ± 68.4 0.76 LDL-cholesterol (mg/dL) 120.4 ± 36.8 132.8 ± 79.3 0.47 HDL-cholesterol (mg/dL) 50.5 ± 13.4 64.2 ± 46.7 0.08 Glucose (mg/dL) 109.6 ± 27.8 112.2 ± 27.1 0.77
HOMA-IR 3.7 ± 2.4 5.9 ± 2.9* 0.02
Insulin (mUI/L) 13.9 ± 9.6 20.6 ± 9.7* 0.04 Osteocalcin (ng/mL) 13.7 ± 7.2 9.6 ± 3.7* 0.01
high values). Table 5 shows the statistical differen-ces between both groups in liver biopsy characteris-tics. Only liver fibrosis frequencies were different between groups (low osteocalcin group: 22.9% vs. high osteocalcin group: 9.4%; p < 0.05). Patients in group I had higher levels of glucose (115.6 ± 28.1 mg/dL vs. 103.7 ± 24.3 mg/dL; p < 0.04), HOMA (4.6 ± 3.1 units vs. 3.6 ± 1.8 units; p < 0.04), weight (102.9 ± 32.4 kg vs. 85.9 ± 16.8 kg; p = 0.002) and body mass index (38.3 ± 11.4 kg/m2 vs. 30.1 ± 5.7
kg/m2; p = 0.001)) than patients in group II.
Osteo-calcin was inverse correlated with glucose (r =-0.4; p = 0.002) and HOMA (r = -0.3;p = 0.01).
In the logistic regression with age-, sex-, BMI, fat mass- and insulin- adjusted portal inflamma-tion, high grade of steatosis, fibrosis and lobular inflammation as dependent variables, osteocalcin concentrations are no related with histological changes. HOMA is related with portal inflamma-tion 1.31(CI95%:1.05-1.64), with high grade of steatosis 1.95(CI95%:1.29-2.91) and with fibrosis 1.29(CI95%:1.02-1.63), secondaries to an increase of one unit of HOMA.
DISCUSSION
The present study demonstrates that osteocalcin is associated with liver fibrosis. However, this asso-ciation disappeared in a logistic regression model, and only HOMA remained in the model.
The relationship between liver histopathological changes and biochemical parameters are a unclear topic area in NAFLD patients. In obese patients, the primary abnormality may be genetically induced in-sulin resistance, with a secondary increase of serum triglyceride levels due to enhance of peripheral lipo-lysis. The resulting hepatic supply of fatty acids and insulin may increase triglyceride deposition in the li-ver.14-15 In our study steatosis, portal inflammation
and fibrosis were related with HOMA, this data con-firmed previous hypothesis.
The novel finding of our study is the relation of osteocalcin with liver fibrosis, perhaps as a surroga-te marker of insulin resistance. An increasing num-ber of studies have indicated the presence of a complex cross-talk between adipose tissue and the skeleton. Surprinsingly, Lee, et al.5 showed that
os-teocalcin affects adiposity and glucose homeostasis in mice, suggesting that the skeleton influences on energy metabolism. Osteocalcin-deficient mice dis-played obesity, hyperglycemia and insulin resistan-ce. When ostoecalcin was administered to these mice, blood glucose decreased.5 Recently, Kindblom,
et al.16 showed that osteocalcin was an independent
negative predictor of plasma glucose in elderly hu-mans. These findings suggest that previous descri-bed endocrine function of the osteoblats-derived osteocalcin on glucose homeostasis in mice also might exist in humans and could influence in some entities of metabolic syndrome sush as NAFLD. We herein show that plasma levels of osteocalcin were clearly negatively associated with glucose, HOMA and liver fibrosis in patients with NAFLD. However, adjusted logistic regression models showed that osteocalcin was not an independent negative predictor of liver fi-brosis. The effect on liver fibrosis is mediated by in-sulin resistance.
In the literature, levels of osteocalcin were lower in the diabetic subjects than in the nondiabetic sub-jects.17 Nevertheless, osteocalcin had a clear
negati-ve correlation with weight and plasma glucose both before and after exclusion of the diabetic patients,16
indicating that the association between osteocalcin and glucose homeostasis is not caused by diabetes mellitus. However, other possible explanation of the inverse association between osteocalcin and glucose homeostasis is that obesity is associatd with low bone turnover, as Khosla, et al. described.18
Secondly, osteocalcin may be an epiphenomenon of an inflammatory state of obese patients with NA-FLD, without a direct effect on liver dammage. For example, Pittas, et al.19 have demonstrated that
serum osteocalcin was inversely associated with glu-cose, HOMA, BMI and inflammatory markers such as C reactive protein and interleukine-6.
The main limitation of our study is that it is a cross-sectional study and, therefore, one should be cautious with mechanistic interpretations of our fin-ding. However, to the best of our knowledge, a well-defined group of patients with NAFLD has not been examined so far for influence of osteocalcin levels in liver changes. Only, Szalay, et al.20 have
demonstra-ted a decreased serum osteocalcin levels in non-alco-holic and alconon-alco-holic chronic liver disease, without a histological evaluation of the liver. In this context, our preliminary datas could be important in this “metabolic puzzle”.
ge-netic single nucleotide polymorphisms in the osteo-calcin way could influence osteoosteo-calcin interaction with metabolic parameters.
Our study design cannot explain causality, but the main strength is the liver histology, using biop-sy. Further interventional studies to increase osteo-calcin levels5 are needed to explore histopathological
improvements in liver biopsy. Dose-response experi-ments in animals, confirmed the dose effect of osteo-calcin on insulin expression by cultured beta cells plateaued at high concentration of osteocalcin.21
Moreover, osteocalcin levels could predict the pre-sence of the liver fibrosis, this molecule could invol-ve a non invasiinvol-ve technical to determine this pathological change with HOMA, too. Recently, Sa-leem, et al.22 have demonstrated that serum
osteo-calcin is associated with measures of insulin resistance, adipokine levels, and the presence of MetSyn, suggesting a novel cross-talk between bone and adipose tissue. This association raises interes-ting new prospects for future research in this area of work.
In conclusion, osteocalcin is associated with liver fibrosis. This univariate analysis would be impor-tant if in further studies a clinical consequence ei-ther in liver disease or perhaps in bone metabolism could be demonstrated.
REFERENCES
1. Meier U, Gressner AM. Endocrine regulation of energy me-tabolism: review of pathobiochemical and clinical chemical aspects of leptin, ghrelin, adiponectin and resistin. Clin Chemistry 2004; 50: 1511-25.
2. Lee NK, Karsenty G. Reciprocal regulation of bone and energy metabolism. Trends in Endocrinology and Metabo-lism 2009; 19: 161-6.
3. Hauschka PV. Osteocalcin and matrix Gla protein :vita-min K dependent proteins in bone. Physiol Rev 1989; 69: 990-1047.
4. Price PA. Gla-containing proteins of bone. Connect Tissue Res 1989; 21: 51-7.
5. Lee NK, Sowa H, Hinoi E, Ferron M, Ahn JD, COnfavreux C, DAcquin R, et al. Endocrine regulation of energy metabo-lism by the skeleton. Cell 2007; 130: 456-69.
6. George J, Ganesh HK, Acharya S, Bandgar T, Shivane V, Karvat A, et al. Bone mineral density and disorders of mi-neral metabolis in chronic liver disease. W J Gastroente-rology 2009; 15: 3516-22.
7. Pietschmann P, Resch H, Muller Ch, Woloszczuk W, Will-nonseder R. Decreased serum ostoecalcin levels in pa-tients with liver cirrhosis. Bone and mineral 1990; 8: 103-8.
8. Ludwig J, Viggiano TR, McGill DB, Oh BJ: Nonalcoholic stea-tohepatitis: Mayo Clinic experiencies with a hitherto un-named disease. Mayo Clinic Proc 1980; 55: 434-8.
9. Standards of medical carein Diabetes 2007. Diabetes Care
2008; 30: s4-s41.
10. Mathews DR, Hosker JP, Rudenski AS, Naylor BA, Treacher Df. Homesotasis model assessment: insulin resistance and beta cell function from fasting plasma glucose and insulin concentrations in man. Diabetologia 1985; 28: 412-14. 11. Pichard C, Slosman D, Hirschel B, Kyle U. Bioimpedance
analysis in patients: an improved method for nutritional follow up. Clin Res 1993; 41: 53ª.
12. Brunt EM. Nonalcoholic steatohepatitis: definition and pa-thology. Semin Liver Dis 2001; 21: 3-16.
13. Bondini S, Kleiner DE, Goodman ZD, Gramlich T, Younossi ZM. Pathologic assesment of non-alcoholic fatty liver di-sease. Clin Liver Dis 2007; 11: 17-23.
14. Venturi C, Zoppini G, Zamboni C, Muggeo M: Insulin sensi-vity and hepatic steatosis in obese subjects with normal glucose tolerance. Nutr Metab Cardiovsc Dis 2004: 14: 200-4.
15. Browning JD, Horton JD: Molecular mediators of hepatic steatosis and liver injury. The J of Clin Invest 2004: 114: 147-52.
16. Kindblom JM, Ohlsson C, Ljunggren O, Karlsson M, Tivesten A, Smith U, Mellstrom D. Plasma osteocalcin is inversely re-lated to fat mass and plasma glucose in elderly Swedish men. J of Bone and Mineral Research 2009; 24: 785-91. 17. Gerdhem P, Isaksson A, Akesson K, Obrant KJ. Increased
bone density and decreased bone turnover, but no evi-dent alteration of fracture susceptibility in elderly wo-men with diabetes mellitus. Osteoporosis Int 2005; 16: 1506-12.
18. Khosla S, Atkinson EJ, Riggs BL, Melton LJ. Relationship between body composition and bone mass in women. J Bone Miner Res 1996; 11: 857-63.
19. Pittas A, Harris S, ELiades M, Stark P, Dawson B. Associa-tion between serum osteocalcin and markers of metabolic phenotype. J Clin Endocrin Metab 2008 as doi:10.1210/ jc.2008-1422.
20. Szalay F, Lakatos P, Németh J, Abonyi M, Büki B, Tarján G, Holló I. Decreased serum osteocalcin level in non-alcoholic and alcoholic chronic liver diseases. Orv Hetil 1991; 132(24): 1301-5.
21. Feron M, Hinoi E, KArsenty G, Ducy P. Osteocalcin diffe-rentally regulates beta cell and adipocyte gene expression and affects the development of metabolic diseases in wild type mice. Proc Natl Acad Sci USA 2008; 105: 5266-70. 22. Saleem U, Mosley TH Jr, Kullo IJ. Serum osteocalcin is
asso-ciated with measures of insulin resistance, adipokine le-vels, and the presence of metabolic syndrome.