Correlation between
serum cytokeratin-18 and the progression
or regression of non-alcoholic fatty liver disease
Miwa Kawanaka, Ken Nishino, Jun Nakamura, Noriyo Urata, Takahito Oka, Daisuke Goto, Mitsuhiko Suehiro, Hirofumi Kawamoto, Gotaro Yamada
Department of Internal Medicine 2, Kawasaki Hospital, Kawasaki Medical School, Okayama, Japan. ABSTRACT
Background. Diagnosis of non-alcoholic fatty liver disease (NAFLD) is limited by the need for liver biopsies. Serum cytokeratin 18 (CK-18) levels have been investigated as potential biomarkers for the presence of NA-FLD and non-alcoholic steatohepatitis (NASH). Herein, we assessed the correlation between CK-18 levels and NAFLD progression. Material and methods. Serum CK-18 levels were estimated using the M30 antibody enzyme-linked immunosorbent assay in 147 patients diagnosed with NAFLD. In 72 patients, disease progres-sion was evaluated by repeated liver biopsy, which was conducted after 4.3 ± 2.6 years. The relationship between the CK-18 levels and liver histological findings was assessed. Results. The CK-18 levels were useful for identifying NAFLD patients with NAFLD activity scores (NAS) ≥ 5 (NAS ≥ 5 vs. ≤ 4: 675.1 U/L vs. 348.7 U/L; p < 0.0001). A cut-off value of 375 U/L was calculated using the receiver operating characteristic curve approach, with a specificity and sensitivity of 81.5 and 65%, respectively, for the diagnosis of NASH. Among the 72 patients who underwent repeated liver biopsy, 11 patients with a progressed NAS also had signifi-cantly increased serum CK-18 levels (p < 0.01); in 30 patients with an improved NAS, there was a significant improvement in the mean CK-18 levels (p < 0.0001). The 31 patients with static NAS had static CK-18 levels.
Conclusions. In conclusion, serum CK-18 levels can predict NAS ≥ 5 in NAFLD patients. In NAFLD patients, serum CK-18 levels reflect NAS values and correlate with histological changes, and they appear to be use-ful indicators of progression and improvement.
Key words. CK-18. Non-alcoholic steatohepatitis. Fibrosis NAFLD activity score (NAS).
Correspondence and reprint request: Miwa Kawanaka, M.D., Ph.D. Department of Internal Medicine 2, Kawasaki Hospital, Kawasaki Medical School.
2-1-80 Nakasange, Kita-ku, Okayama City, Okayama 700-8505, Japan. Tel: +81-86-225-2111. Fax: +81-86-232-8343
E-mail: [email protected]
Manuscript received: June 27, 2014. Manuscript accepted: April 06, 2015.
INTRODUCTION
Non-alcoholic fatty liver disease (NAFLD) is the most common chronic liver disease, recently report-ed to affect 30% of adults in Japan and the West.1,2 Based on histological disease activity, NAFLD is divided into non-alcoholic fatty liver (NAFL) and non-alcoholic steatohepatitis (NASH), with the former having a relatively good prognosis. However, NASH may progress to cirrhosis, and in some cases, hepatocellular carcinoma (HCC).3-5 Although liver
biopsies are the current gold standard for diagnos-ing NASH, the procedure is invasive and cannot be ethically performed in all NAFLD patients. Recent studies have reported that serum cytokeratin (CK)-18 is useful for diagnosing NASH and NAFLD.6-11 However, the diagnosis and management of NAFLD practice guidelines established by the American Association for the Study of Liver Diseases, Ameri-can College of Gastroenterology, and AmeriAmeri-can Gastroenterological Association state that although serum/plasma CK-18 is a promising biomarker for identifying steatohepatitis, its use in routine clinical practice is premature.12
CK-18 is an intermediate filament protein present in large quantities in the liver, accounting for 5% of liver proteins. During cellular apoptosis, CK-18 is cleaved at Asp396, and the CK-18 fragments are rec-ognized by an M30 antibody specific for the liberated C-terminus. Thus, CK-18 is a marker of hepatocyte apoptosis.13 The present study examined the signifi-cance of serum CK-18 as a non-invasive biomarker
in NAFLD patients undergoing liver biopsies. Addi-tionally, we investigated the relationship between serum CK-18 levels and liver histological assess-ments, as well as the corresponding changes in se-rum CK-18 levels and liver histological assessments over time.
EXPERIMENTAL PROCEDURES
Patients
A total of 147 patients with NAFLD [mean age, 56.5 years (range, 19-78 years); 69 (47.2%) males] were enrolled in this study. All the patients under-went a liver biopsy at Kawasaki Hospital in Okaya-ma, Japan, between 2007 and 2012. After a mean follow-up period of 4.3 ± 2.6 years, 72 patients un-derwent a repeated liver biopsy to determine any pathologic change. The study protocol was approved by the local ethics committee, and all patients pro-vided written informed consent.
Diagnostic criteria
A diagnosis of NAFLD was made according to the following criteria:
• Alcohol intake of ≤ 20 g/day;
• The absence of detectable hepatitis B surface an-tigen or hepatitis C virus ribonucleic acid, and the exclusion of autoimmune liver disease, drug-induced liver injury, or metabolic liver disease (e.g., Wilson’s disease, hemochromatosis); and • The presence of steatosis (> 30%) or
steatohepa-titis.
Biopsies were evaluated by two expert patholo-gists, and the liver biopsy features were also graded according to the NAFLD activity score (NAS) sys-tem proposed by Kleiner, et al.14 NAFLD patients were divided into two groups: NAS ≥ 5 or NAS ≤ 4. Furthermore, the individual NAFLD histological features were scored for lobular inflammation (0-3),
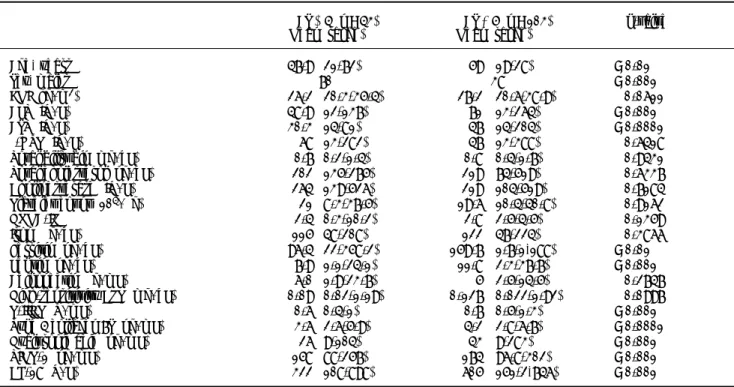
Table 1. Clinical and histological characteristics of 146 patients with non-alcoholic fatty liver disease (NAFLD).
Characteristic n = 147
Age (years), mean (range) 56.5 (19–78)
Sex, males 69 (47.2%)
BMI (kg/m2) 26.8 (20.3–38.9)
Ballooning, 0/1/2/3 (n) 23/49/55/19
Steatosis, 0/1/2/3 (n) 6/45/64/31
ALT (IU/L), mean (range) 61 (12–264) AST (IU/L), mean (range) 38 (14–204)
γ-GTP (IU/L), mean (range) 46 (13–388) Total bilirubin (mg/dL), mean (range) 0.7 (0.2–1.7) Total cholesterol (ng/dL), mean (range) 204 (118–317) Cholinesterase (IU/L), mean (range) 217 (74–526) Platelet count (104/μg), mean (range) 19.5 (8.3–40.8)
HOMA-IR, mean (range) 2.8 (0.3–19.8)
Iron (μg/dL) 121 (47–224)
Ferritin (ng/dL) 125 (1.7–1188)
Leptin (ng/dL) 10.2 (1.1–37.7)
Adiponectin (μg/mL) 5.3 (1.9–23.7)
High-sensitivity C-reactive protein (mg/dL) 0.118 (0.02–1.92)
P-III-P (U/mL) 0.7 (0.4–1.3)
Type 4 collagen 7S (ng/mL) 4 (2.6–6.7) Hyaluronic acid (ng/mL) 33.5 (9–283) Tissue inhibitor of metalloproteinase-1 (ng/mL) 172.4 (88–301) Cytokeratin-18 (U/L) 495.6 (108–2176) NAFLD activity score, 0/1/2/3/4/5/6/7/8 (n) 0/0/13/15/16/36/25/29/12 Fibrosis, 0/1/2/3/4 (n) 7/44/53/32/10 Lobular inflammation, 0/1/2/3 (n) 9/68/50/19 Portal inflammation, 0/1/2/3 (n) 13/61/46/26
Table 2. Patients classified with non-alcoholic fatty liver disease (NAFLD) activity score (NAS) values ≤ 4 or ≥ 5. NAS ≤ 4 (n = 43) NAS ≥ 5 (n = 103) p-value Mean (range) Mean (range)
Age, years 47.9 (21-72) 59 (19-28) < 0.01
Sex, males 70% 38% < 0.001
BMI (kg/m2) 26.2 (20.3-35.4) 27.2 (20.6-38.9) 0.0611
ALT (IU/L) 48.9 (12-137) 71 (13-264) < 0.001 AST (IU/L) 30.3 (14-81) 47 (14-204) < 0.0001
γ-GTP (IU/L) 68 (13-282) 47 (13-388) 0.6418 Total bilirubin (mg/dL) 0.7 (0.2-1.4) 0.8 (0.4-1.7) 0.9431 Total cholesterol (ng/dL) 202 (135-275) 219 (74-519) 0.6337 Cholinesterase (IU/L) 264 (139-526) 219 (104-519) 0.7184 Platelet count (104/μg) 21 (8.3-37.5) 19.6 (10.4-40.8) 0.9162
HOMA-IR 2.4 (0.3-10.2) 2.8 (2.5-4.5) 0.1359 Iron (μg/dL) 115 (48-208) 122 (47-224) 0.3866 Ferritin (ng/dL) 96.4 (22-358.2) 159.7 (1.7-1,188) < 0.01 Leptin (ng/dL) 7.9 (1.1-24.1) 11.8 (2.3-37.7) < 0.001 Adiponectin (μg/mL) 6.0 (1.9-23.7) 5 (2.5-14.5) 0.2747 High-sensitivity CRP (mg/dL) 0.09 (0.02-1.19) 0.127 (0.022-1.92) 0.0997 P-III-P (U/mL) 0.6 (0.4-1) 0.7 (0.5-1.3) < 0.001 Type 4 collagen 7S (ng/mL) 3.6 (2.6-5.9) 4.2 (2.8-6.7) < 0.0001 Hyaluronic acid (ng/mL) 26 (9-104) 43 (9-283) < 0.001 TIMP-1 (ng/mL) 158 (88-257) 174 (96.8-302) < 0.001 CK-18 (U/L) 322 (108-898) 605 (151-2,746) < 0.001
NASH: non-alcoholic steatohepatitis. BMI: body mass index. ALT: alanine aminotransferase. AST: aspartate aminotransferase. γ-GTP: gamma-glutamyl transpeptidase. HOMA-IR: homeostasis model assessment-estimated insulin resistance. P-III-P: procollagen peptide type III. CRP: C-reactive peptide. TIMP: tissue inhibitor of metalloproteinase. CK: cytokeratin.
portal inflammation (0-3), steatosis (0-3), hepatocel-lular ballooning (0-2), Mallory bodies (0-1), and fi-brosis [0-4 (1:1A, 1B, and 1C)], as described by the NASH Clinical Research Network.14 Serum CK-18 levels were examined in terms of their relationship to the NAS score, fibrosis stage, lobular inflamma-tion, portal inflammainflamma-tion, steatosis, hepatocellular ballooning, and the presence of Mallory bodies. In addition, in the 72 patients who underwent repeated liver biopsies, a two-point decrease in the NAS val-ues was considered improved, a two-point increase was considered progressed; and other score changes were considered static.15
CK-18 level measurements
Blood samples were taken from all the patients at the time of liver biopsy, and they were stored at -80°C. Serum CK-18 levels were measured using an M30-apoptosis enzyme-linked immunosorbent assay kit (Pivka, Bromma, Sweden).
Statistical analysis
Continuous variables were expressed as a mean ± standard deviation or a median (interquartile range
[IQR]), as appropriate. Changes in the continuous variables were assessed using the paired t-test or Wilcoxon rank-sum test. Variables between patients with and without an increased NAS were compared using an unpaired t-test and Wilcoxon rank-sum test. In addition, the Wilcoxon rank-sum test and Bonferroni correlation coefficients were used to as-sess associations between the CK-18 levels and his-tological features. A receiver operating characteristics analysis was used to determine the role of CK-18 levels in the diagnosis of NAS ≥ 5. The area under the receiver operating characteristics curve (AUC) was assessed, and internal validation was performed using bootstrap resampling to calcu-late an optimism factor; the bias-corrected AUC was obtained by subtracting this optimism value from the AUC, which was directly measured from the original dataset. A p-value < 0.05 was considered statistically significant. All the statistical analyses were performed using SAS software (SAS Institute, Tokyo, Japan).
RESULTS
patients, after being grouped according to their NAS values, are shown in table 2. This table shows the comparative values between a NAS ≤ 4 and a NAS ≥ 5 in NAFLD patients. Changes in the patients’ char-acteristics for individuals who underwent repeat bi-opsies are shown in table 3.
Serum CK-18 levels correlate with NASH, as determined by the liver biopsy
Among the study population, the mean serum CK-18 levels increased as the NAS values increased (p < 0.0001) (Figure 1A). When comparing the NAS ≥ 5 and NAS ≤ 4 groups, the NAS ≥ 5 group showed significantly higher serum CK-18 levels (675.1 U/L vs. 348.7 U/L; p < 0.0001). As a result, CK-18 was determined to have a cut-off value of 375 U/L, and an AUC of 0.79 (95% confidence interval [CI]: 1.1 [65–81.5], P < 0.001) (p < 0.0001) (Figure 1B). The cut-off value had a sensitivity of 81.5%, specificity of 65%, positive predictive value of 80.8%, and a nega-tive predicnega-tive value of 43.1%. Therefore, serum CK-18 levels were determined to be useful for diagnosing NASH (Figure 2).
Serum CK-18 levels correlated with the histological features of NASH
In a comparative examination of serum CK-18 levels and the histology assessment, serum CK-18 levels increased significantly with an increased evidence of fibrosis (Figure 3A), as well as with an increased lobular inflammation, portal inflamma-tion, and steatosis (Figures 3B-3D). Serum CK-18 levels also correlated with hepatocellular ballooning and the presence of Mallory bodies (Figures 3E-3F). The correlations between the liver histology assess-ments and serum CK-18 levels are summarized in ta-ble 4. Serum CK-18 levels correlated with fibrosis, inflammation, steatosis, Mallory bodies, and NAS. The odds ratio for a correlation between serum CK-18 levels and Mallory bodies was particularly high.
Correlation between changes in the liver histology and serum CK-18 levels
In the 72 NAFLD patients who underwent repeat-ed biopsies, the clinical characteristics and biomark-er data for both biopsies are shown in table 3.
Table 3. Clinical characteristics and biomarkers for 72 non-alcoholic fatty liver disease patients who underwent repeated liver biopsies 4.3 ± 2.6 years (mean) after the first biopsy.
First biopsy Repeated biopsy p-value Mean (range) Mean (range)
Age, years 54 (19-74) 59 (21-78) 0.1375
Sex, males 47% 47% 1
BMI (kg/m2) 27 (20.7-38.9) 26 (20.3-36.2) 0.1679
ALT (IU/L) 82 (18-264) 37 (12-229) < 0.0001 AST (IU/L) 51 (18-264) 31 (14-110) < 0.0001
γ-GTP (IU/L) 59 (20-282) 33 (13-338) < 0.0001 Total bilirubin (mg/dL) 0.7 (0.2-1.7) 0.8 (0.3-1.5) 0.8725 Total cholesterol (ng/dL) 208 (118-299) 200 (121-317) 0.0643 Cholinesterase (IU/L) 203 (74-506) 302 (108-526) 0.0003 Platelet count (104/μg) 19.5 (10.4-39.4) 20 (8.3-40.8) 0.6909 HOMA-IR 3 (0.3-19.8) 2.7 (0.3-7.6) 0.0545 Iron (μg/dL) 121 (47-224) 121 (48-222) 0.8526 Ferritin (ng/dL) 230 (18-950) 103 (1.7-1188) < 0.0001 Leptin (ng/dL) 11.7 (2.2-27.4) 8.9 (1.1-37.7) 0.0423 Adiponectin (μg/mL) 5.3 (1.9-13.9) 5.3 (2.4-23.7) 0.9222 High-sensitivity CRP (mg/dL) 0.136 (0.03-0.75) 0.143 (0.02-0.19) 0.0063 P-III-P (U/mL) 0.7 (0.4-1.3) 0.6 (0.4-1.1) < 0.0001 Type 4 collagen 7S (ng/mL) 4.2 (2.6-6.7) 3.7 (2.8-5.9) 0.0052 Hyaluronic acid (ng/mL) 32 (9-283) 34.5 (10-215) 0.3447 TIMP-1 (ng/mL) 182 (88-301) 156 (112-243) 0.0002 CK-18 (U/L) 495.6 (88-301) 435 (109-2663) 0.0072
Overall, alanine aminotransferase, aspartate ami-notransferase, gamma-glutamyl transpeptidase, fer-ritin, fibrosis markers, and serum CK-18 levels reduced.
Correlation between changes in the NAS scores and serum CK-18 levels
Changes in the NAS and serum CK-18 levels were examined in the 72 NAFLD patients, and in 11 patients with a higher NAS, serum CK-18 levels significantly increased upon re-biopsy (p < 0.01) (Figure 4A). Those with a static NAS did not dem-onstrate changes in the CK-18 level (Figure 4B), and 30 patients with an improved NAS showed improved CK-18 levels (p < 0.0001) (Figure 4C).
These results indicate the possibility that serum CK-18 levels reflect NAS more than they reflect fibrosis staging.
DISCUSSION
The diagnosis of NASH, which has rapidly im-proved in recent years, currently requires an inva-sive liver biopsy. From safety and economic standpoints, liver biopsies are not feasible in all NAFLD patients. Therefore, an increasing number of studies are investigating potentially useful diag-nostic biomarkers.16-18 The current American guide-lines for the diagnosis and management of NAFLD indicate that serum CK-18 levels may be useful for distinguishing steatohepatitis; however, their rec-ommended use in routine clinical practice has been suggested to be premature.11
Cells are composed of fine fibers, microtubules, and intermediate filaments. Intermediate filaments are composed of a 1:1 ratio of CK-18 and CK-8, with CK-18 accounting for 5% of the total liver protein. During apoptosis, caspase-3 cleaves and degrades CK-18, resulting in the release of the deg-radation product, M30. Antibodies to M30 are Figure 2. Use of cytokeratin-18 (CK-18) for the diagnosis of NAS ≥ 5. A receiver-operating characteristic curve shows the accuracy of the serum CK-18 levels for predicting the presen-ce of non-alcoholic steatohepatitis in liver biopsies (n = 146) and validation patients (n = 72). The ideal area under the curve is 1.00.
Figure 1. A comparison of serum cytokeratin 18 (CK-18) levels and the non-alcoholic fatty liver disease activity score (NAS) values show that serum CK-18 levels increase as the
mean NAS increases (A). In addition, the NAS ≥ 5 group shows
significantly higher serum CK-18 levels (675.1 U/L) than the NAS ≤ 4 group (348.7 U/L). The box plot shows the median, first and third quartiles, and standard deviations of the values.
3,000
2,500
2,000
1,500
1,000
500
0
CK-18 (U/L)
1 2 3 4 5 6 7 8 3,000
2,500
2,000
1,500
1,000
500
0
CK-18 (U/L)
NAS ≤ 4 NAS ≥ 5 p < 0.0001
p < 0.0001
0.1 0.2 0.3 0.4 0.5 0.6 0.7 0.8 0.9 1 Specificity
1.0 0.9 0.8 0.7 0.6 0.5 0.4 0.3 0.2 0.1 0.0
Sensitivity
AUROC (95% CI), 0.79
ROC, NAS ≤ 4/ ≥ 5 and serum CK-18 levels
A
B
known to reflect epithelial cell apoptosis.13 In addi-tion, as a component of Mallory bodies, which de-velop in various hepatic diseases (including alcoholic liver disease, NASH, primary biliary cir-rhosis, and hepatoma), CK-18 reportedly contrib-utes to the progression and activity of various hepatic diseases.19 Histologically, Mallory bodies are frequently observed in NASH patients. In the present study, serum CK-18 levels were highly cor-related with the presence or absence of Mallory bodies.
Serum CK-18 levels, in 44 NAFLD patients who underwent biopsies, were reported by Wieckowska,
et al. to be significantly higher in NASH patients (765.7 U/L) than in NAFLD patients (202.4 U/L) or healthy individuals (215.5 U/L).12 In a multicenter study by the United States NASH Clinical Research Network, serum CK-18 levels were analyzed in 139 NAFLD patients, and they were highly correlated with steatosis, hepatocellular ballooning, inflamma-tory cell infiltration, and hepatic fibrosis. A cut-off value of 216-287 U/L was determined, as well as a sensitivity and specificity of 65-77% and 65-92%, re-spectively, demonstrating a high accuracy for distin-guishing between NASH and NAFLD.20 In a meta-analysis on NAFLD, the area under the receiv-Figure 3. Histology and serum cytokeratin-18 (CK-18) levels. A. Mean serum CK-18 levels increase as the fibrosis stage
pro-gresses (p < 0.05). B. Mean serum CK-18 levels increase as lobular inflammation increases (p < 0.01). C. Mean serum CK-18 levels
increase as portal inflammation increases (p < 0.05). D. There is no correlation between steatosis and mean serum CK-18
levels < 0.01. E. Mean serum CK-18 levels increase as hepatocellular ballooning increases (p < 0.0001). F. A strong correlation
is observed between serum CK-18 levels and the presence of Mallory bodies (p < 0.0001).
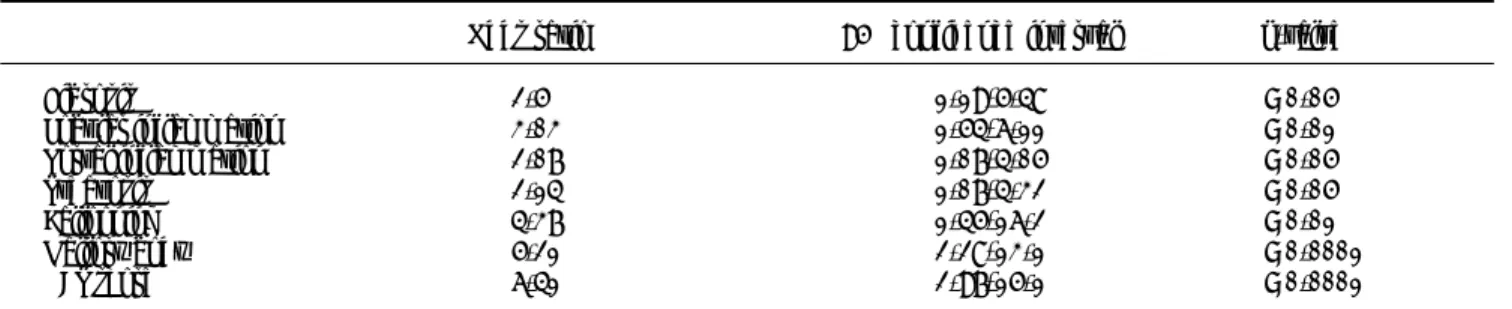
Table 4. Correlation between cyrokeratin-18 in the plasma and the histologic characteristics.
Odds ratio 95% confidence interval p-value
Fibrosis 2.5 1.19-5.48 < 0.05
Lobular inflammation 3.03 1.54-6.11 < 0.01 Portal inflammation 2.07 1.07-4.05 < 0.05
Steatosis 2.14 1.07-4.32 < 0.05
Ballooning 4.37 1.45-16.2 < 0.01
Mallory body 5.21 2.28-13.1 < 0.0001
NAS score 6.41 2.97-15.1 < 0.0001
NAS: non-alcoholic fatty liver disease activity score.
A B C
D E F
3,000
2,500
2,000
1,500
1,000
500
0
CK-18 (U/L)
0 1 2 3 4
p < 0.05
3,000
2,500
2,000
1,500
1,000
500
0
CK-18 (U/L)
3,000
2,500
2,000
1,500
1,000
500
0
CK-18 (U/L)
0 1 2 3 0 1 2 3
p < 0.01 p < 0.05
p < 0.01 p < 0.0001 p < 0.0001
3,000
2,500
2,000
1,500
1,000
500
0
CK-18 (U/L)
3,000
2,500
2,000
1,500
1,000
500
0
CK-18 (U/L)
3,000
2,500
2,000
1,500
1,000
500
0
CK-18 (U/L)
er operator characteristic curve was 0.82, with sen-sitivity and specificity values of 78 and 87%, respec-tively, further demonstrating that CK-18 is a useful marker for detecting NASH.21 Recently, a com-bination of adipocyte fatty acid binding protein, ap-optosis marker soluble Fas ligand,7 computed tomography findings,9 and serum CK-18 levels were reported to further improve the ability to diagnose NASH. In our study, serum CK-18 levels increased in NAFLD patients in conjunction with the NAS, making these levels useful for distinguishing be-tween a NAS ≥ 5 and a NAS ≤ 4 in individuals with NAFLD.
In the past, we reported that serum CK-18 levels in NAFLD patients correlate with alanine ami-notransferase, aspartate amiami-notransferase, and gamma-glutamyl transpeptidase levels, as well as homeostasis model assessment-estimated insulin re-sistance, ferritin levels, fibrosis markers, the tissue inhibitor of metalloproteinase-1, and the procolla-gen peptide type III.17 In the present study, a histo-logical examination of the liver revealed that serum CK-18 levels correlated with the fibrosis stage, lobu-lar inflammation, portal inflammation, steatosis, hepatocellular ballooning, and presence of Mallory bodies; the correlation with the presence of Mallory bodies was particularly strong. Other re-ports have also described similar correlations between the CK-18 levels and histological observa-tions,21, 22 including in children.20
Changes in serum CK-18 levels in NAFLD pa-tients who have undergone repeated biopsies have only been previously reported in small numbers of patients, and the investigations were not detailed.8,23 In 10 patients progressing from non-NASH to NASH, between consecutive biopsies, Shen, et al. re-ported increased CK-18 levels in 8 patients; among 8
patients regressing from NASH to non-NASH, they reported a decrease in CK-18 levels in 7.8 For the 72 NASH cases in our study, changes in serum CK-18 levels were examined in conjunction with changes in the liver histology assessments and NAS values. NAS progression accompanied worsening CK-18 lev-els, remained static when the NAS values remained stationary, and improved when the CK-18 levels im-proved. Improvements in hepatic inflammation and steatosis resulted in improved hepatic fibrosis, whereas progressive hepatic inflammation and stea-tosis led to fibrosis progression. The aforementioned findings indicated that changes in serum CK-18 lev-els reflect changes in the presence of Mallory bodies and NAS values better than they reflect changes in fibrosis.
In conclusion, the findings of our study demon-strate that serum CK-18 is a non-invasive, simple, and reliable biomarker for NAS ≥ 5 within the spectrum of NAFLD. In addition, serum CK-18 levels reflect the mean patient NAS values, and they appear to be useful indicators of NAFLD progres-sion and improvement, suggesting that they are also useful for monitoring disease status and assessing treatment response in patients with NAFLD. How-ever, examination of the long-term prognosis of NASH, using CK-18 levels, and the further examina-tion of CK-18 levels in NAFLD patients are neces-sary in clinical practice.
ABBREVIATIONS
• CK-18: cytokeratin 18.
• NAFLD: non-alcoholic fatty liver disease.
• NASH: non-alcoholic steatohepatitis.
• NAS: non-alcoholic fatty liver disease activity score.
Figure 4. Changes in mean serum cytokeratin 18 (CK-18) levels and the non-alcoholic fatty liver disease activity score (NAS) values are examined in patients who underwent repeated biopsies. The mean serum CK-18 level increases in cases in which the
NAS increases (A), whereas the mean serum CK-18 level is static in patients in which the NAS value is also static (B). The mean
serum CK-18 level declines in patients in which the NAS is improved (C). The individual data points are shown.
A. NAS score progression ( n = 11). B. NAS score static ( n = 31). C. NAS score improved ( n = 30).
3,000
2,500
2,000
1,500
1,000
500
0
CK-18 (U/L)
First biopsy Second biopsy 620 ± 240 1129 ± 640
1,400 1,200 1,000 800 600 400 200 0
CK-18 (U/L)
3,000
2,500
2,000
1,500
1,000
500
0
CK-18 (U/L)
First biopsy Second biopsy 523 ± 263 498 ± 226
First biopsy Second biopsy 755 ± 479 333 ± 238
CONFLICTS OF INTEREST All authors declare no conflicts of interest.
REFERENCES
1. Wieckowska A, Feldstein AE. Diagnosis of nonalcoholic fat-ty liver disease: invasive versus noninvasive. Semin Liver Dis 2008; 28: 386-95.
2. Egichi Y, Hyogo H, Ono M, Mizuta T, Ono N, Fujimoto K, Chayama K, et al. Prevalence and associated metabolic factors of nonalcoholic fatty liver disease in the general population from 2009 to 2010 in Japan: a multicenter large retrospective study. J Gastroenterol 2012; 47: 586-95.
3. Ekstedt M, Franzén LE, Mathiesen UL, Thorelius L, Hol-mqvist M, Bodemar G, Kechagias S. Long-term follow-up of patients with NAFLD and elevated liver enzymes. Hepatol-ogy 2006; 44: 865-73.
4. Rafiq N, Bai C, Fang Y, Srishord M, McCullough A, Gramlich T, Younossi ZM. Long-term follow up of patients with non-alcoholic fatty liver. Clin Gastroenterol Hepatol 2009; 44: 234-48.
5. Kawanaka M, Nishino K, Oka T, Urata N, Nakamura J, Goto D, Suehiro M, et al. A prospective study showing poor prognosis in Japanese NASH patients with fibrosis stage F3-4. Kawasaki Medical Journal 2012; 38: 119-27. 6. Shen J, Chan HL, Wong GL, Choi PC, Chan AW, Chan HY,
Chim AM, et al. Non-invasive diagnosis of non-alcoholic st-eatohepatitis by combined serum biomarker. J Hepatol
2012; 56: 1363-70.
7. Tamimi TI, Elgouhari HM, Alkhouri N, Yerian LM, Berk MP, Lopez R, Schauer PR, et al. An apoptosis panel for nonal-coholic steatohepatitis diagnosis. J Hepatol 2011; 54: 1224-9.
8. Shen J, Chan HL, Wong GL, Chan AW, Choi PC, Chan HY, Chim AM, et al. Assessment of non-alcoholic fatty liver dis-ease using serum total cell death and apoptosis markers.
Aliment Pharmacol Ther 2012; 36: 1057-66.
9. Yilmaz Y, Dolar E, Ulukaya E, Akgoz S, Keskin M, Kiyici M, Aker S, et al. Soluble forms of extracellular cytokera-tin 18 may differentiate simple steatosis from nonalco-holic steatohepatitis. World J Gastroenterol 2007; 13: 837-44.
10. Feldstein AE, Alkhouri N, De Vito R, Alisi A, Lopez R, Nobili V. Serum cytokeratin-18 fragment levels are useful bi-omarkers for nonalcoholic steatohepatitis in children. Am
J Gastroenterol 2013; 108: 1526-31.
11. Wieckowska A, Zein NN, Yerian LM, Lopez AR, McCullough AJ, Feldstein AE. In vivo assessment of liver cell apoptosis as a novel biomarker of disease severity in nonalcoholic fatty liver disease. Hepatology 2006; 44: 27-33.
12. Chalasani N, Younossi Z, Lavine JE, Diehl AM, Brunt EM, Cusi K, Charlton M, et al. The diagnosis and management of non-alcoholic fatty liver disease: practice Guideline by the American Association for the Study of Liver Diseases, American College of Gastroenterology, and the American Gastroenterological Association. Hepatology 2012; 55: 2005-23.
13. Leers MP, Kölgen W, Björklund V, Bergman T, Tribbick G, Persson B, Björklund P, et al. Immunocytochemical detec-tion and mapping of a cytokeratin 18 neo-epitope ex-posed during early apoptosis. J Pathol 1999; 187: 567-72. 14. Kliner DE, Brunt EM, Van Natta M, Behling C, Contos MJ,
Cummings OW, Ferrell LD, et al. Design and validation of a histological scoring system for nonalcoholic fatty liver dis-ease. Hepatology 2005; 41: 1313-21.
15. Loomba R, Wesley R, Pucino F, Liang TJ, Kleiner DE, Lavine JE. Placebo in nonalcoholic steatohepatitis: insight into natural history and implications for future clinical trials.
Clin Gastroenterol Hepatol 2008; 6: 1243-8.
16. Dowman JK, Tomlinson JW, Newsome PN. Systematic re-view: the diagnosis and staging of non-alcoholic fatty liver disease and nonalcoholic steatohepatitis. Aliment
Phar-macol Ther 2011; 33: 525-40.
17. Kawanaka M, Nishino K, Nakamura J, Oka T, Urata N, Goto D, Suehiro M, et al. Usefulness of monitoring serum cytok-eratin-18 levels for evaluating long-term prognosis is pa-tients with non-alcoholic steatohepatitis/non-alcoholic fatty liver disease [Abstract]. Hepatology 2013; 474A. 18. Sumida Y, Yoneda M, Hyogo H, Yamaguchi K, Ono M, Fujii
H, Eguchi Y, et al. A simple clinical scoring system using ferritin, fasting insulin, and type IV collagen 7S for pre-dicting steatohepatitis in nonalcoholic fatty liver disease.
J Gastroenterol 2011; 46: 257-68.
19. Omary MB, Ku NO, Strnad P, Hanada S. Toward unraveling the complexity of simple epithelial keratins in human dis-ease. J Clin Invest 2009; 119: 1794-805.
20. Feldstein AE, Wieckowska A, Lopez AR, Liu YC, Zein NN, McCullough AJ. Cytokeratin-18 fragment levels as noninva-sive biomarker for nonalcoholic steatohepatitis: a multi-center validation study. Hepatology 2009; 50: 1072-8. 21. Musso G, Gambino R, Cassader M, Pagano G.
Meta-analy-sis: natural history of non-alcoholic fatty liver disease (NAFLD) and diagnostic accuracy of non-invasive tests for liver disease severity. Ann Med 2011; 43: 617-49.
22. Tsutsumi M, Tanaka N, Kawakubo M, Sheena Y, Horiuchi A, Komatsu M, Nagaya T, et al. Serum fragmented cytokera-tin 18 levels reflect the histologic activity score of nonal-coholic fatty liver disease more accurately than serum alanine aminotransferase levels. J Clin Gastroenterol
2010; 44: 440-7.