Towards Recovering Architectural Information
from Images of Architectural Diagrams
Emmanuel Maggiori1
, Luciano Gervasoni1
, Mat´ıas Ant´unez1 , Alejandro Rago2
, and J. Andr´es D´ıaz Pace2
1
Facultad de Ciencias de Exactas, UNCPBA, Campus Universitario, (B7001BBO) Tandil, Buenos Aires, Argentina.
{emaggiori, lgervasoni, mantunez}@alumnos.exa.unicen.edu.ar,
2
ISISTAN Research Institute, CONICET-UNICEN.
{arago, adiaz}@exa.unicen.edu.ar
Abstract. The architecture of a software system is often described with diagrams embedded in the documentation. However, these diagrams are normally stored and shared as images, losing track of model-level archi-tectural information and refraining software engineers from working on the architectural model later on. In this context, tools able to extract architectural information from images can be of great help. In this arti-cle, we present a framework called IMEAV for processing architectural diagrams (based on specific viewtypes) and recovering information from them. We have instantiated our framework to analyze “module views” and evaluated this prototype with an image dataset. Results have been encouraging, showing a good accuracy for recognizing modules, relations and textual features.
1 Introduction
Software architecture knowledge is an important asset in today’s projects, as it serves to capture and share the main design decisions and concerns among the project stakeholders. Briefly, the software architecture is a model for describing the high-level organization of a system (since early development stages) [1]. More specifically, the architecture encompasses the set of structures needed to reason about a computing system, which comprises software elements, relations among them, and properties of both. The architecture can be documented using different mechanisms, for instance: Word documents, sketchy notes, UML diagrams within a CASE tool, or Web pages hosted in a Wiki, among others [6,9].
elements that have runtime presence and their pathways of interaction), or allocation views (the mappings of software elements to hardware). A common practice in software projects is to have architectural diagrams as the main source of documentation. These diagrams are kept as im-ages (e.g., JPG files) and pass them along as the development process progresses embedded in textual documents (even if the diagrams were originally created with a CASE tool). As a result, the model-level infor-mation contained by the diagram is “frozen” in the image format. This is a problem if engineers later need to work on the architectural model. Typical activities (or needs) include: i) updating the diagram, because the original model file is lost; ii) establishing traceability links with other models, often in a semi-automated fashion; or iii) feeding the model back into (other) CASE tools, among others.
In this context, we argue that tools able to extract design informa-tion from architectural diagrams can be of great help to software en-gineers. In fact, the areas of image recognition and classification have greatly evolved over the last years, and advanced techniques for analyz-ing graphical documents have been developed for engineeranalyz-ing domains such as: patents, architectural drawings, circuit designs and flowcharts, among others. However, to the best of our knowledge, only a few applica-tions of these techniques to UML models have been reported [10,12,14]. In this work, we present an image extraction framework, calledIMEAV (Im-age Extractor for Architectural Views), that is targeted to architectural views. Our framework takes advantage of the distinctive characteristics of a given architectural view (also referred to as its viewtype) in order to derive a view-specific processing pipeline. This pipeline is then able to read images and generate a graph-based representation of the view constitutive features as detected in the image (e.g., box types, edges con-necting the boxes, edge types, text associated to either boxes or edges, etc.). An instantiation of the framework for the specific case of module views is presented. A preliminary evaluation with a sample of images of module views has shown an encouraging detection performance.
2 Related Work
The problem of document analysis and recognition has been of wide in-terest to the scientific community for decades [17]. Most works have ad-dressed the recognition of specific patterns independently. Particularly, great efforts have been done in character recognition [8], text line seg-mentation [15] and line detection [13]. For text detection, however, many works have relied on third-party character recognition (OCR) packages, such as Tesseract and Abbyword [16,19,21]. Extracting each of these ele-ments separately is a different problem to the analysis of graphical doc-uments, given that in the latter all these patterns co-exist.
Patent copying and plagiarism is a relevant area in which different pro-posals for diagram analysis have been presented [3]. In this domain, graph-ical descriptions play a crucial role to verify the originality of patents. Sev-eral patent retrieval systems were developed for indexing and searching in the documents, based on a prior analysis of the raw image data (gen-erally, paper-scanned images). Another works have alternatively focused on recognizing flowcharts within patents [16,19,21].
3 General Approach
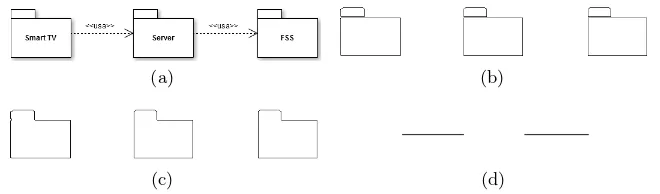
We propose an integral approach called IMEAV for assisting software en-gineers in the recovery of model-level information held in images, such as nodes, relations and accompanying text. IMEAV is designed as an image recognition framework customized for architectural diagrams, which con-sists of an arrangement ofrecognition/extraction components that can be flexibly configured in order to process different architectural viewtypes. For instance, Fig. 1 shows inputs to our framework for the case of module views. Note that the diagrams include features such as boxes, arrows con-necting boxes, text and a hierarchical layout (containers), among others. The goal of IMEAV is not to develop sophisticated or novel image recog-nition algorithms, but rather to leverage on existing algorithms/libraries as the “building blocks” for constructing specialized processing pipelines that can be used by software engineers in their daily architectural work. Our framework accepts various image formats as inputs. The only con-sideration for the input image is that its constituents should adhere, to a certain degree, to the vocabulary and rules of a valid architectural view-type. The viewtype must be predefined when the framework is configured and selected (only one) before it begins its processing. To this end, we assume the viewtypes defined by Views and Beyond [4], namely: modules, components and connectors, and allocation. These viewtypes are compli-ant with the ISO/IEC 42010, provided that the information requirements of the standard are fulfilled in the corresponding architecture document [4]. Although IMEAV is expected to be robust and tolerates some “noise” or elements not belonging to the target (chosen) viewtype (see Fig. 1a, or even Fig. 1b that mixes elements from a component-and-connector view), the closer the image to the viewtype vocabulary, the better the recognition results.
From a blackbox perspective, the output of IMEAV is a graph with nodes and edges, both possibly decorated with textual annotations. This representation fits well with the general structure of architectural view-types, which are described by a collection of element view-types, relation view-types, and properties. Furthermore, this graph representation can be easily con-verted to UML or XML formats, for instance XMI 3
. Fig. 2 shows a pos-sible output graph generated with IMEAV for the diagram of Fig. 1a. In the figure, a graph node is labeled with the propertiestype=“module”and name=“Server” after analyzing a box in the image that corresponds to a module. A graph edge is created with the properties type=“usage” and
3
(a)
[image:5.612.150.455.131.435.2](b)
Fig. 1.Some sample items of our dataset of module diagrams: (a) Non UML-compliant, (b) UML-compliant.
[image:5.612.187.430.491.640.2]directionality=“bi” based on the detection of a bi-directional arrow con-necting two module boxes. However, this does not mean that our frame-work will always identify all the features present in a diagram. It might happen that, after running IMEAV, some view-related information goes undetected and thus missing in the output graph. Examples of such situ-ations might be: (i) the tool properly recognizes a module and its arrows, but fails to infer the box type; or (ii) certain image regions are difficult to process and produce mistakes that might be carried along the pipeline.
[image:6.612.192.420.328.463.2]The design of our framework follows a pipe-and-filter architecture [1], according to the general workflow depicted in Fig. 3. The workflow divides the processing system into 5 configurable phases, namely: preprocessing, separation of text/structure, element extraction, relation extraction, text recognition and graph assembly. Each of these phases is explained next.
Fig. 3.The IMEAV processing pipeline and the role of architectural viewtypes
The first two phases of IMEAV are agnostic with respect to the target architectural viewtype. The following phases are affected by the vocab-ulary of the architectural viewtype chosen for the pipeline (e.g. modules view). The Text Recognition phase recognizes characters from text areas of the image. For this reason, having a (prior) good separation between text and structures is important. The identification of textual charac-ters is often delegated to third-party OCR implementations, which take a bounded image portion and produce a set of characters [8].
The Element Extraction phase detects elements such as modules, nodes and other architectural concepts, by scanning the boxes in the image. This procedure is not simple, because elements do not necessar-ily have a one-to-one mapping to geometric shapes. For example, UML modules are represented with boxes that have a small (contiguous) rect-angle atop, that is, a combination of two geometrical elements (see Fig. 1b). For this reason, we usually divide this phase into two tasks: (i) ex-traction of geometric entities (typically, rectangles) that satisfy a number of conditions, and (ii) identification of the actual elements, based on the precedent results. The second task can be accomplished by combining shapes via ad-hoc procedures or using Machine Learning techniques (see Subsection 4.4 for a specific example).
TheRelation Extractionphase reveals relations that connect elements. This phase is again divided into two tasks: (i) extraction of relevant geo-metric shapes (e.g., line segments), and (ii) identification of the underlying connecting paths from sets of shapes (e.g., a relation can be formed by a sequence of line segments). Additionally, this phase also analyzes the endpoints of connection paths because they are key to determine the type of relations. To this end, this phase not only works with information from relation-related shapes, but also takes advantage of information about the elements recovered in the previous phase. By relying on elements to determine relation types, non-existing relations can be filtered out [16] (e.g., excluding line segments that are part of elements in the image).
4 The Case of Module Diagrams
We have instantiated IMEAV with module views as the target viewtype. The main elements aremodules. A module is an implementation unit that provides a coherent set of responsibilities. Modules might take the form of a package, a class, or a layer, among other shapes. Possible relations among modules are: is-part-of, uses or is-a. The relation is-part-of can be alternatively represented by a hierarchical containment of modules. Although module views can be easily represented with UML notation, non-standard shapes can be used in the diagrams as well (see in Fig. 1a and 1b). Our processing pipeline is robust enough to support the recog-nition of both UML and non-UML module diagrams as input images (or even ”borderline” images, as in Fig. 1b).
In the following sub-sections, we describe how the phases of Fig. 3 were adjusted to work with module views. The current implementation is based on the OpenCV4
toolkit, which provides built-in support for connected component analysis, morphological and image handling operations.
4.1 Preprocessing
The preprocessing phase simply converts color to grayscale following a linear combination of the channels. Additionally, this phase also adds a one-pixel wide external border around the image with the color of its background. This border is for separating elements/relations that are con-tiguous to the image frame.
4.2 Text/Structure Separation
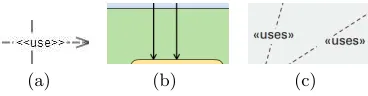
[image:8.612.140.479.511.574.2](a) (b) (c) (d) (e)
Fig. 4.A fragment of the diagram in Fig. 1: (a) Original, (b) Preprocessed, (c) Bina-rized, (d)-(e) Text/structure separation.
We use a blob-based analysis algorithm to separate text from struc-tures [19]. First, the image is transformed with a binarization technique,
4
simplifying the extraction of blobs. The text and structures are separated using an absolute threshold binarization (because text is illustrated with dark colors) and a set of blobs is produced. Next, the blobs are filtered, leaving out only those blobs that are potential (individual) characters and excluding structure and relation boundaries. Then, a morphological closing is performed in order to unify nearby blobs and close the holes [7]. This procedure is done horizontally, since this is the usual layout of module views. Finally, the results of morphological closing are filtered to remove blobs of inappropriate dimensions. Once text areas are detected, elements are filled up with the highest foreground intensity and stored on a separate layer. Fig. 4 shows this algorithm on a fragment of Fig. 1a.
4.3 Element Extraction
To extract elements of module views, we implemented a number of ded-icated components. First, the image is preprocessed using a binarization technique. We avoided using an absolute global thresholding technique for analyzing pixel intensities, since intensities belonging to foreground and background objects might overlap and thus a global threshold will induce in a loss of important information. Furthermore, deciding what constitutes a foreground or background pixel is not straightforward [21]. For these reasons, we developed a custom component that tags each pixel into one of two classes: foreground and background.
Our binarization component relies on a flood-filling algorithm. This al-gorithm performs an incremental addition of similar points to the blobs, with a given tolerance. Blobs that surpass a predefined threshold are tagged either as black or white. When a blob is tagged as white, a thin contour of black pixels is added around the blob. This is because some-times this contour might not exist. For instance, in Fig. 1a the big box has a different color than its container, but there is not a continuous black boundary surrounding it. The addition of a black contour when turning the blobs into white ensures that the boundary between every feature will be preserved. Our binarization component takes special care for shadows whose gradient produces a large number of contiguous thin blobs. Black contours are only added when the blobs enclose a minimum area, so as not to paint chaotic boundaries in shadowed regions.
rectangles using a threshold value (for the index). To address the detec-tion of modules contained in other modules (see Fig. 1a), we applied an incremental analysis of the rectangles. In every iteration, the rectangles detected using the index are dilated (i.e., removed) so that contiguous regions are progressively unified, revealing new rectangles. This analysis is repeated until no further rectangles are left. After all rectangles are detected, contiguous rectangles get grouped into the output elements, so as to reveal the modules. Fig. 5 exemplifies the whole extraction phase.
(a) (b)
[image:10.612.142.472.252.349.2](c) (d)
Fig. 5.Node extraction: (a) Original diagram, (b) Detected rectangles, (c) Detected modules, (d) Line-segment extraction
4.4 Relation Extraction
endpoint, seeking for nearby segments and consider the closest ones on a proximity basis (using a window size parameter). From all candidate seg-ments, we select the longest one whose angle is beyond a given threshold, so as to keep moving along the path.
After detecting the paths, we have to analyze the endpoints. With this purpose, we applied a Machine Learning technique to classify endpoints according to their shape (e.g., arrow, line, diamond). In order to train the classifier, we first need a suitable representation for endpoint shapes compatible with classification algorithms. We chose to use Hu’s shape transformation instead of a pixel-wise conversion for robustness. Hu’s transformation defines 7 features of a shape that globally constitute a rotation and scale invariant descriptor [11]. We assembled a dataset of endpoints using Hu’s features and tagged them manually. This dataset was inputted to a Bayesian classifier5
for training, and the classifier was used to predict the shape of the endpoints.
4.5 Text Recognition
Following the separation of text and structures, our instantiation at-tempts to “read” the text boxes detected earlier by invoking an OCR system called Tesseract [20]. Tesseract is an open-source OCR engine that can process different image types and identify the text in them. Tesseract makes two passes on the images and uses an adaptive classifier trained on over 60.000 samples. The accuracy of Tesseract is good enough for processing CASE-generated images, thus suiting our purposes well.
4.6 Graph Assembly
Finally, after all the image analyses are concluded, we developed a com-ponent for creating a graph-based representation of the module view. To compute the information of the underlying model of the diagram, we fol-lowed a series of steps. First, a hierarchy of modules is constructed by observing those that contain other modules and those contained by an-other module. Then, modules and relations are linked. Three constraints are verified for this linkage, namely: (i) the distance between the extreme of a relation and a module must be lower than a pre-defined threshold; (ii) a relation is only valid if it connects two different modules; and (iii), no module has to include the other ones following the hierarchy.
Next, text boxes are associated with whatever module/relation they belong to. To do so, the distance from the center point of each text box
5
to modules (and relations) are computed, and then the text boxes are associated with the closest module (or relation) found.
The graph representation progressively emerges from the features ex-tracted with the different components of the pipeline. Our implementation currently outputs the graph in DOT6
, a standard format which can be easily visualized with a number of tools (e.g. Graphviz). Fig. 2 shows a graphical representation of a sample module view.
5 Experimental Evaluation
To assess the performance of our pipeline for module diagrams, we tested it with a dataset of images7
. This dataset was collected from two sources: (i) software architecture documents produced by students of a Software Design course taught at UNICEN University, and (ii) paper-scanned di-agrams from an architecture documentation book [4]. The dataset com-prises 60 heterogeneous diagrams, of which half of them are UML-compliant. The processing of each image took around 2 seconds (in average), run-ning on a notebook with an Intel I7 2.2 GHz processor and 4Gb RAM memory, under a standard OS. The performance of systems like IMEAV is generally determined by evaluating each phase separately [21]. Specifi-cally, we were interested in the accuracy of the module-view pipeline for element/relation extraction, text recognition and graph assembly.
Precision and recall measures were employed to gauge the quality of detection. To decide whether a particular image constituent was correctly detected, we analyzed the results after completing the Graph Building phase. This means that a relation is considered as a true positive if, be-sides being detected by the relation extractor, it connects the modules affected by it. A similar reasoning is followed for modules and text prop-erties. Since some phases are executed sequentially, we took into account error propagation throughout the pipeline. In the case of relations, be-cause their detection depends on the (correct) identification of modules, we consider an undetected relation as a false negative only when its as-sociated modules were correctly spotted. Analogously, we consider an incorrectly-detected relation as a false positive only if it connects mod-ules that were correctly detected. Thus, we tested the relation extractor only when the module extractor worked properly. Table 1 summarizes the results obtained in the experiments. In the table,nis the population
of modules/relations considered for analyzing the results, which in the
6
http://http://www.graphviz.org/doc/info/lang.html 7
case of relations is a subset of the total amount. Results are organized into two categories, differentiating those images with UML and non-UML features. We also included overall detection results.
Table 1.Accuracy of module and connector extraction
Module n Recall Precision Relation n Recall Precision non-UML 194 96% 98% non-UML 140 63% 89% UML-compliant 195 97% 95% UML-compliant 126 66% 88% Overall 389 97% 96% Overall 266 64% 88%
IMEAV was very precise for separating text and structure. We only found problems in some cases where the text areas “touched” other mod-ules or relations. The module detection obtained high recall and also high precision (˜97% for both), meaning that the pipeline succeeded at iden-tifying the majority of the modules. Yet, we observed issues with some images. On one hand, false negatives came from unclear or broken edges (see an example in Fig. 6a). On the other hand, false positives came from overlapping relations that were mistakenly identified as modules, because their intersection points formed a rectangular shape (see Fig. 6b).
(a) (b) (c)
Fig. 6.(a) Interrupted edge, (b) Rectangular areas, (c) Interrupted connectors
[image:13.612.216.400.416.464.2]extent, false negatives were caused by text that overlapped with lines (Fig. 6c). Similarly to the discussion of dashed lines, the number of false positives depends on how over-segmentation was dealt with. For the de-tection of relation types, a 10-fold cross validation was run when evalu-ating the Bayesian classifier with Hu’s discretization. We considered two types of module relations: unidirectional and bi-directional. The classifier achieved a precision of 88% for directional endpoints and 79% for unidi-rectional endpoints. When it comes to attaching text to its corresponding module/relation, 89% and 85% of the text areas were correctly associated for UML and non-UML diagrams, respectively.
Overall, the results showed that our pipeline was able to effectively reverse-engineer module views “as a whole”, in spite of some difficulties with the detection of relations. Furthermore, the pipeline behaved almost equally in both UML and non-UML diagrams, corroborating the robust-ness of the implementation.
6 Conclusions and Future Work
In this article, we have presented a fast and automated approach for recovering model-level information from architectural diagrams stored in static images. Our IMEAV framework defines a processing pipeline that is driven by architectural viewtypes. The pipeline is made of generic phases, which must be tailored to the vocabulary of the target viewtype. As a proof-of-concept, IMEAV was exercised with a special pipeline for mod-ule views. In this experience, we were able to reuse several components from OpenCV, but still implemented a few dedicated components for the viewtype. So far, modules are the only viewtype supported by IMEAV, but we will extend the framework with viewtypes for components-and-connectors, and for allocation.
identify architectural patterns and rules out of the graph-based represen-tation [2], improve Wiki-based assistants for architectural documenrepresen-tation [5], and use the knowledge of architectural views to recover traceability links to requirements and source code [18].
References
1. Bass, L., Clements, P., Kazman, R.: Software architecture in practice. Addison-Wesley Professional (2012)
2. Berd´un, L., D´ıaz-Pace, J.A., Amandi, A., Campo, M.: Assisting novice software designers by an expert designer agent. Expert Syst. Appl. 34(4), 2772–2782 (2008) 3. Bhatti, N., Hanbury, A.: Image search in patents: A review. International Journal
on Document Analysis and Recognition (IJDAR) 16(4), 309–329 (2013)
4. Clements, P.: Documenting Software Architectures: Views and Beyond. Addison-Wesley (2003)
5. Diaz-Pace, J.A., Nicoletti, M., Schiaffino, S., Villavicencio, C., Sanchez, L.E.: A stakeholder-centric optimization strategy for architectural documentation. In: LNCS: Model and Data Engineering, vol. 8216, pp. 104–117. Springer Berlin (2013) 6. Farenhorst, R., Izaks, R., Lago, P., van Vliet, H.: A just-in-time architectural
knowledge sharing portal. In: WICSA’08. pp. 125–134. IEEE (2008)
7. Gil, J., Kimmel, R.: Efficient dilation, erosion, opening, and closing algorithms. IEEE Trans Pattern Anal Mach Intell 24(12), 1606–1617 (2002)
8. Govindan, V., Shivaprasad, A.: Character recognition—a review. Pattern recogni-tion 23(7), 671–683 (1990)
9. de Graaf, K.A., Tang, A., Liang, P., van Vliet, H.: Ontology-based software archi-tecture documentation. In: WICSA’12. pp. 121–130. IEEE (2012)
10. Hammond, T., Davis, R.: Tahuti: A geometrical sketch recognition system for uml class diagrams. In: SIGGRAPH 2006. p. 25. ACM (2006)
11. Hu, M.K.: Visual pattern recognition by moment invariants. Information Theory, IRE Transactions on 8(2), 179–187 (1962)
12. Karasneh, B., Chaudron, M.R.: Img2uml: A system for extracting uml models from images. In: Soft. Eng. and Adv. App. pp. 134–137. IEEE (2013)
13. Kiryati, N., Eldar, Y., Bruckstein, A.M.: A probabilistic hough transform. Pattern recognition 24(4), 303–316 (1991)
14. Lank, E., Thorley, J., Chen, S., Blostein, D.: On-line recognition of uml diagrams. In: Document Analysis and Recognition. pp. 356–360. IEEE (2001)
15. Louloudis, G., Gatos, B., Pratikakis, I., Halatsis, C.: Text line and word segmen-tation of handwritten documents. Pattern Recognition 42(12), 3169–3183 (2009) 16. M¨orzinger, R., Schuster, R., Horti, A., Thallinger, G.: Visual structure analysis of
flow charts in patent images. In: CLEF’12 (2012)
17. Nagy, G.: Twenty years of document image analysis in pami. IEEE Transactions on Pattern Analysis and Machine Intelligence 22(1), 38–62 (2000)
18. Rago, A., Marcos, C., Diaz-Pace, J.A.: Uncovering quality-attribute concerns in use case specifications via early aspect mining. Req. Eng. 18(1), 67–84 (2013) 19. Rusinol, M., de las Heras, L.P., Mas, J., Terrades, O.R., Karatzas, D., Dutta, A.,
S´anchez, G., Llad´os, J.: Flowchart recognition task. In: CLEF’12 (2012)
20. Smith, R.: An overview of the tesseract ocr engine. In: ICDAR. vol. 7, pp. 629–633 (2007)