E
C
O
N
O
M
Í
A
SE RIE DOCUME NTOS
No. 71, julio de 2005
Corporate Valuation and Governance:
E vidence from Colombia
Luis H. Gutiérrez R. Carlos Pombo V.
BORRADORE S DE
INVE STIGACIÓN BORRADORE S
DE
© Centro Editorial Universidad del Rosario © Facultad de Economía
© Luis H. Gutiérrez, Carlos Pombo B.
Todos los derechos reservados Primera edición: julio de 2005 ISSN: 0124-4396
Impresión digital: JAVEGRAF - Colombia
ISSN: 0124-4396 Incluye bibliografía.
E CONOMÍA – COLOMBIA / ADMINISTRACIÓN DE E MPRE SAS – COLOMBIA / CONTROL – ADMINISTRACIÓN / ADMINISTRACIÓN FINANCIERA – COLOMBIA / FINANZAS – COLOMBIA / I. Título / II. Serie / III. POMBO, Carlos.
C
ORPORATEV
ALUATION ANDG
OVE RNANCE:
E
VIDE NCE FROMC
OLOMBIAL
UISH. G
UTIÉRREZR.
1lgutierr@ urosario.edu.co
C
ARLOSP
OMBOV.*
capombo@ urosario.edu.co
A
BSTRACTWe examine for the first time the association of different measures of ownership and control, and separa-tion ratios with firm’s value and performance for 108 non-financial firms that traded their stock during the period 1998 to 2002. We found that large block holders exert a positive influence upon firm’s valuation and performance, which validates the positive monitoring approach of large shareholders, but also found that this relation is not monotone implying that when separation of control and ownership tends to increase, a negative effect is exerted on firm’s valuation. Furthermore, we report first estimates of a survey of corporate governance practices conducted in 2004 for 43 Colombian non-financial companies. The index’s scores suggest that imple-mentation of good governance in Colombian firms has been slow and poor as measured by the average of the Index that is below half the maximum attainable value. Regrettably, we did not find any support to recent theories that predict a positive association between good governance practices, measured by the CGI, and performance. A t most there exists a positive relationship for sub-index but the results were not statistically significant in general.
Keywords: Ownership, Control, Corporate Governance, Colombia
JE L Classification: G32, L 14, L 22
1 Corresponding author: Luis H. Gutiérrez, Associate Professor, Department of Economics, Universidad del
Rosario. We want to thank Alberto Chong, Florencio Lopez de Silanez and seminar participant at the IADB Research Network meetings for their valuable comments and suggestions. We are especially grateful with Dr. Jorge Restrepo president of the Banco A grario de Colombia and former president of Fabricato who helped us to estab-lished direct communication with companies’ CEOs for the follow up of the survey on CG practices. We thank Rodrigo Taborda and Roberto Fortich for their research assistance. All errors are ours. Financial support for the IADB Research Network is gratefully acknowledged.
R
E SUME NE n este documento, se examina, por primera vez para el caso colombiano, la asociación que diferentes medidas de propiedad y control y las razones de separación tienen con medidas de valoración y desempeño de 108 empresas no financieras que transaron sus acciones durante el período 1998-2002. E ncontramos que los grandes accionistas ejercen una influencia positiva tanto sobre el valor de la empresas como sobre el desempeño, lo que valida el enfoque positivo de supervisión que realizan los grandes accionistas, pero también encontramos que dicha relación no es monótona lo que implica que cuando la separación entre las medidas de propiedad y control tiende a aumentar, se produce un efecto negativo sobre el valor de la empresa. A dicionalmente, presentamos los primeros estimativos de prácticas de buena gobernabilidad de una encuesta realizada en el año 2004 a 43 empresas colombianas no financieras. L os índices sugieren que la puesta en práctica de una buena gobernabilidad por parte de las empresas colombianas ha sido lenta y pobre medida por el promedio del índice que no llega a ser la mitad del máximo alcanzable. Desafortunadamente, no encontramos ningún sustento a teorías recientes que predicen una asociación positiva entre prácticas de buena gobernabilidad, medidas por el CGI, y el desempeño contable de las empresas. A lo sumo, puede existir una relación positiva entre algunos de los sub-componentes del índice pero los resultados no fueron en general estadísticamente significativos.
Palabras clave: Ownership, Control, Corporate Governance, Colombia
1. I
NTRODUCTIONThe analysis of corporate governance systems has attracted attention in recent years. Some studies have looked at the connection between ownership structures and performance while more recently others have focused on the relationship between corporate governance indexes at firm level and firm’s valuation and performance. In the first type of papers, researchers have tested two opposite effects of ownership upon performance. On one hand, large blockholders with good information on their firms have incentives to monitor managers and then to mini-mize agency problems of management entrenchment. This monitoring effect is positive. On the other hand, large blockholders’ incentives may be in opposition to those of minority. Some of these incentives can be building empire, excessive risk-taking and the like. This has been named: tunneling effect, which is of course negative upon firm’s valuation and performance. The second type of research has studied firm-level corporate governance mechanisms, and most of them have focused on cross-country analysis where the emphasis is on the effect upon governance of the legal systems across countries. La Porta, Lopez de Silanes, and Shleifer (1999) argued that investor’s protection tends to be greater when legal environment is stronger and therefore his willingness to invest tends to increase. That research has tested whether corporate governance helps explaining firm’s valuation and performance and they have found a strong positive association.
In this paper, we address both types of research. We first report results that link different measures of ownership and control, and separation ratios with firm’s value and performance for 108 non-financial firms that traded their stock during the period 1998 to 2002. After con-trolling for a variety of control variables, we find evidence that large blockholders exert a positive influence upon firm’s valuation and performance, which validates the monitoring ap-proach, but we also found that this relation is not monotone implying that when separation of control and ownership tends to increase, a negative effect is exerted on firm’s valuation.
Then, we report first estimates of a survey of corporate governance practices conducted in 2004 for 43 Colombian non-financial companies. These practices are turned into a corporate governance index, CGI that includes information on six different aspects: independence, ac-countability, fairness, responsibility, transparency and, discipline. The results suggest that imple-mentation of good governance in Colombian firms has been slow and poor as measured by the average of the Index that is below half the maximum attainable value. Colombian stock market is very undeveloped and is being shrinking if one measures it by the number of firms that have traded their stocks in the last five years. We then, try to address the question of whether better governance practices lead to better (accounting) performance. Using standard OLS and cor-recting for endogeneity, we found very disappointing results. Performance is not explained by good governance practices. This is the first attempt that has been made in Colombia to trying to verify that hypothesis, and nonetheless, we believe this research is helpful in the understanding of corporate practices in emerging economies like Colombia.
selec-tion, regression specifications, data descripselec-tion, main econometric findings, and present our four hypotheses. Section IV concludes and suggests some policy implications.
2. T
HE ORE TICALF
RAME WORK ANDW
ORKINGH
YPOTHE SISTwo of the most important features of modern corporations in most economies are the separation of ownership and control, and concentration of equity among shareholders. Berle and Means (1932) characterized the modern corporation in the US as the diffusion of equity among a large number of small investors none of which could individually take control over the corporation. La Porta, Lopez-de-Silanes, and Shleifer (1999) found that such characteriza-tion did not apply to other economies, except the United Kingdom. Their work clearly shows that modern corporations around the world exhibit very high degrees of ownership concentra-tion and a strong separaconcentra-tion between cash-flow rights and control rights.
Agency problems arise in any of the above types of characterizations. On one hand, the type of corporations found by Berle and Means (1932) suggest that management can be the ultimate controller of the firm and then they may create some forms of agency problems. Since small individual and dispersed shareholders could not embark on monitoring managers, due to a free-riding problem, managers with a very small ownership or no ownership at all became the ulti-mate controllers of firms. Management entrenchment turned to be the extreme form of this agency problem. On the other hand, when ownership is very concentrated new types of agency problems appear. Concerns are now related to the divergence of interest between block-holders and minority shareholders. Large shareholders can transfer “resources from the firm for (their) own benefit through self-dealing transactions …but also asset sales and contracts such as trans-fer pricing advantageous to the controlling shareholding, excessive executive compensation, loan guarantees, expropriation of corporate opportunities and so on… and the controlling shareholdings can increase their share of the firm without transferring any assets through de-lays in share issues… insider trading …or any other financial transaction that discriminate against minorities (Johnson 2000, 22-23). This kind of conduct has been called “tunneling” or search for private benefits of control (see also Bertrand, Paras, and Mullainathan 2002, and Holderness, 2003).
On a different perspective, some authors have argued that large blockholders can have a positive effect on firm’s valuation and performance. For instance, Shleifer and Vishny (1986) argued that, under the assumption that large shareholders are disconnected from management a large shareholder with a stake large enough in a company would have incentives to carry out some monitoring activity over the incumbent management. Hence some degree of ownership con-centration could improve control on management and so increase firm value. This second conduct of large blockholders is the monitoring over management view that clearly must have a posi-tive effect.
Khanna and Rivkin, 2001, and Bae, Kang and Kim, 2002)) that besides the fact most of firms are owned by large shareholders, they in most cases belong or make part of business groups.2
This dimension of ownership can deepen the agency problem of tunneling outlined at the end of the above paragraph. However, as Khana and Palepu (2000a) have found firms associated to business groups can enjoy some benefits, what they call the value added approach of being part of a group due to reduction in transaction costs, better chances of getting financial re-sources in very illiquid capital markets, reduction in diversification costs and the like.
Therefore, from a theoretical perspective, there is not ex-ante any unambiguous effect that should dominate. It will depend on whether the monitoring effect (positive effect), that sup-pose large block-holders can induce large profits and better share prices, will outweigh the tunneling or rent-extraction effect (negative effect), i.e., that blockholders will be rent-seekers and then be highly risk averse. In the last few years, research has been intense trying to see how those agency problems have operated in firms in developed and developing countries. In par-ticular, it has focused on how ownership relates to firm’s valuation and performance. Results have been mixed validating either the so-called tunneling view, or the monitoring effect, or the value added approach. For instance, on the negative side, for US corporations Demsetz and Lehn (1985), and Demsetz and Villalonga (2001) found that, after controlling for capital struc-ture, firm size, stock market risks, and other variables, ownership structure had no significant effect on firm performance. Gibson (2003) investigated the role of large shareholders in emerg-ing market corporate governance, where he defined a large shareholder as one who directly holds at least 20% of the firm equity (p. 244). He found (Gibson, 245) that the “link between earning/assets or the change in earnings/assets and CEO turnover is statistically significantly weaker at firms with a large shareholder.” This result suggests that the existence of large share-holders within a firm has a negative effect on corporate governance.
Lehman and Weigand (2000) also found a negative effect of ownership concentration on firm performance (ROA) for 361 German companies (183 of them listed companies). Yurtoglu (2000) in a study of Turkish corporate governance also reported, for a sample of 257 listed companies in 1998, that high stakes of ownership and pyramidal structures have a negative effect on performance measured by ROA and market to book ratios and dividend payments, although this effect is small.
On the positive effect side, the monitoring, or the value-added approach, Wiwattanakantang (2001, 325) using firm-level data for 270 non-financial listed companies in 1996, found for listed Thai firms that the presence of controlling shareholders is not “detrimental to the corpo-rate value.” On the other hand, Gispert (1998, 534) studying the Spanish case also found that
2 Of course, literature has also acknowledged that some of main rationale to create business groups is finding ways
“rotation of board members is inversely related to firm performance, and therefore large share-holders discipline board members as happens in other countries with similar dominant ownership structure.” Pedersen and Thomsen (2003) examined the relationship between ownership struc-ture and firm value for a sample of 214 companies for eleven European countries. Controlling for nation effects and for system effects (stock market efficiency, or the level of investor pro-tection), and using simultaneous equation approach, they found that ownership concentration, measured by the fraction of shares held by blockholders has a positive effect on firm value. Chen (2001) examined the relation between ownership structure and performance for a sample of 434 manufacturing firms listed on the Chinese stock exchanges, and found that ownership measured by the top one shareholder is not statistically significant in explaining valuation of firms but when he uses ownership concentration by the ten largest stockholders, then a positive relation is found, validating the value added approach.
Empirical works on the effect of firm’s affiliation to a business group has also flourished recently. Earlier studies on the subject were made on samples of Korean corporate firms (Chaebols) (see Chang and Choi, 1988) and Japanese corporate firms (Keiretsus) and showed a positive relationship between being part of a Chaebol (or Keiretsu) and economic performance, measured by the average annual rate of profits. Later, Bianco and Casavola (1999) for the Italian case tested how the identity of a controlling shareholder and his belonging to a business group affected company performance. They found that the identity of the controlling share-holder has a (weak) positive effect on performance suggesting that monitoring prevails. How-ever, they also found that firms belonging “to groups appear to be more prone to managerial error and to have a lower return on investment (1065).”
More recently, Khana and Palepu (2000a) found, for Indian groups that there exists a quadratic relationship between firm performance and affiliated group diversification. How-ever, in multivariate regression analysis, their findings clearly suggest that as “group diversi-fication increases, the performance of group affiliates declines relatively to that of unaffiliated firms until the group reaches a threshold diversification level” (Khana and Palepu, 869). Recent research on E ast Asian E conomies has shown some inverse relationships. For in-stance, Bae et al. (2002) test for Korean firms the two main competing hypotheses related to business group: the value-added view and the tunneling view, and found that “minority share-holders of chaebol affiliated firms lose from the acquisitions but the controlling shareshare-holders of these firms gain from them.” For India, Bertrand et al (2002) also shows that tunneling can be more common within business group since the controlling shareholder(s) can transfer resources, profit, etc, from firms where he (they) have low cash flow rights to firms where he has high cash flow rights.
effects of belonging to a business group: group affiliates enjoy higher profitability than unaffili-ated firms for three countries: weaker results for another three countries, including Peru; for Argentina, group firms appear to perform worse than independents; and a less weaker (negative) result for the rest of countries, that include Brazil, Chile and Mexico.
Holderness (2003) in a very illuminating survey on blockholders and corporate control poses four questions associated with blockholders: “How prevalent are blockholders? What moti-vates block ownership? What impact do blockholders have on major corporate decisions? And what impact do blockholders have on firm value?” (60-61). After reviewing some papers on the subject, he concludes, mostly for the United States, as follows:
“i. Insiders own approximately 20 percent of a randomly selected, exchange-listed corporation in the United States.
ii. Block ownership is motivated both by the shared benefits of control: blockholders have the incentive and the opportunity to increase a firm’s expected cash flows that accrue to all shareholders; and by the private benefits of control: blockholders have the incentive and the opportunity to consume corporate benefits to the exclusion of smaller shareholders. iii. Surprisingly few major corporate decisions have been shown to be different in the presence
of a blockholder. One exception is that external blockholders appear to monitor the form and level of managerial compensation. Conversely, there is little evidence that blockholders affect leverage.
iv. Ownership concentration appears to have little impact on firm value”.
In what follows, we present the main hypotheses related to the effects of block-ownership on firm valuation and performance that we will test empirically in the econometric section. We leave for the Corporate Governance Index section, literature review and the hypothesis that in this regard will be tested.
H
YPOTHE SE S:
Gutiérrez, Pombo and Taborda (2005) show that ownership concentration in Colombian listed companies is high measured either by the percentage of the largest shareholder, CR1, or by CR4, the blockholding of the four top shareholders. They also present the first results of separation between cash-flow rights and control rights for both affiliated and unaffiliated firms, and found that this measure is high for affiliated firms (and for unaffiliated ones too). That paper leads us to pose the following hypothesis:
Hypothesis 1 Higher cash-flow rights (direct ownership) and direct voting rights by the four largest controlling shareholders are associated with higher corporate valuation and better per-formance.
Hypothesis 2 Higher separation of voting from cash flow rights by controlling shareholders is associated with lower corporate valuation and worse performance.
3. E
MPIRICALD
E SIGN, S
AMPLES
E LE CTION ANDD
ATAThis section describes regression specifications, the resulting samples of firms chosen, their sources and selection, and the construction of main variables. It also describes briefly the con-struction of the data on ownership and control structures and separation ratios between own-ership explained in more detail in Gutiérrez et al. (2005).
3.1 R
E GRE SSIONS
PE CIFICATIONTwo types of specifications will be tested. On one hand, we will look for factors that deter-mine valuation and performance measures. On the other hand, we will look at what can explain corporate governance measured by an index constructed with a survey. In both cases, we will make use of some variables that capture some corporate governance mechanisms like owner-ship and control, and the Colombian corporate governance index (when applicable) while con-trolling for industry and other standard control variables. The following cross-section regression will be estimated for one of the three samples:
2
1 2 3 4 5 ,
1 1
( )
K J
i i i i k k i J
k j
i
Valuation α βOWN β OWN βWedge β BGA β Lyears δ X φSIC
ε
= =
= + + + + + + +
+
∑
∑
(1)
where Valuation (or performance3) is either Tobin’s q, market to sales, MTS, and market to
book ratio, MTBR, respectively; α, a constant; OWN, direct ownership by fourth largest share-holders; (OWN),3 is ownership to the square; Wedge is a measure of separation of control
rights from cash-flow rights. This measure takes the inverse of the sr1 to get the estimates;
BGA is affiliation of a firm to a business group; Lyears is number of years a firm has been listed. X’s are control variables; K, the number of control variables; SIC, industry dummy; i, firm; and e, is an error term.
Equation (1) is estimated for three different samples that are explained in detail below. We estimate the regressions using pooled-OLS, FGLS and panel data depending on the structure of the data set and variables available. For instance, for the small sample of 40 firms that responded the questionnaire of corporate governance, we cannot perform FGLS since we have just one observation per firm. On the contrary, for the balance panel data of firms for the period 1996-2002, we can run FGLS and panel data regressions.
To assess the relation between corporate governance index and firm attributes, we run each firm’s corporate governance score on other attributes of governance, and we control for other characteristics of firm, and estimate the following equation
1 2 3 4 5 ,
1
/
K
i i i i k k i i
k
CGI α βSalesGrowth βSize βK S β BGA β Lyears δ X ε =
= + + + + + +
∑
+ + (2)3 When the dependent variable is a performance variable, we will use returns on assets, ROA, or returns on equity,
where the vector X contains a set of further control variables. As Durnev and Kim (2005) stress, we must be cautions in drawing inferences with the results of this equation because of the potential problems of endogeneity. Nonetheless, in order to reduce endogeneity, we run regres-sion using instrumental variables that will be detailed below as well as some robustness checks.
3.2 S
AMPLES
E LE CTIONMain data was taken from Superintendence of Securities (henceforth SS) the regulatory body responsible for inspecting and overseeing Colombian publicly listed companies, supple-mented with data from Superintendence for Commercial Enterprises, the body responsible for overseeing other large non-listed companies. Data from both sources provided information on main twenty largest stockholders (whenever it was the case) and financial statements for a com-plete sample of 108 Colombian non-financial firms that had their stocks traded in the stock exchanges for the period 1998-2002.
For this research, we grouped three different data samples. For the first sample, we took all Colombian non-financial companies whose stocks were traded at least once in a year during 1998 to 2002. It means that we included in this sample all Colombian companies that traded their stocks during that period and took the year(s) when the stock was actually traded, and excluded those years when their stocks were not traded. We do so for the following reasons. First, Colombian companies can issue several types of securities like stocks, bonds, and com-mercial papers. However, only stocks are securities that have variables returns that depend on how well a firm is managed and how well its corporate governance is. Bonds and other types of fixed return securities can be assimilated to banks loans. Second, reliable data for (average) annual market prices of stocks is almost non-existent or hard to get for years other than the period selected. Since one of the objectives of this research is to test how valuation-firm mea-sures (like Tobin’s q) are related to ownership and other control variables, we had to get the stock market prices, and that was only possible for firms that satisfied the first and second points. Third, we constrained data to just the year(s) were the stocks were actually traded at least once during that year, making it a complete unbalanced panel. The rationale for do this stems from our interest in studying how the relationships of interest evolved during that period for firms that traded their stocks all the five years versus those that traded them four or less years. For all samples, we determined the primary industry in which each firm operated using the United Nations’ two-digit Standard Industrial Classification (SIC) system.
For the second sample, we stick to the same 108 firms but expanded the number of years to make the panel as balanced as possible. Thus, for all companies we took 1998 as the starting point of research regardless whether the firm had (or not) its stocks listed that year or whether they were traded.4 This makes the panel a balanced one. However, not for all firms the data
goes from 1998 to 2002 since some of them were just created during that period and corre-spondingly their panel can be lesser. One important implication of this second sample is that we can observe how different performance and ownership relation differ when firms’ stocks were listed against when they were not. The drawback of this sample is that we cannot estimate a firm valuation measure like Tobin’s q since for some firms and some years, market prices are
4 However, we have not been able to determine for some firms whether for the years 1996-7, those firms were listed
not available. To overcome this, we rely on more general accounting measures like return on assets, ROA, and return on equity, ROE. We will explain that in more detail below.
The last sample is composed of merely 43 firms that were listed in Colombian Stock Ex-change for the years 2003 and 2004. That number is not arbitrary though. It resulted from the number of companies that kindly responded a questionnaire about corporate governance prac-tices from a universe of about 99 non-financial firms.
Regardless of the sample, some criteria were used to exclude firms from the analysis. The first one refers to the exclusion of financial firms, regrettably very important in a small stock market like the Colombian one, and public utilities companies. Main reason is that this type of corporations is subject to very specific regulations and so their performance and valuation measures are not strictly comparable. Lastly, we excluded some firms whenever we could not find reliable information either on stock prices or financial statements.
3.3 D
ATA3.3.1 OWNE RSHIP AND CONTROL DE FINITIONS
Berle and Means (1932) stressed the difference between ownership and control. In their work, they estimated separation of ownership and control among the 200 largest American corporations. For them, it was clear that “Since direction over the activities of a corporation is exercised through the board of directors, we may say for practical purposes that control lies in the hands of the individual or group who have the actual power to select the board of directors (or its majority), either by mobilizing the legal right to choose them –“controlling” a majority of the votes directly or through some legal device –or by exerting pressure which influence their choice” (page 69). However, corporate research for many years focused only on the structure of corporate ownership putting aside the overwhelming differences between control and owner-ship. In the United States, the main early works were conducted by Demsetz and Lehn (1985), and Morck, Shleifer, and Vishny (1988) who used ownership corporate estimates to test whether such measures had any bearing on corporations’ profitability. Prowse (1992) conducted a simi-lar research on Japanese corporations.
More recently La Porta et al. (1999) came back to the seminal analyses of Merle and Means by looking at what they called ultimate owners. In their words (page 476) “…a corporation has a controlling shareholder (ultimate owner) if this shareholder’s direct and indirect voting rights in the firm exceed 20 percent.” That percentage was estimated following a chain of control’s links of votes. Claessens, Djankov, Fan, and Lang (2002) also studied the separation of owner-ship and control and used a slightly different measure than La Porta et al. They estimated the separation ratio as follows: “suppose that a family owns 11 percent of the stock of firm B. We then say that the family controls 11 percent of firm B –the weakest link on the chain of control rights. In contrast, we say that the family owns about 2 percent of the cash-flow rights of firm B, the product of the two ownership stakes along the chain.” In both studies, researchers used different cutoff points to determine effective control.
recent papers by Chapelle and Szafarz, 2002, and Chapelle, 2004). Gutiérrez et al. (2005) provide a thoroughly detailed explanation of the methodology and present general estimates for a sample of about 148 Colombian companies some of which will be used here when testing our hypothesis. The first variable estimated is direct ownership stakes (cash-flow rights) held by the largest, the two largest, the three, the four, and the ten largest shareholders (CR1, CR2, CR3, CR4,
CR10). To assess potential non-linearities, we also include concentration ratios to the square (i.e., [CR4]2). The input-output methodology also allows to estimate what it is known as the
integrated ownership (direct and indirect voting rights) and with this and the directed owner-ship we estimated different measures of the separation ratio for the whole number of share-holders, for the largest one, for the two largest ones, and the four largest one. We denote by srn,
sr1, sr2, sr4, the ratio of cash-flow rights to voting rights of the ultimate, the two largest, and four largest blockholders respectively. The separation ratio between ownership and control goes from zero to one; it is equal to one when the separation is zero and one when it is nil. By assumption, firms that do not belong (or were not identified as belonging) to any (known) business group get one. Lastly, following Claessens et al. (2002), and with the above informa-tion, we estimated three additional wedge variables. The first one is the difference between control rights and cash-flow rights, we called Dif1. This is a continuous variable. The second one, Dif2, is a dummy variable that takes the value of one if control rights exceed cash-flow rights, and zero otherwise. The last one is, Dif3, a dummy variable that takes the value of one if ownership stakes exceeds control rights of a given number of chosen shareholders and if this difference is above the median separation, and zero otherwise. These variables can be con-structed for the (difference of ownership from control) top one, the top two, the top three shareholders and so on. We chose to construct it only for the four largest shareholders.
Given some constraints on disclosure of information, we are not able to provide names of individuals as ultimate owners, and we did a taxonomy regarding whether a firm is widely held or closed. This last information is only available for the econometric exercise of relating gover-nance and performance. In our empirical section, we will include dummies to account for firm affiliation to a business group and for the presence of a foreign stockholder among the five largest shareholders in each firm.
3.3.2 VALUATION AND PE RFORMANCE ME ASURE S
Our study is focused on Colombian listed firms during the period 1998 to 2002 supplemented with a preliminary analysis of a survey of corporate governance practices for the year 2004. Our main data set is then composed of those firms that traded their stocks in at least one year during 1998 to 2002. The main reason to get this sample was to estimate market valuation measures like Tobin’s q.5 To estimate Tobin’s q, we follow Black, Jang, and Kim (2003) who defined it as the
ratio between market value of assets to the book value of assets. As in the case of Korean firms, Colombian accounting and tax regulations require that all firms update their book values yearly, so the use of book value of assets must be very close to replacement costs. Market value of assets
5 Average market prices for Colombian firms are not quite updated and data sets usually present some differences.
When a firm is not listed in the stock exchange, or retired, its market price is not reported and then any market
was estimated as the sum of book value of debt plus book value of preferred stocks plus market value of common stock. In turn, the yearly market value of common stocks was calculated as the product of the average market price times the number of common stocks. The book value of liabilities (in Colombian pesos) was taken as the book value of debts.
Researchers in the field of finance have recently suggested that for emerging economies, Tobin’s q could not be a good indicator of firm value given some measurement problems. They have proposed further related value measures. The first one is market-to-book ratio, MTBR, defined as the ratio between market value of common stock (as defined above) and book value of common stock; this latter estimated as the sum of the book value of assets minus the book value of liabilities minus the book value of preferred stock. The second measure is market-to-sales ratio, MTS, market value of common stock divided by sales.
Unfortunately, firm market value cannot be obtained when firms are not listed or when they delist or do not trade their stocks. Since two of our samples are composed of firms that fall in either category, we also estimated two accounting performance measures like returns on assets,
ROA, and returns on equity, ROE, respectively following standard definitions.
3.3.3 GE NE RAL OVE RVIE W OF OWNE RSHIP, VOTING RIGHTS AND SE PARATION RATIOS
Table 1 offers the reader a general view of our statistics on ownership, voting rights and separation ratios. The first two columns show industry classification and the number of firms in each of them. Then, it presents averages of main ownership and control variables. These are the cash-flow rights (CR1, CR2, CR4, CR10), the control rights (Voting 1, Voting 2, Voting 3, Voting 4) for the largest, the two largest, three and four largest shareholders. After them are the ratios of separation between ownership and control (SR1, SR2, SR3, SR4); the wedge at the cutoff point of ten percent; and three variables closely related to governance and ownership and control: whether a firm is or nor affiliated to a business group, whether there is a foreign investor among the five largest shareholders, and a variable that captures how much in a year over the opened days of the stocks, firm’s stocks were traded.
them belonged to business groups. This is not surprising since these types of firms are the core
holdings of the groups. Foreign investors were very rare. In nine industry sectors, there was not
any firm with at least one single investor among the five largest shareholders. The presence of foreign ownership was important in firms located in paper, paper products, publishing and basic metal industries. Lastly, in just one single sector, wholesale and retail trade, firms’ shares were actively traded during a year. In twelve industries, shares were very illiquid since they were traded in less than ten percent of the number of days, the Exchange was opened.
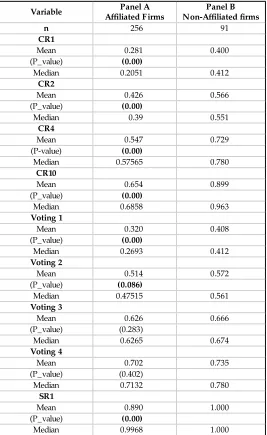
Since association to a business group is a feature of listed Colombian companies, Table 2 reports the means and medians of the same variables presented in Table 1 but split in two panels: firms that are affiliated, and non-affiliated to groups. There one surprising result is seen. Non-affiliated firms are, on average, more concentrated and retain more control than affiliated firms. The rationale can be that those firms may feel more insecure given the weak legal corporate framework and so their float is very low. They just traded to comply with minimum regulations. But more research must be done to find out what explains it.
3.3.4 OTHE R VARIABLE S RE LATE D TO FIRM’S GOVE RNANCE
In section C.1 above, we described our measures of ownership, control and the separation ratios. From the separation ratios, we follow Durnev and Kim (2005) and define Wedge, as a dummy equal to one if control exceeds ownership in some percentage, and zero otherwise. Two cut-off points were selected: 10% and 30%. The former is suggested by La Porta et al (1999), while the latter was chosen because it is the average of the CR1 measure found in Gutiérrez et al. (2005). A priori, one could either expect a positive or negative relationship with firm’s valuation. Firm age is another control variable included in testing relationship between governance measures and firm’s performance. It is said that older firms are likely to have lesser growth rates and so should be valued less or have lower performance. Since data availability precluded us to use that variable, we proxy it by using the number of years a firm has been listed in the stock exchange, Lyears. Information on this variable was found in the Colombian Stock Exchange. As in Black et al. (2003), we expect a negative relationship between it and valuation and other performance measures.
Colombian capital market restrictions on foreign capital were eliminated by the early 1990s. Recently, McKinsey & Company published the results of a survey. The survey gathered re-sponses about investment intentions from over 200 institutional investors, who together man-aged approximately US$3.25 trillion in assets. (See McKinsey & Company 2000, 1). Among the main findings of that survey was that foreign investors would pay, for invest in Colombian companies with good governance, an average premium of 27.2%. We control, then, for the presence of foreign ownership, FO, among the first five largest shareholders using a dummy with value one in case there was one, and zero otherwise.
its principals and its representatives, and since the Code of Commerce make all of them liable as legal representative, we included the sum of them. We expect a positive relation with perfor-mance due to the incentive effects of monitoring that the board exerts on management. Lastly,
Trading is a variable that is in percentage terms. It shows the ratio of the numbers of days a firm’s stocks were traded during a year to the total days the stock exchange was opened.
3.3.5 OTHE R CONTROL VARIABLE S
Literature on corporate governance has determined a group of standard control variables commonly used. All variables whenever be the case are expressed in Colombian pesos of 1998. Sales and assets have been extensively used as measures of firm size. Some authors provide good insights why this variable is a good control one. For instance, Klapper and Love (2004, 713) argue “the effect of size is ambiguous (on governance) as large firms may have greater agency problems and, therefore need to compensate with stricter governance mechanisms.” Durnev and Kim (2005, 1474) suggest, “Because larger firms tend to attract more attention and may be under greater scrutiny by the public, size may affect governance structure.” Himmelberg, Hubbard, and Palia (1999, 364) state “Firm size has an ambiguous effect a priori on the scope of moral hazard.” They argue that large firms are more prone to monitoring and agency costs so (managerial) ownership should be greater. But, on the other hand, large firms may have greater economies of scale in monitoring by large stockholders (management in their case) and by rating agencies that may lead to a lower need of large ownership stakes in the firm. We use primarily sales. Assets will be also used as an alternative. And as in most studies, firm size enters as the natural log of the variable. We have then, for sales,6LRSales, and for assets, LRAssets (in 1998 Colombian pesos).
A second variable controls for firm’s investment opportunities. Klapper and Love (2004), Black et al (2003), Himmelber et al (2001), and Durnev and Kim (2005) among others use some type of average growth rate of sales. On the potential effect of this variable on perfor-mance (and governance) Klapper and Love (2004) say that “small firms may have greater op-portunities and, ...(may)…be in greater need for external finance and better governance mechanisms.” A positive relation with firm value would be expected. To proxy for growth opportunities, we then include a moving average of the three previous real annual percentage growths in operating income,7 GrSales (in 1998 Colombian pesos).
Most research on the subject tends to control for intangibles too. Durnev and Kim (2005), Black et al. (2003), Himmelber et al. (1999), and Demsetz and Villalonga (2001) among others controlled for what they call discretionary spending. In this category falls expenditures in R&D, advertising, and the like. Most of the measures are flow variables but some authors also use stock variables to proxy intangibles (See De Jong 2002). Since, we did not get financial reported values for either R&D or advertising spending, we make use of the ratio between fixed capital (property, plant and equipment) and operating income. One should expect a negative relation with firm value since market can value intangibles more than what they meant in book values.
6 Actually, we make use of operating income instead of sales. The difference between these two variables is small
though.
We include a control variable for leverage that we proxy as the debt-to-asset ratio, Debtratio. The effect of leverage on firm value is ex-ante ambiguous.
We control for industry dummies, SICi, to account for differences in asset structure, market competition, and other idiosyncratic aspects, which may affect firm valuation, ownership or corporate governance. We classify industries with the 2-digit United Nations Standard Industry Classification.
3.4 D
ATAANDC
ONSTRUCTION OFC
OLOMBIANC
ORPORATEG
OVE RNANCEI
NDE X3.4.1 SOME INSIGHTS
Fllowing Jensen (1993), four mechanisms of corporate governance are worth studying. The first one refers to legal and regulatory mechanisms; the second are internal ones; the third ones are external mechanisms and the last ones are product market competition.8
However, is evident that for most emerging economies, the third, and the last mechanisms are less valuable since the main mechanism of the third group, takeovers, are almost nonexist-ent given the high degree of control among the largest shareholder(s), and for the four group, one assumes that either in case of the agency problems of management entrenchment or in the case of ownership concentration, firms are efficient under the market structure in what they compete. Then, we are left with mechanisms belonging to the first two groups. Although, the legal system within a country is given and is the same for all the firms, good governed firms in weak legal systems like the Colombian case would try to differentiate from bad governed ones going beyond the legal system. Or else, in more global and interrelated capital markets, firms that want to get capital in external markets need to adopt internationally corporate governance standards that are usually above the one imposed by domestic legal rules. Regarding the second group, main mechanisms are: the board of directors, executive compensation and ownership, minority privileges, and the like.
Research on corporate governance has been mostly conducted on mechanisms like owner-ship and boards of directors. More recently, research on the field has turned to surveys to get information of how firms set the different governance mechanisms included in groups one and two. That information has come primarily of reports from specialized international agencies like Credit Lyonnais Securities Asia (CLSA), Deminor, Standard and Poor and others, which calculate indices of corporate governance rankings. For instance, Klapper and Love (2004) used the CLSA ranking as a proxy of the firm-level corporate governance for 495 companies across 14 emerging economies. They then address the question of how performance at firm-level is explained by that index. In a cross-country study on 859 firms in 27 countries, Durnev and Kim (2005) also used the CLSA ranking as a proxy of firm corporate governance and complemented it with the Standard & Poor’s measure of corporate disclosure practices (as a proxy of firm disclosure) to test whether that index could explained (and was explained by) firm’s performance.
8 A slightly different classification of mechanisms is found in Agrawal and Knoeber (1996). These are: shareholding
Country studies on corporate governance have not been abundant though. Drobetz, Schillhofer, and Zimmermann (2004) constructed a corporate governance rating for 91 Ger-man public firms. Using a questionnaire with a variety of corporate governance practices, they look at how firms have complied voluntarily with the recently issued German corporate gover-nance code. They also tested how the index can explain firms’ performance and valuation indicators. Black, et al. (2003) also constructed an index of corporate governance for a (very large) sample of Korean listed firms from a questionnaire designed by the Korean Stock Ex-change. In this case, the authors took the survey’s results and proceeded to design the index. Black (2001) used a corporate governance ranking developed by a Russian investment bank to test whether this ranking was correlated to firm value. The ranking ranges from zero to 60, being 60 the worst corporate ranking. Finally, Gompers, Ishii and Metrick, (2003) constructed an index of corporate governance, for a sample of U.S. firms, based on some antitakeover defense provisions in the line of the third group of governance mechanisms outlined above.
3.4.2 QUE STIONNAIRE DE SIGN AND CONSTRUCTION OF THE CORPORATE GOVE RNANCE INDE X
In this research, we follow the common procedure of sending a questionnaire to Colom-bian public companies based on a sample of questions designed by IADB project’s directors. The questionnaire was clearly inspired upon CLSA questionnaire. There exist some key diffe-rences though.
The first difference is who responded the questionnaire. In our research we sent them di-rectly to main company’s officers while in the case of CLSA its own team of financial analysts responded the questionnaires. The second aspect regards questions. In our questionnaire,
ini-tially, there were 67 questions organized around four criteria: general principles, senior
manage-ment and the board, shareholders and disclosure. The second criterion had 25 questions, the third 20, and the remaining between the two others. Contrary to the CLSA there were not any ex-ante weight assigned to any criterion. However, the questionnaire was subject of revisions or refinements after we received them filled out and some questions were deleted.
The third aspect is related to the way questions were posed. For instance, the way CLSA posed some questions is “Is it true that there has been no controversy….?” A yes-answer is then assigned a one and a no-answer gets a zero. In our case, unfortunately, some questions were posed as “Has the board received any complains from shareholders in the last three years?” (Survey question 32). It is clear that a yes-answer has to get less valuation than a no-answer. For all other questions, a “yes” answer is interpreted as a pro-shareholder action and we assign it a value of one.
con-fuse or ambiguous as to which answer indicated better governance; or overlapped highly with other question(s). Second, we bundle questions around the same criteria established by CLSA. Hence, we have six criteria: discipline (4), accountability (2), responsibility (3), independence (4), transparency (13) and fairness (5), where the number between brackets is questions for each criterion. As a result of the refinements, transparency got a greater number of questions while accountability had very low questions. After the final refinements, we have six sub-indi-ces, each one standardized to have a value between 0 and 20. The sum over those sub-indices gives the overall corporate governance index.9 Table 1-A in the appendix shows the questions
left and some statistics of the survey.
3.4.2.1 Sample of Companies
The number of non-financial companies registered as issuers of any kind of securities was about 104 in 2004. Bearing in mind that, the questionnaires were sent to ninety-nine companies that were (then currently) listed in the second half of year 2004 and that belonged to different economic industries. The criteria of selection of firms were motivated by considerations like size measured either by sales or assets, importance within a business group and its weight within the Colombian stock market. The full list of companies that responded the question-naire is in Table 3.
At first, a total of five companies refused to answer the questionnaire arguing that the infor-mation was “confidential” a response that is at odds with the condition of being “a public company”. Thirty-nine of the surveyed companies kindly responded the questionnaire. To get a higher number of companies in the final sample, we proceeded to selectively fill out the questionnaires for 10 of the companies that did not respond it. The criteria for selecting those “extra” companies were the information publicly and non-publicly available we had gathered and the quality of it. That leaves us with 49 companies who responded the questionnaire. However, three companies belonged to regulated industries, and for other three, we could not get financial statements. So at the end, the Colombian corporate governance index we present comes from a sample of 43 non-financial firms (See Table 3).
3.5 S
URVE YR
E SULTSOFC
OLOMBIANC
ORPORATEI
NDE XTable 4 reports the first results of a corporate governance index for listed Colombian com-panies. The table has seven columns. The first six of them are the different sub-components taken from CLSA classification. They are: discipline, accountability, responsibility, indepen-dence, transparency, and fairness. The last column is the corporate governance index, CGI.
Looking at the table, the mean of the CGI, 49.9, it is clear that implementation of corporate governance practices has been very poor among the sample of Colombian firms that responded the questionnaire. In only one sub-index, accountability, the average (11.1) represents about sixty percent of the maximum attainable (20) but that may be explained by the low number of questions that component has (two). Independence and fairness are practices that seem not be
9 To obtain each standardized sub-index we multiply the raw sub-index by 20. Although this method introduces a
implemented by firms in this sample since averages are only close to thirty percent of the maxi-mum attainable. Only half of the firms got average above 50 points.10 Table A-1 in the
Appen-dix presents information about the final questions from which we construct the CGI, and the percentage of yes-answers each one obtained and their averages of the final 43 firms. To illus-trate, only 9 firms had scores between 60 and 70 points; 12 where between 50 and 60; and 17 got scores between 40 and 50 points.
4. E
MPIRICALR
E SULTSIn this section, we first make a statistical and graphical analysis of variables used in the econometric section. Second, we report econometric results on the relation between firm valu-ation and some measures of ownership and control, other governance measures and control variables for the period 1998 to 2002 for firms that had their stock traded in the Colombian stock exchanges. Then, for the same number of firms, we report results on the relation between performance measures and ownership and control variables for the period 1998 to 2002, re-gardless of whether their stocks were or not traded. Lastly, for a reduced sample of firms we report the relation between performance measures and the governance index, and some other governance and control variables.
4.1 S
TATISTICAL ANDG
RAPHICALA
NALYSISTable 5 reports descriptive statistics for the variables used in one of the econometric regres-sions. Panel A reports the statistics for the period 1998-2002 for the Colombian non-financial companies that had their stock traded at least one year during that period. In general, that table shows some very general results. The most important is that ownership concentration has been high since the CR4 is about 60% what must have given them full control of the company. Separation of ownership and control is low. The separation ratio for the ultimate owner is about 0.92, where if the indicator is close to one it means separation is almost null. Tobin’s q is under one what can be understood as a high perception of agency problems by market investors for that sample of firms. Two interesting results are Trading and Bursat. The former shows the average percentage of days a stock was traded in a year. It is about 0.17 what means that shares, on average, had very low trading. Bursa is a variable that measures how much in terms of days and number of shares; stocks were traded for a given company. 10 is the maximum level and zero the minimum. The average is under 4 what again verifies the low liquidity of stocks of Colombian listed firms during that period.
More striking results are seen in panel B11 that are worthy being commented. The first one is
the declining trend in the number of firms that traded their stock s. In 1998, there were 97
non-financial firms that traded their stocks in the stock exchanges. That number decreased to 81 in the following year, and in 2002, there were only 50 firms, a decrease of 47 firms: a reduction of about 45% of companies in an already tiny market. The second result is the counter-intuitive increase in stock trading (Trading increased from a low .13 to .24.). This could be explained by
two opposed forces. On the one hand, one could think that stocks with very low likelihood of being traded quit the market; or on the other hand, that firms (stocks) that remained in the market were the more active.
Apparently both forces operated. A standard test of equality of means of the two groups of firms, (no presented) where one group is formed by firms affiliated to business group, and the other by non-affiliated firms, shows that statistically both means are quite different.12 Then, the
variable trading could have increased because non-affiliated firms chose to put their stocks out of the stock exchange. The third result is the declining trend in Tobin’s q, too. From a value close to one in 1998, it steadily declined (year by year) to reach 0.72 in 2002, a too large reduction in firms’ valuation. The fourth result is evolution of direct ownership concentration by the top largest stockholders. the annual growth rate in sales (operating income) that firms had during 1998 to 2002. During the period there was a slight increase in CR4 ratio.
Figures 1 to 4 plot the relationship between Tobin’s q and two variables of ownership and control, sales growth, and ROA. All figures show a disappointing flat relation between Tobin’s q and the variables chosen. These graphical results can be compared with correlations between vari-ables shown in Table 5, Panel C. There it is evident that Tobin’s q is (very) weakly correlated with all variables except with market-to-book ratio. In particular, the correlation between Tobin’s q and ownership variables like CR2, CR4, SR1 and Wedge is weak but positive. Tobin’s q is negatively related to the number of years a stock have been listed and with trading, the percentage of days (over the maximum) a stock was traded (within a year). And the relationship of ROA and ROE with the rest of variables is also weak, although less, except with leverage, proxy with debt-ratio. Figure 5 and 6 plot the association between Tobin’s q and two of the measures of direct ownership, CR1, and CR4. Two different insights can be obtained. From Figure 5, it is apparent that firm valuation slightly increases with the share of ownership stake of the largest share-holder when this stake is less than 10% but decreases with a stake of 15%. It again increases until it reaches 30% and falls again. From a higher stake (35% or more), the relationship is very opaque, increasing and decreasing but seems, at very high levels to be inversely related. One can think that the positive incentive effects of larger cash-flow ownership on firm value prevail for some low ranges but in other ranges the negative effect prevails. The relationship is slightly clearer when we look at the relationship between the stakes of the four largest shareholders and firm valuation presented in Figure 6. There, it is clear that stakes higher than 35% are more associated with higher Tobin’s q although again the relationship is not quite monotone. None of the figures validate our hypotheses but help in explaining the association between ownership and firm value. In the next section, we will address formally whether, when allowing for other control variables, the relationship is positive or negative.
4.2 E
CONOME TRICR
E SULTS4.2.1 FIRMS THAT TRADE D THE IR STOCKS DURING 1998-2002
In the next two sub-sections we report findings for firms that traded their stocks at least once in a year during the period 1998-2002. The data set is very unbalanced since some firms only
traded theirs stock a single year, others traded two, three or four years, and a small number traded the five years. For this sample of firms, we ran pooled-OLS and corrected for heteroskedasticity. The first subsection presents the findings using firm’s valuation measures: Tobin’s, market-to-book ratio, and market-to-sales ratio as dependent variables, while the second presents the findings for firm’s performance measures: ROE, return on equity, and ROA, return on assets.
4.2.2.1 Relation between Valuation Measures and Firm’s Ownership and Voting Rights
Tables 6 reports the results of regression (1) with Tobin’s q as dependent variable while Table 7 report the results for market to book ratio and market to sales. In Table 6, we present nine different runs using a different set of control variables. In the first basic specification, we include size of the firm, sales growth, debt-to-asset ratio, intangibles, business affiliation to a group, presence of a foreign ownership, number of years the firm had listed their stocks, a recession dummy, and industry dummies to capture some idiosyncratic characteristics of every industry like technology, market competition and the like. The second one adds direct ownership stake of largest four shareholders and its square to capture non-monotonicity. The third adds to the previous the square of sales as in Himmelberg et al. (1999). The fourth and fifth specification drops ownership variables and replaces them with voting rights of the four largest shareholders. The sixth and seven run regressions following Claessens et al (2002) to control for different wedge measures, and we include Dif1. The last two regressions include Wedge10, a separation dummy between control and ownership proposed by Durnev and Kim (2005). This set of regressions tries to test hypotheses I to III above. There should not be significant colinearities in the regressions since correlations among variables are very low.
The results of specifications (2) to (9) clearly validate hypothesis I. Regardless of the variable of ownership or control taken, stakes of the four largest shareholders is Positively associated with higher firm valuation at significant levels of ten percent or better. In all cases, the coefficients are similar, ranging from a low 0.66 to a high 0.76, what shows the robustness of the results. The magnitude of the coefficients also shows that the effects are economically very significant. For instance, taking specification (2), a one standard deviation increase in ownership concentration of the four largest shareholders induces a 0.066 increase in Tobin’s q, what represents an in-crease of about 8 percent of the average Tobin’s q (0.82). However, the relationship is clearly non-monotone since in all specifications increases in the direct stakes of ownership are nega-tively associated and significant with Tobin’s q. Then, although the positive effect of ownership over firm value is validated, there are thresholds after which firm value start declining. The com-bining effect of ownership (CR4 and CR42) on firm’s value is negative but economically
insignifi-cant (-0.2%) what means a decrease of .0018 points over the mean of the Tobin’s q. Unfortunately, hypothesis II is not validated in this specifications since we got positive relations in two of them (6 and 7), and negative but statistically insignificant in other two.
firms did during the 90’s. The second finding is the coefficients found on the variable the years listed. It is statistically significant in all regressions and negatively associated with firm value. One can think that this result is counterintuitive since one could expect that the more years a firm’s stock has been listed, the better would be firm value since firm reputation in the market is consolidated and so is firm value. However, Black et al (2003) as well as other authors took listed years as a proxy for age. In their insight, “more recently listed firms are likely to be faster-growing…” Apparently this is also the case in Colombia. The third finding is the positive but non-significant association between the recession dummy and firm value. One would expect that a recession affect performance and then it would reflect into a lower firm valuation. The reader must recall from Table 5 that Tobin’s q had a steadily declining trend13 during the period
under study regardless of the overall economic environment. Therefore, the positive associa-tion stems from that declining trend.
Furthermore, other control variables were also significant. The debt-to-asset ratio was very significant and positively associated to firm value in all regressions; and the capital intensity variable was negatively associated to Tobin’s q. With respect to debt-to-asset ratio, some theo-ries have been posed to explain relationships. De Jong (2002) summarized theotheo-ries explaining the disciplinary role of leverage.14 There, he explains that leverage may be a device to discipline
the incentives that managers have to expand firm size and get private benefits from that conduct. Debt must be paid out of the cash-flow the firm generates. On the other hand, lever-age can generate opposite incentives to manlever-agers or owners given the existence of corporate governance mechanisms. If managers want to retain control and increase firm’s size they are forced to issue debt since issuing stocks will dilute their control. Disciplinary corporate gover-nance devices like the threat of takeover also lead them to increase leverage.15 In the
Colom-bian case, (founding) owners have been afraid of losing control given the weak legal framework, and has only traded historically a small amount of firm’s shares in the stock exchanges. They have expanded firm’s size and retained control via leverage. Then, it is plausible to find a positive relationship between leverage and firm value (See similar finding for the Korean case in Black et at., 2003). The economic significance of this variable is high since it shows that a one standard deviation increase in debt-to-ratio increases Tobin’s q by 0.07 points, a 9% in-crease relative to the 0.82 sample mean.
With regard to the relation between K/S and Tobin’s q two aspects must be analyzed. The first one is the expected negative association found. Bearing in mind that the indicator measures “the alleviation of agency problems due to the fact that such assets are easily monitored and provide good collateral” the negative sign means that the stock market values more the intan-gibles of the firm that what is represented in book values. Another interpretation may be that an intangible of the firms is their high collateralization of assets that helps leverage. The second point is that magnitude of the coefficients was low. In any case, more research must be done trying to disentangle this association.
13 During that period the guerilla intensified its attacks against the infrastructure and civil population and the
weak-ness of the government affected investors’ confidence.
Finally, firm’s size measured by sales had always the expected negative association with Tobin’s q, and in some of the regressions, the association was statistically significant. Larger firms are assimilated to mature industries that have lower growth opportunities and so lower market valuation. The moving average of sales growth in the past three years had also the expected positive sign but in none of the specification it was statistically significant and the eco-nomic magnitude of the coefficient was very poor. The presence of foreign ownership was not significant and with the opposite expected sign. The number of years a firm has been listed in the stock exchange was statistically significant in all regressions and with the ex-pected negative sign. It is said that firms recently listed are likely to growth faster since they have better future growth.
All the above results are very robust. From baseline specification (1) one can get the basic values the coefficients of the control variables were when none of the ownership or voting variables were added. The inclusion of these variables did not change any of the signs of the coefficients of control variables and the magnitude of them remained. The R2 is a little bit
larger for specifications (2) to (9) implying that the inclusion of ownership and control account for some slight but important differences in Tobin’s q.
With respect to the other two firm valuation measures, the market-to-sales ratio and the mar-ket-to-book-ratio both presented weaker results. Table 7 reports six different runs. The economic significance of ownership alone and with its square is very similar for MTBR to those found in Tobin’s q although the statistical significances decreased for the CR4 variable. The table just confirms that there is a non-linear relationship between market valuation and direct ownership concentration. None of the wedge variables happened to be significant statistically. So hypoth-eses II and II are weakly verified. Hypothesis III is verified for the MTS measure but not statisti-cally for the MTBR. That is, business group affiliation in both cases leads to better market valuation. The table shows other mixed results. Foreign ownership has the right expected sign with MTS and statistically significant but a negative relation with MTBR. Leverage has a wrong sign association with market to sales ratio. However, K/S keeps being negatively associates with these two mar-ket valuation but the statistical significance is only valid for MTBR.
In sum, market valuations did seem to be affected positively with the level of ownership concentration (and control rights) of the four largest shareholders suggesting that owners exert a monitoring role over management. Firms affiliated to business groups are also more valued and this is a very important fact. How to explain it? Once can think that investors want to hedge against potential expropriation problems that arise in very weal legal and regulatory frame-works. Since they bet that large owners will exert a monitoring effect on management and given the high level of ownership, they do not fear too much any sizable tunneling effect. In next subsection, we will report results for accounting measures of performance.
4.2.1.2 Relation between Performance Measures and Firm’s Ownership and Control