The fatigue impact scale for daily use in patients
with hepatitis B virus and hepatitis C virus chronic infections
Karine Miranda-Pettersen,* Mychelle Morais-de-Jesus,*Renato Daltro-Oliveira,† Adriana Dantas Duarte Dias,‡ Carlos Teles,§ Maria Isabel Schinoni,|| Ângela Miranda-Scippa,*,†,‡ Raymundo Paraná,*,‡ Lucas C. Quarantini*,†,‡
* Programa de Pós-graduação em Medicina e Saúde, Universidade Federal da Bahia, Salvador, Bahia, Brazil.
† Departamento de Neurociências e Saúde Mental, Faculdade de Medicina da Bahia, Universidade Federal da Bahia, Salvador, Bahia, Brazil. ‡ University Hospital-Psychiatry Service, Universidade Federal da Bahia, Salvador, Bahia, Brazil.
§ Departamento de Ciências Exatas, Universidade Estadual de Feira de Santana, Feira de Santana, Bahia, Brazil. || University Hospital-Hepatology Service, Universidade Federal da Bahia, Salvador, Bahia, Brazil.
ABSTRACT
Introduction. Fatigue is an important clinical finding in the hepatitis virus chronic infection. However, the absence of scales to measure fatigue, translated and validated for Brazilian Portuguese, prevents access to information essential in clarifying specific clinical conditions in this population. Aim. The aim of this study was to determine the psychometric properties of the fatigue impact scale for daily use (D-FIS), in Brazilian Portuguese, for patients with the hepatitis C virus (HCV) and hepatitis B virus (HBV) chronic infection. Material and methods. In this cross-sectional study, the authors evaluated the D-FIS in 101 outpatients, followed at the reference hospital. The Mini International Neuropsychiatric Interview Brazilian (MINI PLUS) was used to identify psychiatric disorders, and the Short Form Health Survey 36-item (SF-36) to evaluate the self-reported quality of life. We also examined the impact of fatigue on the quality of life of this group of patients. Results. Relevant psychometric D-FIS results were: floor effect proved to be 1%; skewness was 0.46; item homogeneity was 0.59 and SEM (SD = 8.51) was 2.4. The Cronbach’s alpha was 0.920 and item-total correlation yielded coefficients ranging from 0.65 (item 1) to 0.85 (item 3). In a linear regression model, fatigue and depression influenced the self-reported quality of life. Conclusion. This study presents that the fatigue scale for daily use in Brazilian Portuguese can be considered a useful tool to verify the presence of fatigue in patients with the hepatitis viruses B and C.
Key words. Psychometric properties. Daily fatigue impact scale. Chronic viruses hepatitis.
Correspondence and reprint request: Karine Miranda-Pettersen, BA, MsC.
Hospital Universitário Professor Edgard Santos, Serviço de Psiquiatria, 3°andar, 40110-060 Salvador, BA, Brazil.
Fax: +55 71 30234111
E-mail: [email protected]; [email protected]
Manuscript received: August 11, 2014. Manuscript accepted: October 28, 2014.
INTRODUCTION
Fatigue is an important clinical finding in differ-ent pathologies. It is a feeling of tiredness or ex-haustion combined with impairment in the ability to perform daily activities and to find solutions in the absence of the usual strategies to recover energy, thereby negatively impacting quality of life. Thus, the study of fatigue becomes extremely challenging,
as fatigue presents itself as a symptom of both men-tal disorders and physical illnesses, despite present-ing different characteristics.1 Because fatigue is a
subjective phenomenon, with multifactorial and lit-tle known etiology and phenomenology, and its ex-pression involves physical, cognitive and emotional axes, authors have difficulty in coming to a consen-sus on its definition.2,3
Fatigue is characterized by physical symptoms such as lack of energy, tiredness, weakness, drowsi-ness, and decreased capacity for physical activity; cognitive symptoms such as reduced concentration and attention and slower thinking; and emotional symptoms such as reduced interest and motivation, boredom and the aversion to effort. Because of this variety of presentations, fatigue has been described
as a clinical syndrome, or even a single symptom,4
virus (HBV) chronic infection, followed at the refer-ence hospital.
MATERIAL AND METHODS
All consecutive patients (n = 101) diagnosed with HCV and HBV, over 18 years old, evaluated from June 2010 to May 2011 in the outpatient clinic of the Hepatology Service-University Hospital, at Fed-eral University of Bahia, Brazil were investigated in this cross-sectional design study. The research in-cluded subjects from various stages of the patient ev-olution of the illness, such as: subjects during interferon plus ribavirin treatment, naïve patients and patients after treatment failed. Four trained researchers applied a protocol, consisting of a ques-tionnaire with socio-demographic and clinical data, the Mini International Neuropsychiatric Interview
Brazilian Version 5.0.0 (MINI PLUS),15 used
for identification of psychiatric disorders, the
D-FIS,5 and the Short Form Health Survey 36-item
(SF-36).16
D-FIS was developed by means of Rasch analysis, which selects appropriate scale items for evaluation and was validated by a sample of 93 subjects with flu-like illnesses. It is a self-reported questionnaire that consists of 8 items, each describing one possible experience of fatigue. Patients are asked to rate the extent to which fatigue has been a problem for them in regard to each of these items, on a scale ranging from 0 (no problem) to 4 (extreme problem).5
The D-FIS was translated into Portuguese by two independent people fluent in English and aware of the purpose of this study. After that, a back transla-tion to English was performed by a native English speaker. Because there was not a gold standard for fatigue assessment in Brazilian Portuguese, we used the SF-36, a reliable and valid quality of life out-come measure in Brazil.16 It is a multidimensional
questionnaire consisting of 36 items, grouped within 8 domains. For this study, we used the domains ‘physical functioning’ consisting of ten items, ‘Role limitations due to physical health’ consisting of four items, ‘role limitations due to emotional problems’ consisting of three items and ‘vitality and ener-gy’ consisting of four items. This instrument was chosen because the categorization of fatigue is consistent with the general constructs measured by these four domains of the SF-36 scale.
This research was considered a Class I Hazard, or low risk for the individual and collective, and fol-lowed the Guidelines and Standards Resolution 196/ 96 as well as the Helsinki Declaration of 1989 on Re-or a side effect of the treatment with influenza
medi-cations, interferon or other chronic disease medica-tions such as cancer, human immunodeficiency virus (HIV) and multiple sclerosis.5
Fatigue has been identified as very frequent in pa-tients with chronic hepatitis C. In a study by Has-soun, et al.,6 which posits that 3% of the population
worldwide are carriers of hepatitis C, fatigue was re-ported by 67% of patients, and cited by 49% as one of the worst symptoms, if not the worst. Moreover, in hepatitis C, fatigue is associated with depression and significantly limits work performance7 and
qual-ity of life, especially in the areas of physical dimen-sions and social relations.8
The self-reported experience of fatigue has not been associated with the severity of liver disease caused or not by hepatitis C virus (HCV), the level
of viremia or disease duration.2,9 Meanwhile,
re-search indicates that patients with HCV frequently associate other factors as having a significant role in the experience of fatigue, such as social function-ing, psychological disorders, socioeconomic status, cognitive impairment and non-liver-related physio-logical factors.10
The fatigue impact scale (FIS)11 is a
multidimen-sional scale and has proven to be a robust tool in in-vestigating the impact of fatigue on the quality of life of various groups of patients. It has been one of the most widely used tools, translated and vali-dated in 30 languages, and there now exists modified versions, such as the modified FIS (MFIS), the daily FIS (D-FIS), the unidimensional FIS and the abbre-viated MFIS.12
The D-FIS was developed to assess daily changes in fatigue3,5 in individuals with various physical
ail-ments, and has already been validated for patients with Parkinson’s disease13 and multiple sclerosis,14
in English and Spanish. It presents high internal consistency and constructs validity and sensitivity to change. However, the absence of scales to meas-ure fatigue, translated and validated for Brazilian Portuguese, prevents access to information essential in clarifying specific clinical conditions for this tar-get population. Therefore, studies directed toward the adequacy of instruments that can contribute to further development in this area are of great impor-tance.
AIM
search Involving Human Subjects. The study was approved by the local Institutional Review Board (CEP-MCO-UFBA, Number: 14/2002). The subjects participated in the study only after being made aware of the objectives and procedures of the study and after voluntarily agreeing to participate in the study, signing an Informed Consent form.
Statistics
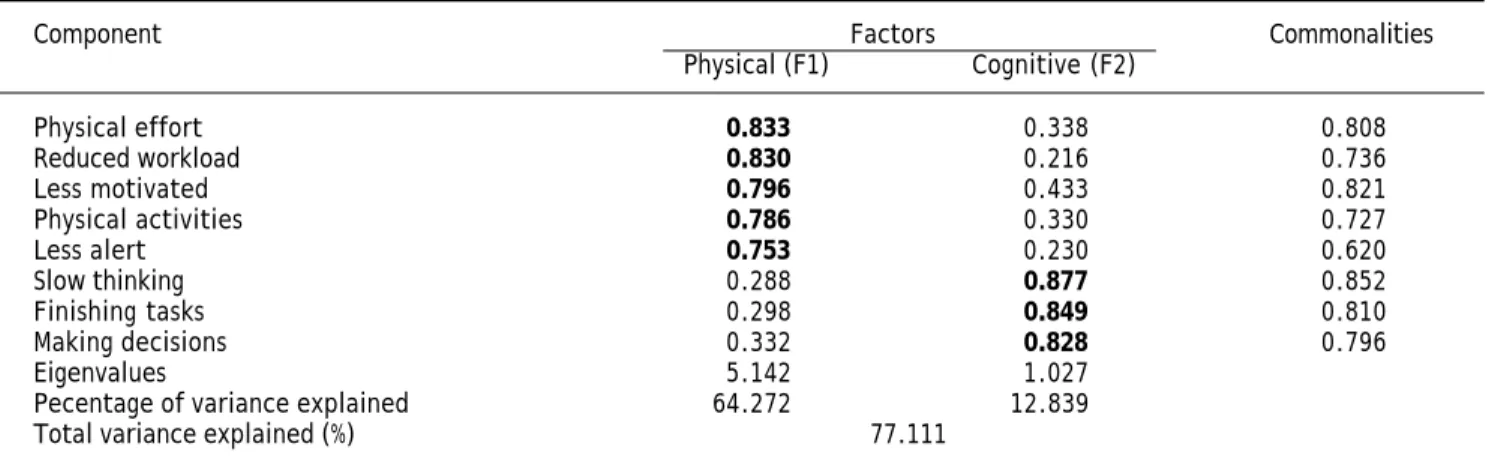
All data were analyzed using the Data Analysis and Statistical Software STATA Version 11. To in-vestigate the underlying structure of the scale, the responses of the total sample (n = 101) were sub-jected to a principal-component analysis with var-imax rotation. From the factor analysis of items in the scale of fatigue, two components were defined as mainly responsible for the overall change of scale: factor 1 (F1) represented by physical fatigue, and factor 2 (F2) cognitive fatigue. From the extraction of these factors, we carried out the calcu-lation of Pearson’s correcalcu-lations. All correcalcu-lations were statistically significant at p < 0.05. We calcu-lated the coefficient of Kaiser-Meyer-Olkin (KMO) and Bartlett’s sphericity test, and the measure of commonality. The internal consistency of the FIS-D was evaluated with Cronbach’s alpha. Because of multiple comparisons, results were con-sidered statistically significant when P < 0.01.
RESULTS
The descriptive analysis of the socio-demographic data of the patients is presented in table 1. About 20.7% of the patients presented HBV infection; 73.2% of patients presented HCV infection and just 2.9% presented HBV and HCV infection. Regarding the severity of liver disease and the degree of fibro-sis, all patients are A1F1. Marital status, type of vi-ral infection, ethnic group, occupation and eligibility for transplant were unrelated to fatigue. Women and depressed patients showed increased fa-tigue levels (P < 0.05).
The comparability between HCV and HBV sub-jects was tested before all validation analyses. Both groups were similar in socio-demographic and clini-cal variables and the analysis as only one group, HCV plus HBV was feasible.
Metric properties of the D-FIS
To examine the underlying structure of the scale, a principal-component analysis was performed with
all data (n = 101). Two components with eigenval-ues equal to or greater than 1.0 were extracted, which explained 77.1% of the total variance of the scale. The existing names of the subscales were used to label these components: physical and cognitive factors. The psychosocial factor presented eigenval-ues less than 1.0. The results of the varimax rota-tion final factor are represented in table 2. The required item-factor loading higher than 0.700 was found in all items and was considered significant. The second item, assessing the impact of fatigue on the ‘need to reduce the workload or responsibili-ties’, was assigned to the physical factor, although it is part of the psychosocial subscale. We used the coefficient of Kaiser-Meyer-Olkin = 0.82 and Bar-tlett’s sphericity test with P < 0.0001, with the re-sults indicating that the correlations between items of fatigue met the assumptions of factor analysis. The measure of commonality presents values above 0.60 which indicates that the variables of the scale of fatigue are well explained by factors generated.
The D-FIS mean (9.81; SD=8.5) was close to the median (9). Insofar as distribution data was con-cerned, floor and ceiling effects proved to be 1% and 19.8% (limits: 1-15%), respectively. Skewness for the total D-FIS score was 0.46. Item distribution of
Table 1. Demographic and clinical characteristics of
patients.
N (prevalence %) P
Gender
Female 44 (43.5) < 0.02*
Male 57 (56.4)
Marital status
Single 27 (26.7) < 0.16
Married 57 (56.4)
Divorced 10 (9.9)
Widowed 5 (4.9)
Ethnic group
White 23 (22.7) < 0.65
Not white 73 (75.2)
Transplant
Eligible 14 (13.8) < 0.65
Not eligible 87 (86.1)
Depressive episode
Absent 85 (84.2) < 0.0001*
Present 16 (15.8)
* Correlation significant at 0.05 (2-tailed). † HBV: hepatitis B virus. ‡ HCV:
response options was considerably homogeneous, with mean scores ranging from 0.81 (item 5) to 1.65 (item 4), variances from 1.4 (item 5) to 2.1 (item 4), and a standard error of means from 0.11 to 0.14. Item total correlation yielded coefficients ranging from 0.65 (item 1) to 0.85 (item 3) (Table 3).
The internal consistency analysis is shown in Ta-ble 3. The overall Cronbach’s alpha was 0.920, with 0.911 for physical and 0.891 for cognitive factors of the scale. A Cronbach’s alpha coefficient value 0.70 was considered the lowest acceptable limit.17 A
Cron-bach’s alpha of each item deleted also presents re-sults lower than the overall Cronbach’s alpha. These results indicate high internal validity and homogenei-ty of D-FIS, because these items are not redundant, and therefore, necessary for the homogeneity of the scale. Inter-item correlation coefficients attained val-ues from 0.38 (items 1-7) to 0.8 (items 4-8), and item homogeneity was 0.59. The sensitivity SEM (SD = 8.51)
was 2.4. Sensitivity is the type of internal responsive-ness to change and is defined as the capacity of a measure to change in a determined lapse of time and may be computed as standard error of measurement. In the case of the application of an effective treat-ment, the sensitivity to change depends on two elements: the measure used to assess the treatment and the treatment itself.18,19
Pearson’s correlations of levels of fatigue versus the four components of quality of life (Table 4) present a weak negative correlation between cogni-tive fatigue (F2) and areas of limitation due to phys-ical functioning and vitality. Physphys-ical fatigue (F1) had moderate negative correlations with the four domains of quality of life assessed, as well as cogni-tive fatigue, which also had a moderately negacogni-tive correlation with the areas of functional capacity and limitation by emotional aspects. All correlations were statistically significant at p < 0.05.
Table 3. Internal consistency analysis of fatigue impact scale for daily use (FIS-D): Cronbach’s alpha if item deleted.
Item Component Total score Factors ITC
Physical (F1) Cognitive (F2)
1 Less alert 0.916 0.917 0.65
2 Reduced workload 0.912 0.913 0.71
3 Less motivated 0.900 0.872 0.85
4 Physical effort 0.904 0.874 0.81
5 Making decisions 0.912 0.854 0.71
6 Finishing tasks 0.913 0.854 0.69
7 Slow thinking 0.912 0.825 0.70
8 Physical activities 0.908 0.880 0.75
Total by factor 0.911 0.891
Overall total 0.920
F1: factor 1. F2: factor 2. ITC: item-total correlation.
Table 2. Principal component factor analysis with varimax rotation.
Component Factors Commonalities
Physical (F1) Cognitive (F2)
Physical effort 0.833 0.338 0.808
Reduced workload 0.830 0.216 0.736
Less motivated 0.796 0.433 0.821
Physical activities 0.786 0.330 0.727
Less alert 0.753 0.230 0.620
Slow thinking 0.288 0.877 0.852
Finishing tasks 0.298 0.849 0.810
Making decisions 0.332 0.828 0.796
Eigenvalues 5.142 1.027
Pecentage of variance explained 64.272 12.839
Total variance explained (%) 77.111
Impact of fatigue on quality of life
As shown in table 4, Pearson’s correlations of levels of fatigue vs. the components of quality of life present a moderately negative correlation (r = -0.38 to -0.64, P < 0.001). These results confirm that, in our study, fatigue is inversely proportional to the subjects’ quality of life perception.
Results of the linear regression analysis, which took SF-36 domains as a dependent variable, are shown in table 5. The analyses suggest that fatigue is an important independent variable, which can be a determinant of the deterioration of quality of life. However, depression was identified as an independent significant predictor or impairment of the absolute fatigue score (P < 0.01). The smallest
percentage variation (Δ%) between the crude and
adjusted difference, in this analysis, was 7.13% in the physical role domain, while the greatest (52.93%) appears in the mental health domain.
DISCUSSION
Despite the relevance of fatigue in the context of different chronic diseases, to our knowledge, no ob-jective scale for its measurement is validated in Por-tuguese. This is the first cross-sectional study evaluating the use of D-FIS with HBV and HCV in-fection patients in Brazilian Portuguese. We there-fore consider it important because although data is scarce, estimates indicate that in Brazil, the preva-lence of HCV infection is intermediate, ranging from
1 to 2%20 and fatigue is one of the most common
complaints of patients, occurring independently of liver disease and impairing their ability to function at work or in society.21
In the current study, the metric properties pre-sented are the following: the mean score was near the median; skewness and ceiling effects were locat-ed within the agrelocat-ed limit. The floor effects (i.e., all eight items are presented with ‘no problems’ by
Table 4. Pearson’s correlations of levels of fatigue vs. components of quality of life.
Overall fatigue Physical fatigue (F1) Cognitive fatigue (F2)
Pearson’s Sig. Pearson’s Sig. Pearson’s Sig.
correlation (2-tailed) correlation (2-tailed) correlation (2-tailed)
Physical health
Physical functioning - 0.56** 0.0000 -0.46** 0.0000 -0.33** 0.0001
Physical role - 0.45** 0.0000 -0.42** 0.0000 -0.19 0.052
Bodily pain - 0.43** 0.0000
General health - 0.38** 0.0001 Mental health
Vitality - 0.60** 0.0000 -0.53** 0.0000 -0.29** 0.004
Emotional role - 0.38** 0.0001 -0.20* 0.041 -0.36** 0.0000
Social functioning - 0.65** 0.0000
Mental health - 0.42** 0.00001
*Correlation significant at 0.05 (2-tailed). **Correlation significant at 0.01 (2-tailed). F1: factor 1. F2: factor 2.
Table 5. Linear regression-fatigue as an explanatory variable for quality of life, adjusted for diagnosis of major depression.
SF-36 domains Crude difference Adjusted difference Δ%
Coef. p Adj Coef. p Adj
(Std. Err) R-squared (Std. Err) R-squared
Physical health
Physical Functioning -1.56 (0.23) 0.000 0.31 -1.38 (0.24) 0.000 0.33 11.39
Physical Role -2.31 (0.46) 0.000 0.19 -2.14 (0.49) 0.000 0.19 7.13
Bodily Pain -1.77 (0.24) 0.000 0.35 -1.31 (0.23) 0.000 0.49 26.37
General Health -1.79 (0.43) 0.000 0.14 -1.26 (0.45) 0.006 0.21 29.69
Mental health
Vitality -1.46 (0.31) 0.000 0.18 -1.07 (0.32) 0.001 0.25 26.94
Emotional Role -0.96 (0.23) 0.000 0.14 -0.71 (0.24) 0.005 0.19 26.37
Social Functioning -2.19 (0.26) 0.000 0.41 -1.71 (0.25) 0.000 0.52 21.61
subjects) were higher than the limit (15%), which means that 19.8% of the subjects’ responses did not demonstrate goodness of fit statistics. This result may be related to the fact that most subjects in this subgroup were men (70%), who presented lower fa-tigue levels. Nevertheless, feasibility and accepta-bility were considered satisfactory, as were the scaling assumptions: item response options regis-tered a homogeneous distribution, and item-total correlation coefficients were clearly higher than the criterion value, and close to those of previous
studies.5,13,14 The D-FIS Cronbach’s alpha (0.92)
proved satisfactory even for individual compari-sons17,22 and, once again, similar to the value
obtained in the original study (α = 0.91).
Fur-thermore the item homogeneity value (0.59) was indicative of a moderate-to-high intercorrelation between scale components. With these results, it is possible to conclude that D-FIS internal consist-ency can be deemed satisfactory, just as the re-sulting sensitivity (SEM = 2.14) that may be used as an indicator of precision and potential respon-siveness.17
In the absence of a fatigue measurement tool ac-cepted for universal use in Brazilian Portuguese, this study administrated the SF-36, a multidimen-sional questionnaire for generic assessment of health, for which measurement properties such as reproducibility, validity and sensitivity to change have already been demonstrated in other studies. The results demonstrate that fatigue is associated with perceived quality of life of the components eval-uated by the SF-36 scale, which was determined as the standard tool for this study.
The physical factor, extracted from D-FIS by varimax rotation, which presents the most vari-ance (64%) explained, indicates that the D-FIS is more effective at identifying possible worsening of fatigue related to particular physical symptoms, in our sample. This fact is corroborated by the moder-ate association of this factor with domains relmoder-ated in SF-36, such as ‘physical functioning’, ‘physical role’ and ‘vitality’ and a weak correlation with ‘emotional role’. Although the cognitive factor, which presents 13% of variance explained, has a moderate association with ‘physical functioning’ in SF-36, it has no association with ‘physical role’ even if it has a tendency to correlate. The cognitive factor, in D-FIS, also presents association with the mental health domains of SF-36. These results indicate that D-FIS is a feasible instru-ment for measuring related fatigue in patients with viral hepatitis.
The linear regression analysis identified the ef-fect of depression, associated with fatigue, as a predictor of impairment of the self-reported quali-ty of life. Depression presents a modifying effect of fatigue in all eight domains of SF-36, except those related to ‘physical functioning’ and ‘physical role’, for which it presents a confounding effect. These results suggest that the presence of depres-sive symptoms is associated with the increasing severity of fatigue, and its impact on mental and social aspects of the self-reported quality of life. However, we must consider that the D-FIS is a better instrument for identifying physical charac-teristics which have a lower correlation for de-pression.
In the current study, overall fatigue was associat-ed with self-reportassociat-ed quality of life in all domains, especially social functioning, vitality and physical functioning. Similar results were found by Marcel-lin, et al.8 who studied depression and fatigue in 115
HIV-HCV co-infected patients.
This study has a number of limitations. The size and characteristics of this consecutive clinical sam-ple restrict generalization of results. Furthermore, the widespread location of subjects prevented the use of a methodology that allows for calculations of other psychometric properties such as responsive-ness and reproducibility. Another limitation is that the cross-sectional survey does not investigate the chronological relationship between fatigue and de-pression, and their interaction upon the self-report-ed quality of life.
It is important to emphasize that the absence of directed studies of the impact of fatigue in viral hep-atitis patients’ lives in Brazil could be related to the fact that there are no appropriate, widely used in-struments for these patients. An appropriate instru-ment would allow effective targeting of therapeutic strategies aimed at physical and social relation di-mensions of quality of life, which are the most af-fected by fatigue in our sample. Moreover, such an instrument would allow for fatigue management even before starting HCV treatment with interferon, which brings a host of side effects, including fatigue and depression.
ABBREVIATIONS
• D-FIS: fatigue impact scale for daily use. • HCV: hepatitis C virus.
• HBV: hepatitis B virus.
ACKNOWLEDGEMENTS
We are grateful to Dr. André Lyra for his techni-cal assistance and to Angela Burkholder de Oliveira for proofreading. The authors declare that they have no conflict of interest.
This project was partially supported by the Na-tional Council of Technological and Scientific Devel-opment (CNPq): [474869/2010-5] - Edital Universal MCT/CNPq 14/2010.
REFERENCES
1. Pavan K, Schmidt K, Marangoni B, Mendes MF, Tilbery CP, Lianza S. Esclerose Multipla: Adaptação transcultural e va-lidação da escala modificada de impacto da fadiga. Arq Neuropsiquiatr 2007; 65: 669-73.
2. Huet PM, Deslauriers J, Tran A, Faucher C, Charbonneau J. Impact of fatigue on the quality of life of patients with primary biliary cirrhosis. Am J Gastroenterol 2000; 95: 760-7.
3. Dittner AJ, Wessely SC, Brown RG. The assessment of fati-gue: a practical guide for clinicians and researchers. J Psychosom Res 2004; 56: 157-70.
4. Arnold LM. Understanding fatigue in major depressive di-sorder and other medical didi-sorders. Psychosomatics 2008; 49: 185-90.
5. Fisk JD, Doble SE. Construction and validation of a fatigue impact scale for daily administration (D-FIS). Qual Life Res 2002; 11: 263-72.
6. Hassoun Z, Willems B, Deslauriers J, Nguyen BN, Huet PM. Assessment of fatigue in patients with chronic hepatitis C using the Fatigue Impact Scale. Dig Dis Sci 2002; 47: 2674-81.
7. Hilsabeck RC, Hassanein TI, Perry W. Biopsychosocial pre-dictors of fatigue in chronic hepatitis C. J Psychosom Res 2005; 58: 173-8.
8. Marcellin F, Preau M, Ravaux I, Dellamonica P, Spire B, Ca-rrieri MP. Self-reported fatigue and depressive symptoms as main indicators of the quality of life (QOL) of patients living with HIV and Hepatitis C: implications for clinical
management and future research. HIV Clin Trials 2007; 8: 320-7.
9. Prince MI, James OFW, Holland NP, Jones DEJ. Validation of a fatigue impact score in primary biliary cirrhosis: towards a standard for clinical and trial use. J Hepatol 2000; 32: 368-73.
10. Seaman K, Paterson BL, Vallis M, Hirsch G, Peltekian KM. Future directions for investigation of fatigue in chronic hepatitis C viral infection. Chronic Illness 2009; 5: 115-28.
11. Fisk JD, Ritvo PG, Ross L, Haase DA, Marrie TJ, Schlech WF. Measuring the functional impact of fatigue: initial va-lidation of the fatigue impact scale. Clinical Infectious Di-seases 1994; 18: S79.
12. Frith J, Newton J. Fatigue impact scale. Occupational Me-dicine 2010; 60: 159.
13. Martinez-Martin P, Catalan MJ, Benito-Leon J, Moreno AO, Zamarbide I, Cubo E, van Blercon N, et al. Impact of fati-gue in Parkinson’s disease: the Fatifati-gue Impact Scale for Daily Use (D-FIS). Qual Life Res 2006; 15: 597-606. 14. Benito-Leon J, Martinez-Martin P, Frades B,
Martinez-Gi-nes ML, de Andres C, Meca-Lallana JE, Antiguedad AR, et al. Impact of fatigue in multiple sclerosis: the Fatigue Im-pact Scale for Daily Use (D-FIS). Mult Scler 2007; 13: 645-51.
15. Amorim P. Mini International Neuropsychiatric Interview (MINI): validação de entrevista breve para diagnóstico de transtornos mentais. Rev Bras Psiquiatr 2000; 22: 106-15. 16. Ciconelli RM, Ferraz MB, Santos W, Meinão I, Quaresma
MR. Brazilian-Portuguese version of the SF-36. A reliable and valid quality of life outcome measure. Rev Bras Reuma-tol 1999; 39: 143-50.
17. Lohr KN. Assessing health status and quality-of-life instru-ments: attributes and review criteria. Quality of Life Re-search 2002; 11: 193-205.
18. Husted JA, Cook RJ, Farewell VT, Gladman DD. Methods for assessing responsiveness: a critical review and recom-mendations. J Clin Epidemiol 2000; 53: 459-68.
19. Garcia de Yebenes Prous MJ, Salvanes FR, Ortells LC. Res-ponsiveness of outcome measures. Reumatologia Clinica [English edition] 2008; 4: 240-7.
20. Martins T, Narciso-Schiavon JLUZ, Schiavon LDEL. Epide-miologia da infeccao pelo virus da hepatite C. CEP:88704:900.
21. Karaivazoglou K, Iconomou G, Triantos C, Hyphantis T, Thomopoulos K, Lagadinou M, Gogos C, et al. Fatigue and depressive symptoms associated with chronic viral hepa-titis patients. health-related quality of life (HRQOL). Ann Hepatol 2010; 9: 419-27.