Potential molecular
targets of statins in the prevention of
hepatocarcinogenesis
Ezequiel Ridruejo,*,† Giselle Romero-Caími,**,†† María J. Obregón,***,† Diana Kleiman de Pisarev,**,†† Laura Alvarez**,†
* Hepatology Section, Department of Medicine. Centro de Educación Médica e Investigaciones Clínicas “Norberto Quirno” (CEMIC). Ciudad Autónoma de Buenos Aires, Argentina. ** Laboratory of Biological Effects of Environmental Pollutants, Department of Human Biochemistry, School of Medicine. Universidad de Buenos Aires. Ciudad Autónoma de Buenos Aires, Argentina. *** Department of Molecular Pathophysiology, Instituto de Investigaciones Biomédicas (Centro mixto CSIC-UAM). Madrid, Spain.
† These authors contributed equally to the work. †† These authors share senior authorship.
May-June, Vol. 17 No. 3, 2018: 490-500
INTRODUCTION
Hepatocellular carcinoma (HCC), the most common type of liver cancer, is the fifth most common malignant tumor type worldwide and the second leading cause of
cancer-related deaths.1 Dysregulated cell proliferation is
the main mechanism of hepatocarcinogenesis, leading to tumor growth and invasion. However, the mechanism of this proliferation is complex and poorly understood. Over the last few years, many molecular targets have been
pro-posed as potential sites for advanced HCC treatment.2,3
Limited clinical and epidemiologic data suggest that stat-ins may improve HCC outcomes, a tumor associated with poor prognosis.4
Statins are the most widely used therapeutic agents to treat hypercholesterolemia. Statins inhibit 3-hydroxy-3-methylglutaryl coenzyme. A reductase (HMGCoAR) is a
key enzyme of the mevalonate pathway.5 Seven
HMG-CoAR inhibitors are available on the market: atorvastatin, rosuvastatin, simvastatin, fluvastatin, lovastatin, pitavasta-tin, and pravastatin. Inhibition of proliferation, migration and invasion, and induction of apoptosis are the proposed
mechanisms of their antitumoral effect.6,7 However,
re-sults of these studies are controversial and current evi-dence does not support their specific role in cancer
chemoprevention and cancer related outcomes.7 In recent
years, several studies have demonstrated that statins have beneficial effect in patients with different liver diseases
in-The Official Journal of the Mexican Association of Hepatology, the Latin-American Association for Study of the Liver and
the Canadian Association for the Study of the Liver
Manuscript received: Manuscript received: Manuscript received: Manuscript received:
Manuscript received: June 7, 2017. Manuscript accepted:Manuscript accepted:Manuscript accepted: August 19, 2017.Manuscript accepted:Manuscript accepted:
DOI:10.5604/01.3001.0011.7394 A B S T R A C T A B S T R A C T A B S T R A C T A B S T R A C T A B S T R A C T
Introduction and aim. Introduction and aim. Introduction and aim. Introduction and aim.
Introduction and aim. Hepatocellular carcinoma (HCC) represents 90% of liver tumors. Statins, may reduce the incidence of various tumors, including HCC. Antitumoral activities may be mediated by changes in transforming growth factor-beta (TGF-β1) and thyroid hormones (TH) regulation. Aim. The aim of our study is to establish the statins mechanism of action and the potential key molecules involved in an in vivo and in vitro HCC model. Materials and methods. Materials and methods. Materials and methods. Materials and methods. We used two models: in vivo (in rats) using di-Materials and methods. ethylnitrosamine (DEN) and hexachlorobenzene (HCB) to develop HCC. We analyzed cell proliferation parameters (proliferating cell nuclear antigen, PCNA) and cholesterol metabolism (hydroxy-methylglutaryl-CoA reductase, HMGCoAR). In vitro (Hep-G2 cells) we evaluated the effects of different doses of Atorvastatin (AT) and Simvastatin (SM) on HCB induced proliferation and analyzed prolif-erative parameters, cholesterol metabolism, TGF-β1 mRNA, c-Src and TH levels. Results. Results. Results. Results. Results. In vivo, we observed that cell prolifer-ation significantly increased as well as cholesterol serum levels in rats treated with HCB. In vitro, we observed the same results on PCNA as in vivo. The statins prevented the increase in HMG-CoAR mRNA levels induced by HCB, reaching levels similar to con-trols at maximum doses: AT (30 μM), and SM (20 μM). Increases in PCNA, TGF-β1, and pc-Src, and decreases in deiodinase I mRNA levels induced by HCB were not observed when cells were pre-treated with AT and SM at maximum doses. Conclusion.Conclusion.Conclusion.Conclusion.Conclusion. Statins can prevent the proliferative HCB effects on Hep-G2 cells. TGF-β1, c-Src and TH may be the statins molecular targets in hepatocarcinogenesis.
Key words. Key words.Key words. Key words.
cluding chronic hepatitis C virus (HCV) infection, chron-ic hepatitis B virus (HBV) infection, and also decrease the
risk of hepatocellular carcinoma (HCC) development.8-16
Several studies have shown that statins use in chronic liver disease and cirrhosis is safe, and even it was associated with lower mortality and lower rate of hepatic decompen-sation.17 Statin use is also associated with a reduced risk of
fibrosis progression in patients with chronic hepatitis C
and a reduced risk of cirrhosis development.18-19 So, there
appears to be multiple benefits from statins use in patients with chronic liver diseases. So far, it has been proven that there are several mechanisms activated by statins in cancer cells, depending on the cell line, statins concentration, duration of exposure, and the type of statin being used. It has been shown that statins may inhibit cell-cycle progres-sion and may induce apoptosis by both intrinsic and ex-trinsic pathways.20,21
TGF-β1 is involved in the regulation of cell behavior
in a variety of cellular contexts. Expression of TGF- β1
may be a critical step in the growth control of normal and proliferating rat hepatocytes. It has been reported that
TGF-β1 has many roles in HCC development, including
tumor growth, invasiveness, neo-angiogenesis and meta-static behavior, leading to cell survival promotion, prolif-eration, invasion and neoangiogenesis in many human cancers.
Proto-oncogene tyrosine-protein kinase Src pathway activation, also known as cellular Src kinase or simply c-Src, has been observed in about 50% of tumors from vari-ous organs including the liver.22 Sato, et al.23 demonstrated
that TGF-β1 can induce c-Src phosphorylation.
Hexachlorobenzene (HCB), a persistent environmen-tal pollutant, has been shown to induce cell growth imbal-ance in rat liver. HCB increases the development of rat
liver preneoplastic lesions in a medium-term initiation/
promotion model.24
The aim of our study was to investigate the effect of statins on cell proliferation in an initiation/promotion model in rat liver and in Hep-G2 cells. We also assessed
the expression of TGF-β1, and its involvement in the
po-tential key molecules involved in statins actions.
MATERIAL AND METHODS
Animals and Treatment
Female Wistar rats (50 g at the onset of the experiment) were purchased from the Facultad de Farmacia y Bioquími-ca, Universidad de Buenos Aires. The rats were fed with Pu-rine 3 rat chow (Cabeca S.C.A, Argentina) and water ad libitum. Environmental conditions consisted of a 12 hrs light-dark cycle, 19 ± 2 °C, and 45-75% humidity. After 7-day acclimation period, a total of 20 rats were divided into 4 equal groups. Rats in groups 1 and 2, received a single i.p. injection of saline vehicle. Animals in groups 3 and 4 were treated with a single i.p. injection of DEN (100 mg/kg body weight). One week later, the animals in group 2 and 4 received HCB (100 mg/kg body weight) administered 5 days a week, by gavage. HCB (40 mg/mL) was suspended in water containing Tween 20 (0.5 mL/100 mL) (Figure 1). The doses of DEN and HCB were selected based on similar previous studies. At week 3 (day 21), a partial hepatectomy, which comprised approxi-mately 70% of the total liver weight, was performed on all an-imals. Given the diurnal variation observed in liver DNA synthesis after partial hepatectomy in rodents, all rats under-went partial hepatectomy or sham hepatectomy between 11:00 and 15:00 h.19 At the end of the eighth week, the animals
were killed by exsanguinations.
Figure 1. Figure 1. Figure 1.
Figure 1. Figure 1. Experimental design for the initia-tion/promotion study. The initiation agent, DEN, was administered i.p. (100 mg/kg) on Day 0. Sa-line solution or HCB was delivered by gavage starting on day 45 at a dose of 100 mg/kg b.w. per day, five days/week. A two-thirds partial hepatectomy was performed on all animals on day 52. Liver tissues were collected 100 days fol-lowing initial DEN dosing.
Group 1
Group 2
Group 3
Group 4 Saline
Saline
DEN
GEN
Days
DEN 100 mg/kg Partial Hepatoctomy HCB 200 mg/kg b.w.
Chemicals and antibodies
Hexachlorobenzene (HCB, > 99% purity commercial grade), anti- -actin, and anti-proliferating cell nuclear an-tigen (PCNA) were purchased from Sigma (Sigma-Aldrich Co). TRI-Reagent used for mRNA extraction was purchased from MRC, Molecular Research Center, Inc. The reagents used for cDNA synthesis, were pur-chased from SRL Biodynamics. Polyvinyl difluoride membranes (PVDF), for immuno-blotting were pur-chased from Bio-Rad (Bio-Rad Laboratories). CP-BU plates were purchased from New Afghanistan
(Afghani-stan, Gevaerl ArgentinaSA). Monoclonal anti-TGF-β1
was obtained from Abcam Inc. Specific primers for
transforming growth factor β1 (TGF-β1) and (L-19)
were purchased from Invitrogen Life Technology. The compound for (RT) and PCR were purchased from Promega Corporation. All other reagents used were of analytical grade.
Cell culture and treatment
Hep-G2 cell line was supplied by the American Type Culture Collection (ATCC). The cells were cultured in Modified Eagle’s Medium (MEM) (Sigma)
supple-mented with 10% Fetal Bovine Serum (FBS) and 50 μg/
mL gentamicin and penicillin. Cells were maintained under standard conditions at 37 °C in 5% CO2 and 100% relative humidity. Cells in exponential growth with 80% confluence were washed with phosphate solution (PBS) and then treated with a solution of 0.025% trypsin-0.03% EDTA for 1-5 minutes at 37 °C. Cells were seeded in 12-well plates and pre-incubated for 24 h to allow cell adherence. For dose-response studies, cells were treated for 24 h with HCB (0.05, 0.5 and 5
μM). Control cells were treated with the same volumes
of ETOH. We used a conditioned medium (CM)
ob-tained from Hep-G2 cells treated with HCB 5 μM for
24 h to obtain medium enriched in growth factors re-leased by the cells.
Western Blottting
Total cellular protein lysates were electrophoresed in 10% SDS-polyacrylamide gel (SDS-PAGE) prior to trans-fer to polivinilidene difluoride membranes (PVDF), in a semidry transfer cell at 18 V for 1.5 h. Membranes were blocked overnight at 4 °C with 5% nonfat dry milk- 2.5% BSA in TBST buffer (10 mM Tris-HCl, pH 8.0, 0.5% Tween 20, 150 mM NaCl). Membranes were incubated with rabbit polyclonal specific antibodies (PCNA, c-Src
and TGF-β1) (1:500), and anti- -actin at (1:500) dilution,
and incubated overnight at 4 °C. After incubation,
mem-branes were washed five times with TBST, and the suita-ble peroxidase- conjugated antispecies specific antibodies were used for protein detection. After washing, blots were reacted using an enzyme-linked enhanced chemolumines-cence (ECL) detection kit (Amer- sham Biosciences, Inc., UK) and quantified by scanning laser densitometry in a Fotodyne (Foto/Analyst), Gel-Pro Analyzer 3.1.
RT-PCR analysis
Total RNA was extracted from with a phenol-isotiocia-nate of guanidine (TRIZOL) solution, by a modification
of Chomczynski’s method.25
An aliquot of 2 μg of total RNA was used to synthesize
first-strand cDNA with the random primers, deoxynucle-otide triphosphates, transcriptase reverse (RT), and
tran-scriptase reverse buffer. Reaction mixture for TGF-β1, and
L-19 amplification contained GoTaq reaction buffer (1.5 mM MgCl2, 0.2 mM dNTP's mix, 1.25 U GoTaq DNA
polymerase, 0.5 μM of each forward and reverse primers,
and 1 μL of RT products). PCR was performed as follows:
reaction mixture for TGF-β1 amplification was incubated
at 94 °C for 5 min and then amplified at 94 °C for 1 min, 60 °C for 1 min, and 72 °C for 1 min. Reactions were repeated for 27 cycles. Reaction mixture for L-19 amplification was incubated at 94 °C for 5 min and then amplified at 94 °C for 1 min, 55 °C for 1 min, and 72 °C for 1 min. Reactions were repeated for 27 cycles. The sequences of forward and reverse primers were as follows:
TGF-β1: 5’-CTGCTGGCAATAGCTTCCTA-3,
5-CGAGCCTTAGTTGGACAGGAT-3’. L-19: 5’-TGAACGGGAAGCTCACTGG-3,
5-TCCACCACCCTGTTGCTGTA-3’.
L-19 cDNA was used as a loading control. PCR products were detected as a single band on 2% agarose gel, containing 0.05% (v/v) ethidium bromide. Bands were detected, and in-tensity was quantified by scanning laser densitometry in a Fo-todyne (Foto/Analyst), Gel-Pro Analyzer 3.1.
Statistical analysis
RESULTS
Effect of HCB on HMGCoAR mRNA levels and
serum cholesterol levels in an initiation-promotion model of HCC
We have previously demonstrated that HCB contrib-utes to the development of preneoplastic foci by
enhanc-ing the proliferation of initiated cells in rat liver.26 We
focused on the effect of HCB on HMGCoAR mRNA lev-els in rat liver, in an initiation-promotion model. As shown in figure 2, HMGCoAR mRNA levels were
signif-icantly increased in liver from DEN + HCB group com-pared to DEN group (31%) (Figure 2A and 2B). The above mentioned increase in HMGCoAR activity, correlates with high cholesterol serum levels. Our results showed that serum cholesterol levels were significantly increased (28%) in DEN + HCB group compared with DEN group (Figure 2C).
Effect of statins treatment on Hep-G2 cells viability
In order to investigate the effect of statins on cell via-bility, Hep-G2 cells were treated with different doses of
AT (10, 20 and 30 μM) and SM (5, 10 and 20 μM) for three
hours. MTT assay shows that statins did not alter Hep-G2 cells viability (Figure 3).
Figure 2. Figure 2.Figure 2.
Figure 2.Figure 2. Analysis of HMGCoAR mRNA expression in rat liver and serum cholesterol levels in an initiation-promotion model. A. A. A. A. A. Representative pat-tern of RT-PCR amplification of HMGCoAR cDNA from liver of DEN and DEN+HCB treated rats, synthesized from total RNA. B. B. B. B. B. L-19 was used as a loading control. Quantification of HMGCoAR/L-19 cDNA ratio is shown in the lower panel. C.C.C.C.C. Serum cholesterol levels. Values are means ± SEM of three independent experiments of four rats per group. Significantly different (* p < 0.05) compared to DEN group.
A AA AA
Control HCB DEN DEN + HCB
Serum 0.16 ± 0.02 0.19 ± 0.02 0.15 ± 0.01 0.24 ± 0.01*
Cholesterol C
CC C C
2.0
1.5
1.0
0.5
0.0 B B B B B
HMGCoA R/L19 AU (Arbritary units)
C HCB DEN DEN + HCB
HMGCoA R
L-19
C HCB DEN DEN+HCB
Figure 3. Figure 3. Figure 3. Figure 3.
Figure 3. Effect of statins on Hep-G2 viable cell number. The viable cell number was evaluated using the MTT assay. The absorbance was meas-ured at 570 nm, and the results were expressed as percentage of ETOH-treated cells. A. A. A. A. A. Cells were treated with AT (10, 20 and 30 μM) or (BBBBB) SM (5, 10 and 20 μM) for 24 h. Values represent means ± SEM of the three in-dependent studies.
A AA AA
B B B B B
125
100
75
50
25
0
Cell survival (%)
C ETOH 10 20 30
AT (μM)
125
100
75
50
25
0
Cell survival (%)
C ETOH 5 10 20
SM (μM)
Effect of HCB on
HMGCoAR mRNA levels in Hep-G2 cells
Hep-G2 is a well-differentiated human hepatocellular carcinoma cell line that preserves numerous liver-specific functions and thus can serve as an in vitro model.
Consistent with our previous results showing that HCB induces cell proliferation in a dose-dependent
man-ner in Hep-G2 cells,26 we evaluated HCB treatment effect
(0.05, 0.5 and 5 μM) on HMGCoAR mRNA levels. As
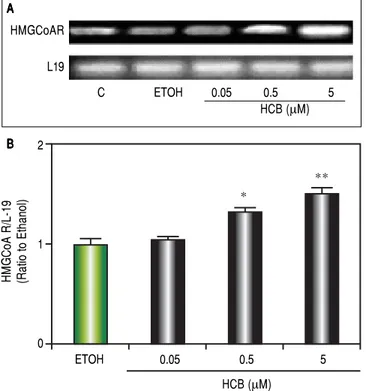
shown in figure 3, HMGCoAR mRNA levels significantly increased (32% to 54%) in total cell lysates of 0.5 and 5 μM HCB-treated cells, respectively, when compared to ETOH (Figure 4).
Effect of statins on
HMGCoAR mRNA levels in HCB-treated Hep-G2 cell
To evaluate the effect of statins on HMGCoAR mRNA expression, Hep-G2 cells were pretreated with increasing
doses of AT (10, 20 and 30 μM) or SM (5, 10 and 20 μM)
for 3 h and then treated with HCB (5 μM) for 24 h. As
shown in figure 5, HMGCoAR mRNA levels significantly increased due to HCB effects. Nevertheless, HMGCoAR
Figure 4. Figure 4. Figure 4. Figure 4.
Figure 4. HCB induces HMGCoAR mRNA expression. Hep-G2 cells were treated with HCB (0.05, 0.5 and 5 μM). A.A.A.A. Representative pattern of HM-A. GCoAR cDNA from ETOH and HCB-treated cells, synthesized from total RNA. L-19 was used as a loading control. B.B.B.B.B. Quantification of cDNAs, after correction with L-19 cDNA. Values are means ± SEM of three independent experiments. Significantly different (* p < 0.05) compared to ETOH group.
B B B B B
Figure 5. Figure 5.Figure 5.
Figure 5.Figure 5. Analysis of statins effect on HMGCoA R mRNA expression in HCB-treated Hep-G2 cells. A. A. A. A. A. Hep-G2 cells were pretreated with AT (10, 20 and 30 μM) or SM (5, 10 and 20 μM) for 3 h and then treated with HCB (5 μM) for 24 h. B. B. B. B. L-19 was used as a loading control. Representative pat-B. terns of RT-PCR amplification of HMGCoAR cDNA from ETOH and statins-treated cells, synthesized from total RNA are shown in the upper panel. Quantification of HMGCoAR mRNA, after correction with L-19 is shown in the lower panel. Values are means ± SEM of three independent experi-ments. Significantly different (* p < 0.05) compared to ETOH group.
B BB BB
HMGCoA R/L-19 (Ratio to Ethanol) 2
1
0
ETOH 0.05 0.5 5
HCB (μM)
*
**
HMGCoAR
L19
C ETOH 0.05 0.5 5
HCB (μM) A
A A A A
A AA AA
ETOH 0 10 20 30
AT (μM) mRNA
HMGCoA R
L-19
HCB (5 μM)
ETOH 0 10 20 30
SM (μM) mRNA
HMGCoA R
L-19
HCB (5 μM)
mRNA HMGCoA/L-19
(Ratio to ETOH)
2
1
0
ETOH 0 10 20 30
AT (μM) HCB (5 μM)
mRNA HMGCoA/L-19
(Ratio to ETOH)
2
1
0
ETOH 0 5 10 20
SM (μM) HCB (5 μM)
+ **
*
+ **
PCNA
β-actin
HCB (5 μM) mRNA levels significantly decreased by 29% and 38%
when pretreated with AT 10 and 20 μM (respectively),
reaching baseline values with AT 30 μM, when compared
to HCB-treated cells without AT pretreatment. Similarly,
pretreatment with SM at 5 and 10 μM decreased
HMG-CoAR mRNA levels by 21% and 31% (respectively),
reaching baseline values with SM 20 μM, when compared
to HCB-treated cells without SM pretreatment (Figure 5).
Statins effect on
HCB-induced proliferation in Hep-G2 cells
Since we have previously demonstrated that 5 μM
HCB induced PCNA-expression in Hep-G2 cells,26 we
evaluated the dose-response effects of statins on cell pro-liferation. Western blots analysis showed that AT
pretreat-B B B B B
Figure 6. Figure 6. Figure 6.
Figure 6. Figure 6. Statins effect on HCB-induced cell proliferation. A.A.A.A.A. Western blot analysis of PCNA in total lysate of Hep-G2 cells treated with 5 μM HCB, and pretreated with AT (10, 20, and 30 μM) for 3 h. Quantification of PCNA protein levels by densitometric scanning of the immunoblots is shown in the lower panel. B.B.B.B.B. Western blot analysis of PCNA in total lysate of Hep-G2 cells treated with 5 μM HCB, and pretreated with SM (5, 10 and 20
μM). Quantification of PCNA protein levels by densitometric scanning of the immunoblots is shown in the lower panel. Values are means ± SEM of three independent experiments. Significantly different (* p < 0.05 and **p < 0.01) compared to HCB-treated cells.
A A A A A
Figure 7. Figure 7.Figure 7. Figure 7.
Figure 7. Effect of statins on TGF-β1 protein levels, in Hep-G2 cells treat-ed with HCB. A. A. A. A. A. Western blot analysis of TGF-β1 protein levels in Hep-G2 cells pretreated with AT (10, 20 and 30 μM) or SM (5, 10 and 20 μM) for 3 h and then treated with HCB (5 μM) for 24 h. Quantification of TGF-β1 L-19 ratio to ETOH is shown in the lower panel. B. B. B. B. B. Values are means ± SEM of three independent experiments. Significantly different (* p < 0.05 and **p < 0.05) compared to HCB-treated cells.
B BB BB
ETOH 0 10 20 30
AT (μM)
ETOH 0 5 10 20
SM (μM) PCNA
β-actin
HCB (5 μM) 2
1
0
PCNA/
β
-actin (Ratio to ETOH)
ETOH HCB 10 20 30
AT (μM) HCB (5 μM)
2
1
0
PCNA/
β
-actin (Ratio to ETOH)
ETOH HCB 5 10 20
SM (μM) HCB (5 μM)
*
*
**
2
1
0
TGF-β
1/
β
-actin (Ratio to ETOH)
ETOH HCB 5 10 20
SM (μM) HCB (5 μM)
**
A AA AA 2
1
0
TGF-β
1/
β
-actin (Ratio to ETOH)
ETOH HCB 10 20 30
AT (μM) HCB (5 μM)
*
ment (10, 20 and 30 μM) significantly reduced HCB-in-duced PCNA levels by 24%, 52% and reaching baseline values at maximum (respectively) when compared to
HCB group (Figure 6A). In a similar manner SM
pre-treatment (5, 10 and 20 μM), significantly reduced
HCB-induced PCNA levels (30%, 58% until reaching basal values at maximum doses, respectively), when compared to HCB group (Figure 6B). Altogether, the above results demonstrate that statins antagonize HCB-induced cell proliferation in Hep-G2 cells.
Statins effect on
TGF-βββββ1 levels in HCB treated Hep-G2 cells
Given that TGF-β1 is one of the most relevant
cy-tokines that intervene in the apoptotic and/or proliferative processes in hepatocytes, we evaluated the statins effect on
TGF-β1 levels in HCB-treated Hep-G2 cells. Hep-G2
cells were pretreated with AT (10, 20 and 30 μM) or SM
(5, 10 and 20 μM) or ETOH for 3 h, and then treated with
HCB (5 μM) for 24 h. Western blot analysis showed a
sig-nificant reduction in TGF-β1 levels, when Hep-G2 cells
were treated with both statins: AT (23%, 29% and 45%), and SM (11%, 24% and 40%) respectively, until reaching baseline values at maximum doses, when compared to HCB group (Figure 7).
Role of TGF-βββββ1 in
statins-induced anti-proliferative effect
We further investigated whether the statins anti-prolif-erative effect in HCB-treated Hep-G2 cells was mediated
by TGF-β1. When Hep-G2 cells were treated with HCB 5
μM (lane 2) or CM (lane 3), a significant increase in
PCNA levels (42% and 38%) was observed when com-pared to ETOH, respectively.
Figure 8. Figure 8. Figure 8. Figure 8.
Figure 8. Role of TGF-β1 in statins-induced antiproliferative effect. Lane1: Hep-G2 cells treated with ETOH, lane 2: Hep-G2 cells treated with HCB (5 μM), lane 3: Hep-G2 cells treated with conditioned medium (CM), lane 4: Hep-G2 cells pre-treated with AT (30 μM), lane 5: Hep-G2 cells pre-treated with AT + HCB, lane 6: Hep-G2 cells pre-treated with AT + CM, lane 7: G2 cells treated with ETOH, lane 8: Hep-G2 cells treated with HCB (5 μM), lane 9: Hep-G2 cells treated with TGF-β1, lane 10: Hep-G2 cells treated with an exogenous TGF-β1 inhibi-tor, lane 11: Hep-G2 cells pre-treated with
TGF-β1 inhibitor + TGF-β1, lane 12: Hep-G2 cells pre-treated with TGF-β1 + AT (30 μM) and lane 13: Hep-G2 cells pre-treated with AT and
TGF-β1 inhibitor and after with HCB and TGF-β1.
ETOH HCB CM AT HCB + AT CM + AT
10 ± 0.8 29±1.8** 31±2.7** 9±0.7 8.7± 0.6 10±0.8
ETOH HCB TGF-β1 1/TGF-β1 TGF-β1- TGF- HCB + AT + I/TGF-β1 β1 + AT TGFβ1 +
I/TGF-β1
11± 0.7 30± 1.9** 33±2.1* 10± 0.7 13± 0.7 9 ± 0.6 10± 0.8
A A A A A
B B B B B
7 8 9 10 11 12 13
PCNA
β–actin
ETOH + – – – – – –
HCB (5 μM) – + – – – – +
AT (30 μM) – – – – – + +
TGF-β1 – – + – + + +
I/ TGF-β1 – – – + + – +
1 2 3 4 5 6
PCNA
β-actin
ETOH + – – – – –
HCB (5 μM) – + – – + –
CM – – + – – +
Our results show that AT pretreated cells did not show increases in PCNA levels with HCB or MC treatment (lanes 5 and 6, respectively). On the other hand, Hep-G2
cells treated with TGF-β1 showed a significant increase in
PCNA levels (lanes 9) and this effect was blocked when
these cells were pretreated with an exogenous TGF-β1
in-hibitor (lane 11). Similarly, Hep-G2 cells pre-treated with
AT and TGF-β1 showed no changes in PCNA levels (lane
12). Finally, Hep-G2 cells pre-treated with AT and
I/TGF-1 and then with an exogenous TGF-β1 and HCB, showed
no changes on PCNA levels (lane 13) (Figure 8A and 8B).
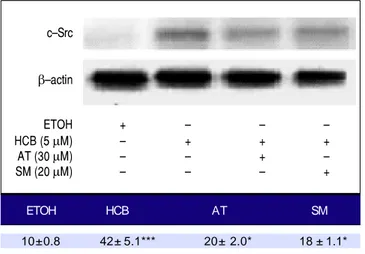
Statins effect on
c-Src levels in HCB treated Hep-G2 cells
Given that TGF-β1 activates c-Src kinase, and c-Src
pathway activation has been observed in about 50% of
tu-mors from various organs including the liver,22 we
evaluat-ed the effect of statins on c-Src protein levels in HCB-treated cells. Our results showed that HCB signifi-cantly increased phosphorylated c-Src protein levels
(136%). Pre-treatment with AT (30 μM) and SM (20 μM)
decreased this HCB-induced elevation in phosphorylated c-Src levels (41% and 40%, respectively). However, it does not return to baseline values when compared to HCB 5
μM treated cells (Figure 9).
Statins effect on
DI levels in HCB treated Hep-G2 cells
Disruptive hormone plays a critical role in the devel-opment of pre-neoplastic lesions. T3 is one of the major
cell cycle regulators and its levels are regulated by the ac-tivity of the enzyme DI. In HCB treated cells, mRNA DI
levels were significantly reduced by 45% (p ≤ 0.01). When
both statins were added to treated cells, they reversed this effect and mRNA DI levels returned to their baseline
val-ue(Figure 10).
DISCUSSION
Dysregulated cell proliferation is the main mechanism of hepatocarcinogenesis, leading to tumor growth and in-vasion. However, the mechanism of this proliferation is complex and poorly understood. Over the last few years, many molecular targets have been proposed as potential
sites for advanced HCC treatment.2,3 Limited clinical and
epidemiologic data suggest that statins may improve HCC
outcomes, a tumor associated with poor prognosis.4
In this study, we have investigated the cellular effects of statins (atorvastatin and simvastatin) on HCB-induced proliferation in Hep-G2 cells. We found that incubation with atorvastatin or simvastatin inhibits HCB-induced cell proliferation in cultured Hep-G2 cells. We have demon-strated for the first time that, statins induced inhibition of proliferation might at least be partially explained by a
de-crease in TGF-β1 expression and by a downstream
de-crease in c-Src phosphorylation.
Other authors observed that simvastatin prevents pro-liferation and favors cellular apoptosis in a rat
osteosarco-ma line, UMR-106.27 It is interesting to note that they use
doses of 3-10 μM; however, we observed that 20 μM
might be an optimal dose for proliferative effect rever-sion. Atorvastatin inhibits in vitro proliferation at dose of
Figure 9. Figure 9. Figure 9.
Figure 9. Figure 9. Analysis of the expression of c-Src by Western blot. Hep-G2 cells were pretreated with AT (30 μM) or SM (20 μM) for 3 h and then HCB (5
μM) for 24 h. β-actin was used as charge control. The results of the bands optical analysis are shown in the bottom panel * p ≤ 0.05, ***p ≤ 0.01 re-spect HCB.
ETOH HCB AT SM
10± 0.8 42± 5.1*** 20± 2.0* 18 ± 1.1*
Figure 10. Figure 10. Figure 10. Figure 10.
Figure 10. Analysis of the expression of mRNA DI by RT-PCR. Hep-G2 cells were pretreated with AT (30 μM) or SM (20 μM) for 3 h and then HCB (5 μM) for 24 h. L-19 was used as charge control. The results of the bands optical analysis are shown in the bottom panel ** p ≤ 0.05 respect HCB.
ETOH HCB AT SM
30±0.8 12±1.1** 31± 2.7 32± 2.1
c–Src
β–actin
ETOH + – – –
HCB (5 μM) – + + +
AT (30 μM) – – + –
SM (20 μM) – – – +
mRNA DI
ETOH + – – –
HCB (5 μM) – + + +
AT (30 μM) – – + –
0.4 nM in hepatic myofibroblasts.28 In this study, although
both statins present a complete reversion of the HCB pro-liferative effect, atorvastatin appears to be more effective at the highest dose (30 μM).
In a previous study, we have demonstrated that HCB deregulates cell growth and alters growth factors such as
EGF and TGF-β1 expression levels, as well as theirs
sign-aling pathways, both being involved in developmental and tumorigenic processes.26,29 Here, in the in vivo induction/
promotion HCC model and in the in vitro model, we use
HCB to induce cell proliferation. This increase in cell proliferation (supported by an increased PCNA levels) was accompanied by increases in HMGCoAR and
TGF-β1 mRNA levels.
Previously, we had demonstrated that HCB-induced proliferation in Hep-G2 cell is mediated by an increase in
TGF-β1 expression. In this study, we evaluated atorvastatin
and simvastatin effect on HCB-induced proliferation.
Like-wise, we analyzed the potential role of TGF-β1 in the
stat-ins mechanism of action in the HCB-induced proliferation
model. TGF-β1 involvement in the statins mechanism of
action to reduce cell proliferation had been previously de-scribed.30,31 However, it is unclear which molecules are
in-volved in the downstream pathway of this cytokine.
One of the potential molecules involved could be c-Src. Its pathway activation has been observed in about 50%
of tumors from various organs including the liver,22 c-Src
can cooperate with kinases receptors to signal through downstream molecules, such as PI3K/PTEN/Akt, Ras/Raf/ Mek1/2/Erk1/2 and STATs. In many cancer cell lines, tu-mors signal transducers and transcription activator pro-teins (STAT) are often deregulated with persistent activation in tyrosine phosphorylation. STAT1 is generally considered a tumour suppressor but there is growing evi-dence that it can also act as a tumour promoter. Therefore, the JAK/STAT signaling pathway is one of the most prom-ising targets in the cancer therapy. Our hypothesis about
the role of c-Src in the inhibition of TGF-β1-induced
proliferation is consistent with the observations of Sato, et
al., who demonstrated that TGF-β1 can induce c-Src
phos-phorylation.23
Here, we have demonstrated for the first time, the downstream role of c-Src in Hep-G2 cells proliferation.
We have also demonstrated for the first time that TGF-β1/
c-Src pathway may be inhibited by both statins in a dose dependent manner.
The role of thyroid hormones in carcinogenesis has been postulated for many years. However, there is not enough data for a complete understanding of this process. Triiodothyronine (T3) acts through its nuclear receptors, the thyroid hormone receptors (THR). T3 is produced by monodeiodination catalyzed by type 1 iodothyronine dei-odinase (DI). This enzyme is present in almost all tissues,
but the highest concentrations were found in the thyroid, the liver, and the kidneys.32 Both its enzymatic activity and
its gene expression have been examined in some neoplas-tic tissues. Significant decreases in gene expression and
enzyme activity were found in several of them.33 HCB is a
hormone disruptor and induces hypothyroxinemia, and it is well known that T3 has a negative regulatory effect on
the cell cycle.29 A possible explanation could be that
thy-roid hormones deregulation may play an important role in HCC development as well as in the statins mechanism key on cell proliferation inhibition.
In our previous study, we demonstrated that HCB in-creases cell proliferation, alters mRNA DIII and TH
con-centration in induction/promotion rat liver model.29 In
this study, our results showed that HCB increased cell proliferation and decreased mRNA DI levels in Hep-G2 cells. It is possible that DI decreased expression is partly responsible for the decrease in tissue T3 and this event contributes to the deregulation of the cell cycle. More ex-periments are needed to explore this finding.
We showed here that the increase in cell proliferation as well as the decrease in mRNA DI levels are mediated
by TGF-β1. We also demonstrated that statins inhibit cell
proliferation by decreasing TGF-β1 levels.
It is known that there is a regulation between TGF-β1
and DI enzyme. It is possible that statins mediated
TGF-β1 reduction counteracts the effects on DI and T3 levels,
resulting in normal T3 tissue levels.
In preliminary experiments (data not shown) per-formed in our laboratory, we observed that exogenously administered thyroid hormones reduce HCB-induced
cell proliferation in the Hep-G2 cell line. Won Park, et al.
showed that THR could down regulate the activity of c-Src in the presence of T3 via phosphorylation, suggesting that low T3 levels generate a c-Src related
pro-prolifera-tive process.34 More experiments are needed to validate
these results in our experimental model.
Summarizing, our study showed for the first time that atorvastatin and simvastatin can revert HCB-induced pro-liferative effects on Hep-G2 cells. In addition, this effect
is mediated by the inhibition of TGF-β1 and the
down-stream c-Src phosphorylation pathway. The TH
homeos-tasis deregulation could be potentially involved. TGF-β1
and c-Src may be the statins molecular targets in early events of hepatocarcinogenesis.
ABBREVIATIONS
• AT: Atorvastatin.
• CM: conditioned medium.
• c-Src: cellular Src kinase, Proto-oncogene tyrosine-protein kinase Src.
• DI: deiodinase I. • HBV: hepatitis B virus. • HCB: hexachlorobenzene.
• HCC: Hepatocellular carcinoma.
• HCV: hepatitis C virus.
• HMGCoAR: 3 -hydroxy-3-methylglutaryl coenzyme-A reductase.
• HSCs: hepatic stellate cells.
• HVPG: hepatic venous pressure gradient. • i.p.: intra peritoneal.
• PCNA: Proliferating cell nuclear antigen. • pc-Src: phosphorylated c-SRC.
• SM: Simvastatin.
• STAT: signal transducer and activator of transcription.
• T3: triiodothyronine.
• TGF-βββββ1: transforming growth factor-β1.
• TH: thyroid hormones.
• THR: thyroid hormone receptor.
CONFLICT OF INTEREST
The authors who have taken part in this study declared that they do not have anything to disclose regarding fund-ing or conflict of interest with respect to this manuscript.
FINANCIAL SUPPORT
This work was supported by grant SAF2012-32491 from Plan Nacional (MINECO) and grant S2010/BDM-2423 (MOIR) from Comunidad de Madrid, Spain, and by a grant UBACYT 20020120200258 /EXP-UBA Nº 17064/ 2012 from Universidad de Buenos Aires, Ciudad Autóno-ma de Buenos Aires, Argentina.
REFERENCES
1. Jemal A, Bray F, Center MM, Ferlay J, Ward E, Forman D. Global cancer statistics. Cancer J Clin 2011; 61: 69-90. 2. Villanueva A, Llovet JM. Targeted therapies for
hepatocellu-lar carcinoma. Gastroenterology 2011; 140: 1410-26. 3. Tanaka S, Arii S. Molecular targeted therapies in
hepatocel-lular carcinoma. Semin Oncol 2012; 39: 486-92.
4. Goodman M, Cook-Wiens G , Sundaram V, Jeon CY. Cancer Epidemiol Biomarkers Prev. Statin Use and Survival with Ear-ly-Stage Hepatocellular Carcinoma 2016; 25: 686-92. 5. Wang CY, Liu PY, Liao JK. Pleiotropic effects of statin
thera-py: molecular mechanisms and clinical results. Trends Mol Med 2008; 14: 37-44.
6. Pisanti S, Picardi P, Ciaglia E, D'Alessandro A, Bifulco M. Novel prospects of statins as therapeutic agents in cancer. Pharmacol Res 2014; 88: 84-98.
7. Bonovas S. Statins: do they have a potential role in cancer prevention and modifying cancer-related outcomes? Drugs 2014; 74: 1841-8.
8. Simon TG, Bonilla H, Yan P, Chung RT, Butt AA. Atorvastatin and fluvastatin are associated with dose-dependent reduc-tions in cirrhosis and hepatocellular carcinoma, among
pa-tients with hepatitis C virus: Results from ERCHIVES. Hepa-tology 2016; 64: 47-57.
9. Hsiang JC, Wong GL, Tse YK, Wong VW, Yip TC, Chan HL. Statin and the risk of hepatocellular carcinoma and death in a hospital-based hepatitis B-infected population: A propensi-ty score landmark analysis. J Hepatol 2015; 63: 1190-7. 10. Chen HH, Lin MC, Muo CH, Yeh SY, Sung FC, Kao CH.
Com-bination Therapy of Metformin and Statin May Decrease Hepatocellular Carcinoma Among Diabetic Patients in Asia. Medicine (Baltimore) 2015; 94: e1013.
11. McGlynn KA, Hagberg K, Chen J, Graubard BI, London WT, Jick S, Sahasrabuddhe VV. Statin use and risk of primary liver cancer in the Clinical Practice Research Datalink. J Natl Cancer Inst 2015; 107: pii: djv009.
12. Tsan YT, Lee CH, Wang JD, Chen PC. Statins and the risk of hepatocellular carcinoma in patients with hepatitis B virus in-fection. J Clin Oncol 2012; 30: 623-30.
13. McGlynn KA, Divine GW, Sahasrabuddhe VV, Engel LS, VanSlooten A, Wells K, Yood MU, Alford SH. Statin use and risk of hepatocellular carcinoma in a U.S. population. Cancer Epidemiol 2014; 38: 523-7.
14. Lai SW, Liao KF, Lai HC, Muo CH, Sung FC, Chen PC. Statin use and risk of hepatocellular carcinoma. Eur J Epidemiol 2013; 28: 485-92.
15. Tsan YT, Lee CH, Ho WC, Lin MH, Wang JD, Chen PC. Stat-ins and the risk of hepatocellular carcinoma in patients with hepatitis C virus infection. J Clin Oncol 2013; 31: 1514-21. 16. Shi M, Zheng H, Nie B, Gong W, Cui X. Statin use and risk of
liver cancer: an update meta-analysis. BMJ Open 2014; 4: e005399.
17. Zhong GC, Liu Y, Ye YY, Hao FB, Wang K, Gong JP. Meta-analysis of studies using statins as a reducer for primary liv-er cancliv-er risk. Sci Rep 2016; 6: 26256.
18. Simon TG, King LY, Zheng H, Chung RT. Statin use is asso-ciated with a reduced risk of fibrosis progression in chronic hepatitis C. J Hepatol 2015; 62: 18-23.
19. Yang YH, Chen WC, Tsan YT, Chen MJ, Shih WT, Tsai YH, Chen PC. Statin use and the risk of cirrhosis development in patients with hepatitis C virus infection. J Hepatol 2015; 63: 1111-7.
20. Matusewicz L, Meissner J, Toporkiewicz M, Sikorski AF. The effect of statins on cancer cells-review. Tumour Biol 2015; 36: 4889-904.
21. Cao Z, Fan-Minogue H, Bellovin DI, Yevtodiyenko A, Arzeno J, Yang Q, Gambhir SS, Felsher DW. MYC phosphorylation, activation, and tumorigenic potential in hepatocellular carci-noma are regulated by HMG-CoA reductase. Cancer Res 2011; 71: 2286-97.
22. Dehm SM, Bonham K. SRC gene expression in human can-cer: the role of transcriptional activation. Biochem. Cell Biol 2014; 82: 263-74.
23. Sato M, Kawai-Kowase K, Sato H, Oyama Y, Kanai H, Ohyama Y, Suga T, et al. c-Src and Hydrogen Peroxide Me-diate Transforming Growth Factor- 1-Induced Smooth Mus-cle Cell-Gene Expression in 10T1/2 Cells. ArteriosMus-cler Thromb Vasc Biol 2005; 25: 341-7.
24. Gustafson DL, Long ME, Thomas RS, Benjamin SA, Yang RS. Comparative hepatocarcinogenicity of hexachloroben-zene, pentachlorobenhexachloroben-zene, 1,2,4,5-tetrachlorobenhexachloroben-zene, and 1,4-dichlorobenzene: application of a medium-term liver fo-cus bioassay and molecular and cellular indices. Toxicol Sci 2000; 53: 245-52.
26. de Tomaso Portaz AC, Caimi GR, Sánchez M, Chiappini F, Randi AS, Kleiman de Pisarev DL, Alvarez L. Hexachlo-robenzene induces cell proliferation, and aryl hydrocarbon receptor expression (AhR) in rat liver preneoplastic foci, and in the human hepatoma cell line HepG2. AhR is a media-tor of ERK1/2 signaling, and cell cycle regulation in HCB-treated HepG2 cells. Toxicology 2015; 336: 36-47.
27. Sandoval-Usme MC, Umaña-Pérez A, Guerra B, Hernández-Perera O, García-Castellano JM3, Fernández-Pérez L, Sánchez-Gómez M. Simvastatin impairs growth hormone-ac-tivated signal transducer and activator of transcription (STAT) signaling pathway in UMR-106 osteosarcoma cells. PLoS One 2014; 9: e87769.
28. Klein S, Klösel J, Schierwagen R, Körner C, Granzow M, Huss S, Mazar IG, et al. Atorvastatin inhibits proliferation and apoptosis, but induces senescence in hepatic myofibrob-lasts and thereby attenuates hepatic fibrosis in rats. Lab In-vest 2012; 92: 1440-50.
29. Ridruejo E, Romero Caimi G, Obregon MJ, Randi A, Mando OG, Kleiman de Pisarev D, Alvarez L. Potential role of TGF-?1 and type III Deiodinase in hepatocarcinogenesis. In press 30. Fan Z, Jiang H, Wang Z, Qu J. Atorvastatin partially inhibits
the epithelial-mesenchymal transition in A549 cells induced by TGF-?1 by attenuating the upregulation of SphK1. Oncol Rep 2016; 36: 1016-22.
31. Shang L, Jia SS, Jiang HM, Wang H, Xu WH, Lv CJ. Simvasta-tin downregulates expression of TGF-?RII and inhibits
prolifer-ation of A549 cells via ERK. Tumour Biol 2015; 36: 4819-24. 32. Bianco AC, Salvatore D, Gereben B, Berry MJ, Larsen PR
Bi-ochemistry, cellular and molecular biology, and physiological roles of the iodothyronine selenodeiodinases. Endocr Rev 2002; 23: 38-89.
33. Ambroziak M1, Pachucki J, Stachlewska-Nasfeter E, Nau-man J, NauNau-man A. Disturbed expression of type 1 and type 2 iodothyronine deiodinase as well as titf1/nkx2-1 and pax-8 transcription factor genes in papillary thyroid cancer. Thy-roid 2005; 15: 1137-46.
34. Park SS, Eom YW, Kim EH, Lee JH, Min DS, Kim S, Kim SJ, Choi KS. Involvement of c-Src kinase in the regulation of TGF-beta1-induced apoptosis. Oncogene 2004; 23: 6272-81.
Correspondence and reprint request:
Ezequiel Ridruejo, M.D.
Laboratory of Environmental Pollutants Biological Effects, Department of Human Biochemistry, School of Medicine.
Universidad de Buenos Aires.
Paraguay 2155 5 floor, C1121ABG, Ciudad Autónoma de Buenos Aires, Argentina.