Hospital performance reports based on
severity adjusted mortality rates in patients with cirrhosis
depend on the method of risk adjustment
Robert P. Myers,* James N. Hubbard,* Abdel Aziz M. Shaheen,* Elijah Dixon,** Gilaad G. Kaplan*
* Liver Unit, Division of Gastroenterology and Hepatology, Department of Medicine, University of Calgary, Calgary, Alberta, Canada. ** Divisions of General Surgery and Surgical Oncology, University of Calgary, Calgary, Alberta, Canada.
ABSTRACT
Background. Hospital outcome report cards are used to judge provider performance, including for liver transplantation. We aimed to determine the impact of the choice of risk adjustment method on hospital rankings based on mortality rates in cirrhotic patients. Material and methods. We identified 68,426 cirrho-tic patients hospitalized in the Nationwide Inpatient Sample database. Four risk adjustment methods (the Charlson/Deyo and Elixhauser algorithms, Disease Staging, and All Patient Refined Diagnosis Related Groups) were used in logistic regression models for mortality. Observed to expected (O/E) death rates were calcu-lated for each method and hospital. Statistical outliers with higher or lower than expected mortality were identified and rankings compared across methods. Results. Unadjusted mortality rates for the 553 hospitals ranged from 1.4 to 30% (overall, 10.6%). For 163 hospitals (29.5%), observed mortality differed significantly from expected when judged by one or more, but not all four, risk adjustment methods (25.9% higher than expected mortality and 3.6% lower than expected mortality). Only 28% of poor performers and 10% of supe-rior performers were consistently ranked as such by all methods. Agreement between methods as to whe-ther hospitals were flagged as outliers was moderate (kappa 0.51-0.59), except the Charlson/Deyo and Elixhauser algorithms which demonstrated excellent agreement (kappa 0.75). Conclusions. Hospital perfor-mance reports for patients with cirrhosis require sensitivity to the method of risk adjustment. Depending upon the method, up to 30% of hospitals may be flagged as outliers by one, but not all methods. These dis-crepancies could have important implications for centers erroneously labeled as high mortality outliers.
Key words. Case-mix. Cirrhosis. Database. Risk adjustment. Mortality. Pay for performance.
Correspondence and reprint request: Dr. Robert P. Myers Liver Unit, University of Calgary
6D22, Teaching, Research and Wellness Building, 3280 Hospital Drive N.W. Calgary, AB, Canada T2N 4N1
Tel.: (403) 592-5049. Fax: (403) 592-5090 E mail: [email protected]
Manuscript received: March 16, 2012. Manuscript accepted: March 28, 2012.
INTRODUCTION
Information about the performance of hospitals, health professionals, and health care organizations has become central to health care delivery in the United States. Comparisons of patient outcomes across providers, variously called ‘performance re-ports’, ‘report cards’, or ‘provider profiles’, have been released publicly for nearly two decades and are mandated in various jurisdictions.1-3 The unres-tricted disclosure of outcome data has been proposed
as a mechanism for improving the quality of care by providing more transparency and greater accounta-bility of health care providers.4,5 Although data is conflicting, evidence suggests that publicly repor-ting performance data stimulates quality improve-ment activity, at least at the hospital level, and may influence the selection of providers by patients and managed care organizations.6-8 With growing inter-est in pay-for-performance programs as a means of rewarding quality care, the public release of perfor-mance data will likely continue to grow.9,10
conditions,13,14 we have described markedly different predicted probabilities of death in hospitalized pa-tients with cirrhosis depending on which risk ad-justment measure is employed.15 The impact of these patient-level differences on performance profiles of hospitals has yet to be determined.
Therefore, the objective of our study was to de-termine if the choice of risk adjustment method has an impact on the ranking of hospitals based on in-hospital mortality rates in patients with cirrhosis. We hypothesized that variations in risk adjustment across methods would result in conflicting hospital rankings depending on the choice of method. We fo-cused on this patient population because cirrhosis is an important and growing cause of morbidity and mortality,16,17 and already the subject of hospital rankings,18 particularly in the field of liver trans-plantation.19
MATERIAL AND METHODS
Data source
All data were extracted from the Healthcare Cost and Utilization Project (HCUP) Nationwide Inpa-tient Sample (NIS) database for the years 2002 to 2005.20 The NIS is the largest all-payer database of national hospital discharges (~8 million per an-num) maintained by the Agency for Healthcare Re-search and Quality. It represents a 20% stratified sample of non-federal acute-care hospitals in the U.S. Stratified random sampling ensures that the database is representative of the U.S. population and that it accounts for ~90% of all hospitalizations. Each discharge abstract includes a patient identi-fier, demographic data, transfer status, admission type, primary and secondary diagnoses (up to 15), procedures (up to 15), and hospital characteristics including location, teaching status, and bed size. Since each record in the NIS is for a single hospita-lization, not a person, there could be multiple re-cords for an individual if they had several hospitalizations. This NIS has been used to study the epidemiology and outcomes of numerous liver di-sorders.15,21-26 NIS data compares favorably with the National Hospital Discharge Survey, supporting the validity of this database.27
Study sample and outcomes
We used International Classification of Diseases
9th Version, Clinical Modification (ICD-9-CM)
diag-nosis codes (571.2, 571.5, and 571.6) to identify
adult patients (≥ 18 years) hospitalized with a pri-mary diagnosis of cirrhosis between 2002 and 2005.28 We also included admissions with a seconda-ry diagnosis of cirrhosis if the primaseconda-ry diagnosis was a liver-related condition (see Appendix for speci-fic conditions and their ICD-9-CM codes). We exclu-ded patients with missing data on in-hospital mortality (our primary outcome measure) or that required for calculation of the risk adjustment mea-sures (see below). We also excluded transferred pa-tients because they tend to be sicker than non-transferred patients. Their inclusion would ne-gatively affect outcomes for the accepting institution and positively bias outcomes for the transferring institution. Moreover, in-hospital mortality in pa-tients transferred out is not available. Finally, be-cause of our interest in hospital-level analyses, we eliminated institutions with fewer than 50 eligible cases over the 5-year study interval. Hospitals with fewer cases would risk violating the normal approxi-mation for mortality and produce mortality estima-tes with poor precision.12
Risk adjustment measures
bleeding, hepatic encephalopathy, and other seque-lae of chronic liver disease. Because our cohort was restricted to cirrhotic patients, we excluded these va-riables from the analysis. Previous work has revea-led a minimal impact on discrimination with exclusion of these variables.15
We also examined Disease Staging and APR-DRGs, which are proprietary risk adjustment me-thods with logic unavailable for outside scrutiny. In Disease Staging, severity is defined as the likelihood of death or organ failure resulting from disease pro-gression and independent of the treatment process.31 Disease progression is measured using four stages (with additional sub-stages) of increasing complexi-ty (stage 1 = no complications or problems of mini-mal severity; stage 2 = problems limited to a single organ or system; significantly increased risk of com-plications; stage 3 = multiple site involvement; ge-neralized site involvement; poor prognosis; and stage 4 = death). Disease Staging uses age, gender, admission and discharge status and diagnoses, to ge-nerate a predictive scale for mortality.31
APR-DRGs is a clinical model that expands on the basic DRG structure designed to group patients into approximately 500 categories with similar clinical features and resource utilization.32 APR-DRGs in-clude the addition of four subclasses to each DRG category serving to identify minor, moderate, major, or extreme risk of mortality, defined as the extent of physiologic decompensation or organ system loss of function. The process of classifying a patient con-sists of assessing the level of each secondary diagno-sis; determining the base subclass for the patient based on all of their secondary diagnoses; and fina-lly, determining the final subclass of the patient by incorporating the impact of the principal diagnosis, age, procedures, and combinations of categories of secondary diagnoses.32
Statistical analysis
We used logistic regression to develop models in-cluding each of the four risk adjustment methods. Each model also contained a set of independent va-riables that are associated with in-hospital mortali-ty in cirrhotic patients including age, gender, health insurance status (private, Medicaid, Medicare, self-pay, other/unknown), race (white, African-Ameri-can, Hispanic, Asian, other/unknown), admission status (emergency vs. urgent and elective combi-ned),25,26 and the performance of surgical procedures during the hospitalization (defined by the presence of a surgical DRG).30 To account for the complex
sampling design and the hierarchical nature of NIS data, generalized estimating equations with dischar-ge-level weights published by HCUP were used in these models.33,34
Our logistic regression models were used to cal-culate a predicted probability of death for each pa-tient according to each risk adjustment measure. For each hospital, observed/expected ratios (O/E) were calculating by dividing the observed number of deaths (O) by the expected number of deaths (E) ba-sed on the risk adjustment models. O/E ratios are commonly used in hospital report cards to judge pro-vider performance.12 O/E ratios significantly greater than 1 indicate higher than expected mortality, whe-reas ratios less than 1 indicate lower than expected mortality. Confidence intervals (95% CI) for O/E ra-tios were calculated based on a normal approxima-tion to the logarithm of the O/E ratio.35
Comparison of risk adjustment methods
Our primary objective was to compare the agree-ment between risk adjustagree-ment methods for the iden-tification of hospitals with particularly good or poor performance. We used an approach commonly em-ployed in hospital report cards, namely, the detec-tion of statistical outliers with O/E ratios significantly greater than or less than 1 (indicating higher or lower observed mortality than expected, respectively).12 For each risk adjustment measure, hospital performance was either flagged as worse than expected, better than expected, or not signifi-cantly different from expected, based on their O/E ratios. Agreement in rankings between risk adjust-ment measures was calculated using the kappa sta-tistic, which measures the proportion of observed to expected agreement.36 Kappa values below 0.4 indi-cate poor agreement; 0.41-0.60 moderate agreement; 0.61-0.80 full agreement; and greater than 0.80 al-most perfect agreement.
the predicted probabilities of death at the indivi-dual patient and hospital levels according to each of the risk adjustment methods using Pearson co-rrelation coefficients.
All statistical analyses were performed using SAS version 9.1.3 (SAS Institute Inc., Cary, NC, USA) and SAS-callable SUDAAN version 9.0.1 software (Research Triangle Institute, Research Triangle Park, NC, USA).
RESULTS
Characteristics of
the included patients and hospitals
During the four-year study period, there were 68,426 admissions of patients with cirrhosis to 553 hospitals that met our inclusion criteria. Cirrhosis was the primary diagnosis in 63% (n = 43,419) of patients. The median age of the cohort was 53 years (interquartile range [IQR] 47-62), 65% were male, 46% were white, and 27% had private health insu-rance. The majority of the patients (60%) were ad-mitted emergently and 9% underwent surgery. Median length of stay was 4 days (IQR 2-7).
Of the 553 included hospitals, 94% were urban, 44% were teaching centers, and 65% were large (as defined by the NIS). Forty-three percent of the hos-pitals were located in the Southern U.S., 26% in the West, 16% in the Northeast, and 14% in the Mid-west. The median number of total discharges per hospital and cirrhotic patients, specifically, were 18,285 (range 2,411-114,163; IQR 11,996-25,617) and 86 (range 50-890; IQR 64-133), respectively.
Relative hospital performance
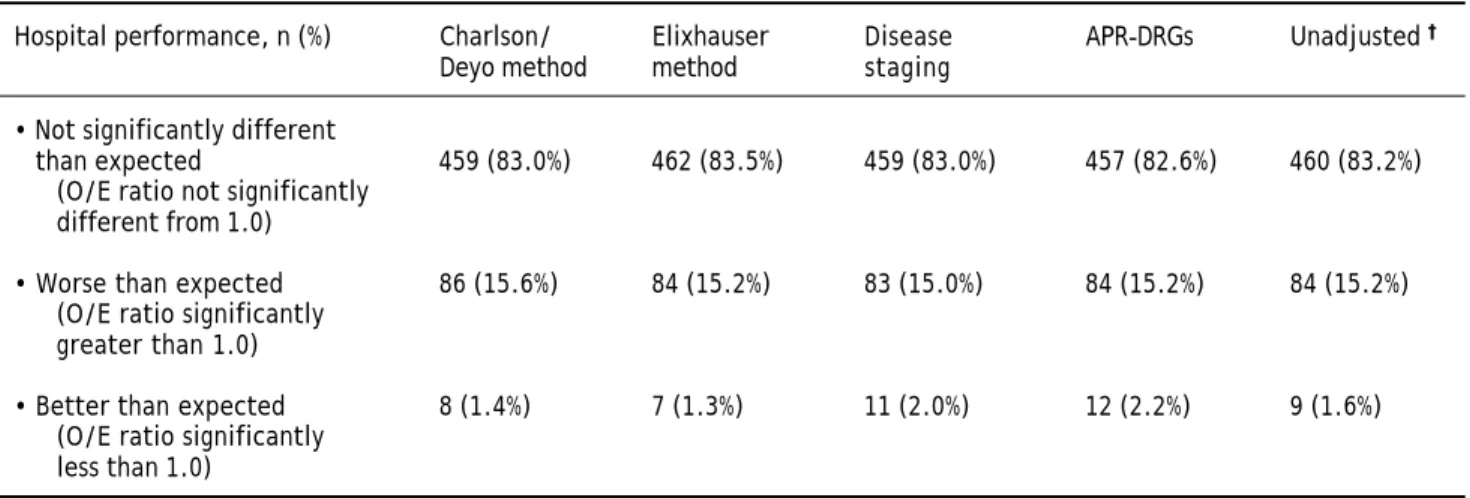
Among all hospitals, 10.6% (n=7,272) of patients died. Unadjusted mortality rates ranged from 1.4 to 29.6% for the 553 hospitals. Table 1 includes hospi-tal morhospi-tality rankings according to each of the risk adjustment measures after controlling for sociode-mographic variables, admission status, and surgical procedures. Rankings for an additional model that did not adjust for severity of illness (the ‘unadjusted model’) are also included for comparison. In gene-ral, approximately 15% of the hospitals had higher than expected mortality, 1-2% had lower than expec-ted mortality, and 83% had mortality rates that were not significantly different from expected. In to-tal, 390 hospitals (70.5%) had observed mortality ra-tes that were similar to expected according to all four risk adjustment methods. Forty hospitals (7.2%) were consistently ranked poorly and two (0.4%) had superior performance when judged by all of the methods. The median (range) unadjusted mor-tality rates among hospitals consistently ranked as poor, not significantly different than expected, and superior were 18.0% (14.3%-29.6%), 9.6% (1.4%-20.3%), and 4.9% (4.4%-5.3%), respectively.
For 163 hospitals (29.5%), observed mortality ra-tes differed significantly from expected when judged by one or more risk adjustment methods. One hun-dred forty-three hospitals (25.9%) were ranked poor-ly and 20 (3.6%) had lower than expected mortality by at least one of the methods. Table 2 shows de-tails of comparisons between risk adjustment me-thods on whether hospitals were flagged as statistical outliers, indicating the number of
hospi-Table 1. Performance of hospitals for managing patients with cirrhosis according to the method of risk adjustment (n = 553).*
Hospital performance, n (%) Charlson/ Elixhauser Disease APR-DRGs Unadjusted † Deyo method method staging
• Not significantly different
than expected 459 (83.0%) 462 (83.5%) 459 (83.0%) 457 (82.6%) 460 (83.2%) (O/E ratio not significantly
different from 1.0)
• Worse than expected 86 (15.6%) 84 (15.2%) 83 (15.0%) 84 (15.2%) 84 (15.2%) (O/E ratio significantly
greater than 1.0)
• Better than expected 8 (1.4%) 7 (1.3%) 11 (2.0%) 12 (2.2%) 9 (1.6%) (O/E ratio significantly
less than 1.0)
*Hospital performance was defined by O/E ratios for in-hospital mortality in patients admitted for cirrhosis. †††††Model included age, gender, health insurance,
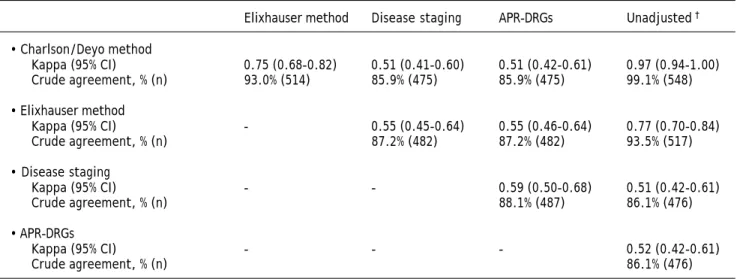
tals on which agreement occurred and kappa values for each comparison. Crude agreement in rankings between measures ranged from 86 to 99% of hospi-tals. The Charlson/Deyo and Elixhauser methods de-monstrated excellent agreement (kappa 0.75), and both agreed well with the unadjusted model (kappa 0.97 and 0.77, respectively). Agreement between the-se methods and Dithe-seathe-se Staging and APR-DRGs was lower (kappa 0.51-0.55), as was agreement between the latter measures (kappa 0.59). Agreement bet-ween Disease Staging and APR-DRGs with the un-adjusted model was moderate (kappa 0.51 and 0.52, respectively), but lower than that observed for the Charlson/Deyo and Elixhauser algorithms.
Figure 1 shows O/E ratios according to each of the risk adjustment methods for hospitals ranked as statistical outliers by at least one of the methods. For ease of presentation, 10 randomly-selected hos-pitals (out of 143) ranked as poor (Figure 1A) and 10 (out of 20) ranked as superior (Figure 1B) by at least one of the methods are included. All disagree-ments involved the ranking of a hospital as a statis-tical outlier by one or more methods versus ‘as expected’ by the other(s). None of the hospitals had lower than expected mortality by one method and hig-her than expected mortality by anothig-her. For example, hospitals B, C, F, G, and J were ranked as poor per-formers and hospital Q was ranked as superior
Table 2. Agreement between risk adjustment methods for the ranking of hospital performance (n = 553).*
Elixhauser method Disease staging APR-DRGs Unadjusted †
• Charlson/Deyo method
Kappa (95% CI) 0.75 (0.68-0.82) 0.51 (0.41-0.60) 0.51 (0.42-0.61) 0.97 (0.94-1.00) Crude agreement, % (n) 93.0% (514) 85.9% (475) 85.9% (475) 99.1% (548)
• Elixhauser method
Kappa (95% CI) - 0.55 (0.45-0.64) 0.55 (0.46-0.64) 0.77 (0.70-0.84) Crude agreement, % (n) 87.2% (482) 87.2% (482) 93.5% (517)
• Disease staging
Kappa (95% CI) - - 0.59 (0.50-0.68) 0.51 (0.42-0.61) Crude agreement, % (n) 88.1% (487) 86.1% (476)
• APR-DRGs
Kappa (95% CI) - - - 0.52 (0.42-0.61)
Crude agreement, % (n) 86.1% (476)
*Hospital performance was defined by O/E ratios for in-hospital mortality in patients admitted for cirrhosis. †††††Model included age, gender, health insurance,
race, admission status, and performance of surgery, but was not adjusted for illness severity.
Figure 1. O/E ratios for randomly selected hospitals (denoted by different letters) ranked as statistical outliers with poor (A) or superior (B) performance according to at least one of the risk adjustment methods. O/E ratios (95% CI) according to the Charlson/Deyo, Elixhauser, Disease Staging, and APR-DRG methods are presented from left to right, respectively, for each hospital. O/E ratios significantly greater than 1 indicate higher than expected mortality, whereas ratios less than 1 indicate lo-wer than expected mortality.
K L M N O P Q R S T
O/E Ratio (95% CI)
1.6
1.4
1.2
1.0
0.8
0.6
0.4
0.2
0
A B C D E F G H I J
O/E Ratio (95% CI)
3.5
3.0
2.5
2.0
1.5
1.0
0.5
0
according to all methods. On the contrary, hospital A was rated a poor performer by the Elixhauser me-thod and Disease Staging, but not by the Charlson/ Deyo algorithm or APR-DRGs. Hospital L had lower than expected mortality according to the Elixhauser algorithm and APR-DRGs, but mortality not signifi-cantly different than expected according to the Charlson/Deyo algorithm or Disease Staging.
Performance at the individual patient level
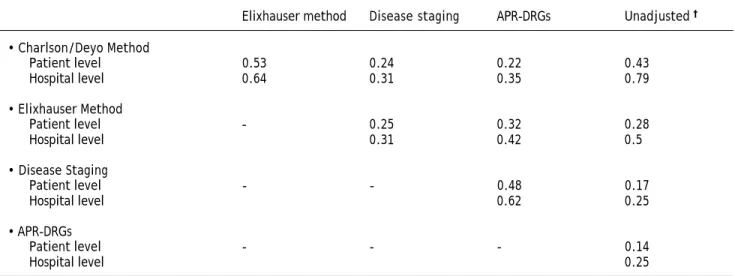
As observed at the hospital level, prediction of mortality at the individual patient level differed sig-nificantly according to the method of risk adjust-ment. Predicted mortality ranged from 1.1 to 61.2% for the Charlson/Deyo method, 0.4 to 85.4% for the Elixhauser method, 2.4 to 98.5% for Disease Sta-ging, and 0.5 to 74.5% for APR-DRGs. Correlation coefficients for predicted mortality at the patient le-vel are shown in table 3. The highest correlation co-efficients were 0.53 for the comparison of the Charlson/Deyo and Elixhauser methods, and 0.48 for Disease Staging and APR-DRGs. For comparison purposes, correlation coefficients for predicted mor-tality at the hospital level are also shown. In gene-ral, differences in predictions for individual patients tended to average out so that higher correlations among methods were observed at the hospital level.
Statistical performance for mortality prediction varied markedly across methods. Specifically, the c-statistics for mortality were 0.64 (95% CI
0.63-0.65) for the Charlson/Deyo method, 0.72 (0.71-0.72) for the Elixhauser method, 0.78 (0.78-0.79) for Di-sease Staging, and 0.85 (0.85-0.86) for APR-DRGs (P<0.0001 for all pair-wise comparisons). The c-sta-tistic for the base model that did not control for se-verity of illness was lower at 0.56 (95% CI 0.56-0.57), demonstrating the added discrimination provided by risk adjustment.
DISCUSSION
Risk-adjusted mortality rates are frequently used in public reports, pay-for-performance programs, and quality improvement initiatives as indicators of the quality of hospital care.1-3 In order to accurately assess hospital performance, it is vital to adjust for differences in illness severity among patients seen at various centers.12 Not doing so would penalize hos-pitals caring for the sickest patients, while favoring hospitals with the lowest risk case-mix. In this stu-dy of U.S. nationwide data in over 68,000 hospitali-zed patients with cirrhosis, we examined the magnitude of this effect using methods commonly employed in hospital report cards. We found that mortality rates varied widely among hospitals (from 1 to 30%) and that the probability of a hospital being identified as a statistical outlier was highly dependent on the method of risk adjustment.
Specifically, 30% of hospitals were identified as having poor or superior performance by one, but not all four, risk adjustment methods. Viewed in ano-ther manner, of 143 hospitals flagged by at least one
Table 3. Correlation coefficients between risk adjustment methods for predicted mortality at the individual patient (n = 68,426) and hospital levels (n = 553).*
Elixhauser method Disease staging APR-DRGs Unadjusted †
• Charlson/Deyo Method
Patient level 0.53 0.24 0.22 0.43
Hospital level 0.64 0.31 0.35 0.79
• Elixhauser Method
Patient level - 0.25 0.32 0.28
Hospital level 0.31 0.42 0.5
• Disease Staging
Patient level - - 0.48 0.17
Hospital level 0.62 0.25
• APR-DRGs
Patient level - - - 0.14
Hospital level 0.25
*Figures are Pearson correlation coefficients for pair-wise comparisons of predicted mortality. †††††Model included age, gender, health insurance, race, admission
method as having higher than expected mortality, only 28% (n = 40) were categorized as such by all methods. Conversely, only 10% of centers (2 of 20) identified as superior performers had lower than ex-pected mortality when judged by all methods. There-fore, whether or not a hospital was labeled as having particularly good or poor performance de-pended in large part on the method of risk adjust-ment. These results are in accordance with findings in patients with pneumonia,39 acute myocardial in-farction40 and stroke,41 in which mortality perfor-mance varied for 29 to 32% of hospitals depending on the method of risk adjustment. These findings were not replicated in a study of patients undergo-ing coronary artery bypass graft (CABG) surgery in which hospital rankings based on observed mortali-ty were essentially unaffected by risk adjustment.42
We compared four methods of risk adjustment ba-sed on widely available hospital discharge abstract data. Although alternative methods, including clini-cal and laboratory-based measures (e.g. the Child-Pugh or Model for End-stage Liver Disease scores), may have improved model performance,43,44 this data is not routinely available in administrative da-tabases including the NIS. We chose these methods because they encompass both proprietary (Disease Staging and APR-DRGs) and non-proprietary (Charlson/Deyo and Elixhauser algorithms) alterna-tives, and they are commonly used by payers, policy-makers, and researchers in the assessment of patient outcomes and provider performance.12 As illustrated in table 2, agreement between methods was variable and linked with model performance. The most discriminative models, Disease Staging and APR-DRGs (c-statistics 0.78 and 0.85, respecti-vely) were in agreement (kappa 0.59), while the less discriminative Charlson/Deyo and Elixhauser algo-rithms (c-statistics 0.64 and 0.72, respectively), agreed very well with each other (kappa 0.75), but less so with the other measures (kappa 0.51-0.55). Analogous results were found in our analyses of co-rrelation coefficients for predicted mortality at the patient and hospital levels (Table 3). In some instan-ces, rankings of hospital performance based on un-adjusted mortality rates agreed as much or more than assessments including risk adjustment (Tables 2 and 3). This finding may suggest that severity ad-justment is not useful. However, it is important to note that unadjusted mortality rates predict that each cirrhotic patient within a hospital has the same chance of dying (i.e. the overall rate, 10.6%). Risk adjustment permits the identification of catego-ries of patients with very different likelihoods of death,
which can facilitate the interpretation of hospital death rates. For example, one would be more con-cerned if a hospital’s deaths were occurring among low-risk versus high-risk patients. The identification of such disparities may permit more efficient targe-ting of quality improvement initiatives to achieve better patient outcomes.
losses, suspension of residency training programs, and personal and professional implications for heal-th care workers),48,49 such discrepancies are of con-siderable importance. Conversely, being labeled a superior performer can have a variety of rewards, most notably financial, as attested to by the marke-ting practices of hospitals with such designations.21 Although we could not specifically address the per-formance of liver transplant centers using the NIS database due to a small number of hospitals perfor-ming transplants, our findings have important im-plications worthy of examination with more applicable datasets (e.g. the UNOS database).
Our study has several limitations. First, as with all studies using administrative data, the validity of coding must be considered.50 Because hospital dis-charge abstracts often result from billing, financial motivations may compromise data accuracy. For example, ‘code creep’ –deliberate and systematic shifts in diagnostic coding made specifically to in-crease reimbursement– is a well-recognized pheno-menon that may affect risk-adjusted outcomes based on hospital discharge abstracts.51,52 Second, we as-sessed in-hospital mortality only. Other quality indi-cators including patient satisfaction, safety, and extended mortality should be examined. Unfortuna-tely, the NIS database precludes examination of post-discharge deaths (e.g. at 30 days or one year), which may vary depending on hospital discharge practices (e.g. premature discharges predisposing to higher out-of-hospital mortality). Nevertheless, stu-dies have shown good correlation between in-hospi-tal and 30-day morin-hospi-tality.53 Third, we excluded a substantial number of patients (largely due to mis-sing mortality data) and centers with fewer than ~10 hospitalized patients with cirrhosis per year. With the exception of a reduction in the proportion of hospitals identified as statistical outliers (due to the poor precision of estimates from small centers), we are skeptical that these exclusions would have had a major impact on our findings since they are non-differential with respect to our primary objecti-ve of comparing risk adjustment methods. Finally, because each record in the NIS is for a single hospi-talization, not a person, there could be multiple re-cords for an individual if they had several admissions.20 Since linkage of individual patient data within the NIS is impossible, the inability to adjust for within-patient correlations may have bia-sed our estimates of hospital mortality.
In conclusion, our results suggest that hospital performance reports for the management of patients with cirrhosis require sensitivity to the method of
risk adjustment. Depending upon the chosen me-thod, up to 30% of hospitals may be flagged as sta-tistical outliers by one, but not necessarily all methods. To avoid erroneously labeling hospitals as statistical outliers, studies of hospital performance should pay particular attention to the method of risk adjustment.
ABBREVIATIONS
• APR-DRGs: all patient refined diagnosis groups.
• CI: confidence interval. • IQR: interquartile range.
• NIS: nationwide inpatient sample. • OR: odds ratio.
• UNOS: United Network for Organ Sharing.
AUTHORS’ CONTRIBUTIONS
Dr. Myers conceived the study idea, performed statistical analyses, and drafted the manuscript. J. Hubbard and A. Shaheen assisted with statistical analyses and revised the manuscript critically for important intellectual content. Drs. Dixon and Ka-plan revised the manuscript critically for important intellectual content. Dr. Myers is the guarantor of the study.
COMPETING INTERESTS
None to disclose.
ACKNOWLEDGEMENTS
Dr. Myers is supported by a Clinical Investigator Award from the Alberta Heritage Foundation for Medical Research (now Alberta Innovates-Health Solutions) and New Investigator Award from the Canadian Institutes for Health Research (CIHR).
REFERENCES
1. Marshall MN, Shekelle PG, Leatherman S, Brook RH. The public release of performance data: what do we expect to gain? A review of the evidence. JAMA 2000; 283: 1866-74.
2. Green J, Wintfeld N. Report cards on cardiac surgeons. Assessing New York State’s approach. N Engl J Med 1995; 332: 1229-32.
3. Hannan EL, Kilburn H Jr., Racz M, Shields E, Chassin MR. Improving the outcomes of coronary artery bypass sur-gery in New York State. JAMA 1994; 271: 761-6.
5. Berwick DM, James B, Coye MJ. Connections between quality measurement and improvement. Med Care 2003; 41: 130-8. 6. Fung CH, Lim YW, Mattke S, Damberg C, Shekelle PG.
Sys-tematic review: the evidence that publishing patient care performance data improves quality of care. Ann Intern Med 2008; 148: 111-23.
7. Hibbard JH, Stockard J, Tusler M. Does publicizing hospital performance stimulate quality improvement efforts? Health Aff (Millwood) 2003; 22: 84-94.
8. Chassin MR. Achieving and sustaining improved quality: lessons from New York State and cardiac surgery. Health Aff (Millwood) 2002; 21: 40-51.
9. Epstein AM, Lee TH, Hamel MB. Paying physicians for high-quality care. N Engl J Med 2004; 350: 406-10.
10. Lindenauer PK, Remus D, Roman S, Rothberg MB, Benjamin EM, Ma A, Bratzler DW. Public reporting and pay for per-formance in hospital quality improvement. N Engl J Med
2007; 356: 486-96.
11. Iezzoni LI. Reasons for risk adjustment. In: Iezzoni LI (ed.). Risk adjustment for measuring health care outcomes. 3th. Ed. Chicago: Health Administration Press; 2003, p. 1-16. 12. Iezzoni LI. Comparing outcomes across providers. In:
Iez-zoni LI (ed.). Risk adjustment for measuring health care outcomes. Chicago: Health Administration Press; 2003, p. 297-334.
13. Iezzoni LI, Ash AS, Shwartz M, Daley J, Hughes JS, Mac-kiernan YD. Predicting who dies depends on how severity is measured: implications for evaluating patient outco-mes. Ann Intern Med 1995; 123: 763-70.
14. Iezzoni LI, Shwartz M, Ash AS, Mackiernan YD. Predicting in-hospital mortality for stroke patients: results differ across severity-measurement methods. Med Decis Making
1996; 16: 348-56.
15. Myers RP, Quan H, Hubbard JN, Shaheen AA, Kaplan GG. Predicting in-hospital mortality in patients with cirrhosis: results differ across risk adjustment methods. Hepatology
2009; 49: 568-77.
16. Kim WR, Brown RS Jr., Terrault NA, El-Serag H. Burden of liver disease in the United States: summary of a works-hop. Hepatology 2002; 36: 227-42.
17. Minino AM, Heron MP, Murphy SL, Kochankek KD. Deaths: Final data for 2004. National vital statistics reports; vol 55 no 19. Hyattsville, MD: National Center for Health Sta-tistics. 2007.
18. America’s Best Hospitals 2007. U.S. World and News Re-port. Available from: http://health.usnews.com/sections/ health/best-hospitals.
19. Transplant Program and OPO-Specific Reports. Online January 2008. Scientific Registry of Transplant Recipients (SRTR). Available from: http://www.ustransplant.org/csr/ current/csrDefault.aspx.
20. HCUP Databases. Healthcare Cost and Utilization Project (HCUP). 1998-2005. Agency for Healthcare Research and Quality, Rockville, MD. Available from: www.hcup-us.ahrq.gov/databases.jsp.
21. Shaheen AA, Myers RP. The outcomes of pregnancy in pa-tients with cirrhosis: a population-based study. Liver Int
2009; 30: 275-83.
22. Shaheen AA, Kaplan GG, Hubbard JN, Myers RP. Morbidity and mortality following coronary artery bypass graft sur-gery in patients with cirrhosis: a population-based study.
Liver Int 2009; 29: 1141-51.
23. Myers RP, Shaheen AA, Hubbard JN, Kaplan GG. Characte-ristics of patients with cirrhosis who are discharged from the hospital against medical advice. Clin Gastroenterol Hepatol 2009; 7: 786-92.
24. Congly SE, Shaheen AA, Meddings L, Kaplan GG, Myers RP. Amoebic liver abscess in USA: a population-based study of incidence, temporal trends and mortality. Liver Int 2011; 31: 1191-8.
25. Myers RP, Papay KD, Shaheen AA, Kaplan GG. Relationship between hospital volume and outcomes of esophageal vari-ceal bleeding in the United States. Clin Gastroenterol He-patol 2008; 6: 789-98.
26. Myers RP. Racial disparities in the management of hospi-talized patients with cirrhosis and portal hypertension.
Hepatology 2008; 47: 358-60; author reply 360.
27. Whalen D, Houchens R, Elixhauser A, 2004 HCUP Natio-nwide Inpatient Sample (NIS) Comparison Report. HCUP Method Series Report # 2007-03. Online December 2, 2006. U.S. Agency for Healthcare Research and Quality. Availa-ble from: http://www.hcup-us.ahrq.gov/reports/ methods.jsp
28. International Classificiation of Diseases, 9th Revision, Cli-nical Modification (ICD-9-CM). Los Angeles: Practice Mana-gement Information Corporation, 2001.
29. Deyo RA, Cherkin DC, Ciol MA. Adapting a clinical comorbi-dity index for use with ICD-9-CM administrative databa-ses. J Clin Epidemiol 1992; 45: 613-9.
30. Elixhauser A, Steiner C, Harris DR, Coffey RM. Comorbidity measures for use with administrative data. Med Care
1998; 36: 8-27.
31. Medstat Disease Staging Software Version 5.24: Referen-ce Guide. Online November 2006. Thomson Medstat Inc. Available from: http://www.hcup-us.ahrq.gov/db/nation/ nis/Disease%20Staging%20V5.24%20Reference%20Guide. pdf.
32. Averill RF, Goldfield N, Hughes JS, Bonazelli J, McCullough EC, Steinbeck BA, Mullin R, et al. All Patient Refined Diag-nosis Related Groups (APR-DRGs) Version 20.0: Methodolo-gy overview. Online July 2003. 3M Health Information Systems. Available from: http://www.hcup-us.ahrq.gov/ db/nation/nis/APR-DRGsV20MethodologyOverviewand Bibliography.pdf.
33. Houchens R, Elixhauser A. Final Report on Calculating Na-tionwide Inpatient Sample (NIS) Variances, 2001. HCUP Methods Series Report #2003-2. Online June 2005 (revised June 6, 2005). U.S. Agency for Healthcare Research and Quality. Available from: http://www.hcup-us.ahrq.gov/re-ports/2003_2.jsp.
34. Houchens R, Chu B, Steiner C. Hierarchical Modeling using HCUP Data. HCUP Methods Series Report # 2007-01 Online. January 10, 2007. U.S. Agency for Healthcare Research and Quality. Available from: www.hcup-us.ahrq.gov/ reports/methods.jsp.
35. Hosmer DW, Lemeshow S. Confidence interval estimates of an index of quality performance based on logistic regres-sion models. Stat Med 1995; 14: 2161-72.
36. Landis JR, Koch GG. The measurement of observer agree-ment for categorical data. Biometrics 1977; 33: 159-74. 37. Shwartz M, Ash AS. Evaluating risk-adjustment models
em-pirically. In: Iezzoni LI (ed.). Risk adjustment for measu-ring health outcomes. 3th. ed. Chicago, Il: Health Administration Press; p. 231-73.
38. DeLong ER, DeLong DM, Clarke-Pearson DL. Comparing the areas under two or more correlated receiver operating characteristic curves: a nonparametric approach. Biome-trics 1988; 44: 837-45.
Appendix. ICD-9-CM diagnosis codes used to indicate the presence of liver-related conditions.
Liver-related condition ICD-9-CM diagnosis code
Acute and subacute necrosis 570
Chronic liver disease and cirrhosis 571.x Liver abscess and sequelae of chronic liver disease 572.x
Other disorders of the liver 573.x
Viral hepatitis 070.x
Malignant neoplasm of liver, primary (hepatocellular carcinoma) 155 Malignant neoplasm of liver, intrahepatic bile ducts (cholangiocarcinoma) 155.1 Disorders of iron metabolism (hemochromatosis) 275 Disorders of copper metabolism (Wilson disease) 275.1
Portal vein thrombosis 452
40. Iezzoni LI, Ash AS, Shwartz M, Daley J, Hughes JS, Mackiernan YD. Judging hospitals by severity-adjus-ted mortality rates: the influence of the severity-ad-justment method. Am J Public Health 1996; 86: 1379-87.
41. Iezzoni LI, Shwartz M, Ash AS, Hughes JS, Daley J, Mac-kiernan YD. Using severity-adjusted stroke mortality ra-tes to judge hospitals. Int J Qual Health Care 1995; 7: 81-94.
42. Landon B, Iezzoni LI, Ash AS, Shwartz M, Daley J, Hughes JS, Mackiernan YD. Judging hospitals by severity-adjusted mortality rates: the case of CABG surgery. Inquiry 1996; 33: 155-66.
43. Pine M, Jordan HS, Elixhauser A, Fry DE, Hoaglin DC, Jones B, Meimban R, et al. Enhancement of claims data to impro-ve risk adjustment of hospital mortality. JAMA 2007; 297: 71-6.
44. Pine M, Norusis M, Jones B, Rosenthal GE. Predictions of hospital mortality rates: a comparison of data sources.
Ann Intern Med 1997; 126: 347-54.
45. Iezzoni LI, Ash AS, Shwartz M, Landon BE, Mackiernan YD. Predicting in-hospital deaths from coronary artery bypass graft surgery. Do different severity measures give diffe-rent predictions? Med Care 1998; 36: 28-39.
46. Ascher NL. United Network for Organ Sharing center-spe-cific data: our report card. Liver Transpl Surg 1996; 2: 168-9.
47. Dickinson DM, Shearon TH, O’Keefe J, Wong HH, Berg CL, Rosendale JD, Delmonico FL, et al. SRTR center-specific re-porting tools: Posttransplant outcomes. Am J Transplant
2006; 6: 1198-211.
48. Ettinger WH, Hylka SM, Phillips RA, Harrison LH Jr., Cyr JA, Sussman AJ. When Things Go Wrong: The Impact of Being a Statistical Outlier in Publicly Reported Coronary Artery Bypass Graft Surgery Mortality Data. Am J Med Qual 2008. 49. Jha AK, Epstein AM. The predictive accuracy of the New
York State coronary artery bypass surgery report-card system. Health Aff (Millwood) 2006; 25: 844-55.
50. Iezzoni LI. Assessing quality using administrative data.
Ann Intern Med 1997; 127: 666-74.
51. Simborg DW. DRG creep: a new hospital-acquired disease.
N Engl J Med 1981; 304: 1602-4.
52. Iezzoni LI, Ayanian JZ, Bates DW, Burstin HR. Paying more fairly for Medicare capitated care. N Engl J Med 1998; 339: 1933-8.