C
C
|
E
E
|
D
D
|
L
L
|
A
A
|
S
S
Centro de Estudios
Distributivos, Laborales y Sociales
Maestría en Economía Universidad Nacional de La Plata
The Rise and Fall of Income Inequality in Latin
America
Leonardo Gasparini y Nora Lustig
Documento de Trabajo Nro. 118
Mayo, 2011
The Rise and Fall of Income Inequality
in Latin America
*Leonardo Gasparini
Nora Lustig
1*
Fothcoming in the Handbook of Latin American Economics, edited by José Antonio Ocampo and Jaime Ros, Oxford University Press.
1
Nora Lustig is Samuel Z. Stone Professor of Latin American Economics at Tulane University and nonresident fellow of the Center for Global Development and the Inter-American Dialogue. Email address:
[email protected]. Leonardo Gasparini is director of CEDLAS, the Center for Distributional, Labor and Social
Studies at Universidad Nacional de La Plata. Email address:[email protected] paper is partly based on
the UNDP-sponsored project “Markets, the state and the dynamics of inequality in Latin America” coordinated
1. Introduction
One of the most prominent features of Latin American countries is their high and persistent levels of socioeconomic inequalities. All nations in the region are characterized by large disparities among their citizens in income and consumption, access to education, land, basic services, and other socioeconomic variables. Inequality is a distinctive, pervasive characteristic of the region. In fact, it is often stated that Latin America is the world's most unequal region.2 In this chapter we focus the analysis on inequality in the distribution of income, the proxy for well-being that is available in all national household surveys in the
region. Although we also provide historical evidence and comparisons with other regions of the world, the chapter is mostly concerned with the income inequality patterns in Latin America since the 1980s.
The income distributions in the Latin American countries experienced two distinct trends in the period 1980-2008. During the so-called “lost decade” of the 1980s, the structural reforms of the 1990s, and the crises at the turn of the century, income inequality increased in most countries for which comparable data are available. Starting in the late 1990s in a few countries and in the early 2000s for the rest, inequality began to decline. Between 2002 and 2008, income inequality went down significantly in almost all Latin American economies. This chapter documents this pattern of rise and fall of income inequality in the region and comments on some plausible explanatory factors. After an overview of the regional trends and comparisons with other regions of the world, it focuses on three countries for which substantial analysis is available: Argentina, Brazil and Mexico.
The analysis suggests the following conclusions. The macroeconomic crises were unequalizing because the poor were less able to protect themselves from high and runaway inflation, and adjustments programs frequently hurt the poor and the middle-ranges disproportionately. The unequalizing effects of the crises were compounded because safety nets for the vulnerable were conspicuously absent or ill-designed and insufficient.3 Market-oriented reforms were associated with rising inequality, although this pattern had a notable exception in the case of Brazil. In most countries employment reallocations brought about by trade liberalization and the skilled-biased technical change associated to the modernization of
2
See BID (1998), World Bank (2004), Morley (2001) and Bourguignon and Morrison (2002). 3
the economy implied a sizeable reduction in the demand for unskilled labor, which led to higher inequality. In some countries adjustments that led to a contraction in the demand for labor affected unskilled workers disproportionately. All these changes took place in a framework of weak labor institutions and safety nets, and hence their consequences made a full impact on the social situation.
Since the early 2000s, the decline in inequality appears to be driven by a fall in skill premia in the labor market and a more progressive allocation of government spending, in particular monetary transfers. The latter is the result of the introduction of large cash transfer programs which are better targeted to the poor. The fall in the earnings gap, in turn, is probably due to a large set of factors, including the improved macroeconomic conditions that fostered employment, the petering out of the unequalizing effects of the reforms in the 1990s, the expansion of coverage in basic education, and stronger labor institutions. The empirical evidence on the driving factors of the recent fall in inequality is still scarce and fragmentary.
The rest of the paper is organized as follows. Section 1 is an overview of the main characteristics and patterns of Latin America’s income distribution, section 2 discusses the plausible determinants of the inequality changes in the region, section 3 provides an in-depth analysis of the three country cases, while section 4 closes with some concluding remarks.
2.
Latin America’s
income distribution
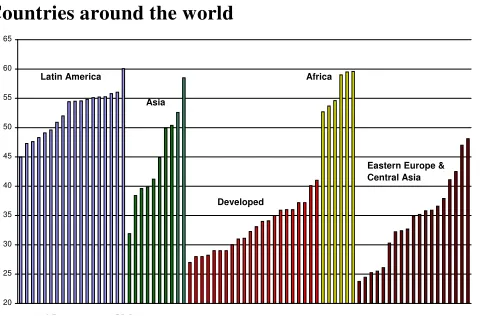
Although we are still far from having international, fully-comparable inequality statistics, all pieces of evidence suggest that Latin America is, with Africa, one of the most unequal regions in the world (see Figure 1). From the 15 most income-unequal countries in the UNU/WIDER World Income Inequality Database (WIDER, 2007), 10 belong to Latin America. The average Gini coefficient4in that region is 52.5 (year 2004), a value exceeded only by the mean Gini of those few African countries in the WIDER income database.5The average income Gini in Latin America is 8 points higher than in Asia, 18 higher than in Eastern Europe and Central Asia, and 20 higher than in the developed countries. When using
4
Named after his proponent, the Gini coefficient is a very commonly used indicator to measure inequality. The Gini coefficient is an index that can take values between zero and one (or, between zero and 100 if in percent). The closer it is to zero (one), the less (more) unequal the distribution. In practice, Ginis are usually never above 0.65 or below 0.20.
5
consumption or expenditure as the base for the Gini inequality indicator, Latin American countries also rank among the most unequal in the world.6
Figure 1
Gini coefficients
Countries around the world
LAC 52.9 20 25 30 35 40 45 50 55 60 65 Latin America Asia Developed Africa
Eastern Europe & Central Asia
Source: Gaspariniet al. (2010).
Note: each bar represents the Gini coefficient for the distribution of
household per capita income in a given country (last available observation in period 1995-2005).
Most empirical studies find that inequality in Latin America is higher than predicted according to its level of development. This “excess inequality” constitutes a pervasive
characteristic of the Latin American societies (Londoño and Székely, 2000). Figure 2 illustrates this point: Latin American countries are all above the smoothed regression line: Ginis for Latin American countries are higher than expected according to their level of per capita GDP.
Figure 2
Latin America excess inequality
Scatterplot of log per capita GDP (PPP) and Gini coefficient, around 2003 Latin American countries marked in circles
20 25 30 35 40 45 50 55 60 65
7 8 9 10 11
log GDP per capita (PPP)
G in i c o e ffi c ie n t
Source: Gasparini, Cruces and Tornarolli (2010).
6
[image:5.612.101.387.534.674.2]According to World Bank (1994), in the 1970s the income share of the bottom 20 percent in Latin America equaled 2.9 percent of total income, the lowest when compared with other developing regions. In contrast, the share of the richest 10 percent was 40.1 percent, the highest in the developing world. Psacharopoulos et al. (1992) report that at the end of the 1980s the average Gini coefficient was 0.50 compared with 0.39 for non-Latin American countries. According to estimates in Gasparini, Cruces and Tornarolli (2010), the mean Gini across Latin American and Caribbean countries has been significantly higher than in Asia, the developed countries, and Eastern Europe in the last four decades. There are signs of a small reduction in the inequality gap with Asia and Eastern Europe, two regions that experienced strong and potentially unequalizing economic transformations in the 1990s. Interestingly, the characterization of Latin America as a high-inequality region has been unchanged for decades, and probably for centuries, despite substantial changes in the demographic, economic, social and political environment.
Figure 3 suggests that Latin American distributions are mainly characterized by a higher income share of the rich, relative to countries in other regions of the world. Who are the
[image:6.612.99.330.561.706.2]losers from this “excess share”? Thefigure suggests that the eight bottom deciles have lower income shares in Latin America than in the rest of the world. In fact, if a typical Latin American distribution had to mimic a typical income distribution of the rest of the world, the income share of the top ventile (i.e. the richest 5% of the population) would have to be reduced to assign the proceeds to increase more or less evenly the shares of the poorest 80% of the population.
Figure 3
Inequality in Latin America and the world
Share of deciles in income distribution
0 10 20 30 40 50
1 2 3 4 5 6 7 8 9 10
Latin America Rest of the world
There is an interesting discussion about the historical persistence of inequality in Latin America. Some argue that Latin American societies have been highly uneven, in absolute terms and relative to the rest of the world, from the time of the conquest by Europeans, which suggests a structural feature rooted for centuries, difficult to change (Engerman and Sokoloff 1997, Engerman, Haber and Sokoloff, 2000, Robinson and Sokoloff, 2004). In contrast, others argue that the levels of inequality in the region were not particularly high until the period of development that the region experienced in the late nineteenth century, and are therefore more optimistic about the reversal of that feature. Williamson (2009) for example, estimates that inequality increased sharply with the conquest, but similarly to other regions in similar developmental stages. During the sixteenth century inequality remained at a plateau, mainly due to the high mortality of the indigenous population. The revolutions and economic stagnation in the first half of the nineteenth century reduced the levels of inequality, which substantially increased with the insertion of Latin America in the global economy towards the end of that century. Unlike other regions, like Europe or Asia, the improvement in distribution in the twentieth century was modest.
Although insightful, the historical analysis on inequality is based on scarce and fragmentary evidence subject to many methodological problems. Modern analysis is based on microdata from national household surveys that became consolidated in several Latin America countries only in the 1970s. The picture of income inequality from that decade on is hence clearer.7 During the 1970s inequality went down or remained constant in most countries, with the exception of the Southern Cone (Argentina, Chile and Uruguay), where income disparities widened. The 1980s were a “lost decade” also in distributional terms, as most countries in the region suffered significant increases in the level of income inequality. The 1990s were not successful on distributional grounds either, although experiences were more heterogeneous, as inequality increased in some countries and went down in others. The evidence indicates a small raise in the average inequality indicators for the region. Income inequality declined since the late 1990s in a few countries, and since the early 2000s in the rest. According to data from ECLAC (BADEINSO, 2010), in the period 2002-2008 inequality decreased in 14 out of the 17 continental Latin American countries, while on average the Gini coefficient dropped 2.3 points. The results are similar (slightly more
7
positive) when using data from SEDLAC (2010): income inequality went down in 16 countries, and the mean Gini fell by 2.9 points.8Figure 4 illustrates the rise and fall of income inequality in Latin America in the three decades between 1980 and 2008.9It is likely that the levels of income inequality in Latin America at the beginning of the second decade of this millennium are not very different from those prevailing in the 1970s.
Figure 4
Gini Coefficients
Latin America: 1980–2008
45 46 47 48 49 50 51 52 53 54 55
1980 1986 1992 1998 2002 2008 Source: Gaspariniet al.(2010).
Note: Data are for most recent year within two years of dates listed. To make the changes in the Gini more visible the y-axis begins at 45 instead of 0. Data for all countries since 1992. Latin American Ginis projected from data for 14 countries in 1986 and 8 countries in 1980.
3. Accounting for the inequality patterns
Which factors account for this pattern in Latin America’s inequality dynamics? In the 1980s, growing domestic macroeconomic imbalances (in particular, large fiscal deficits which were financed with loans from foreign commercial banks) coupled with adverse world economic conditions (in particular, a sharp increase in US interest rates and the sudden stop in the availability of external credit) resulted in severe balance of payments crises and produced sharp economic downturns in most countries in the region. Between 1982 and 1989 the accumulated GDP growth was either negative or nil for practically every country in Latin America. The crisis forced governments to undertake drastic adjustment programs and far-reaching reforms. The adjustment programs implied severe cuts in fiscal deficits (including social spending) and sharp devaluations of the domestic currencies. The market-oriented reforms, broadly speaking, included three main components: trade and (foreign direct)
8
Based on SEDLAC data Gasparini, Cruces and Tornarolli (2010) and López Calva and Lustig (2010) report falls in income inequality in the 2000s.
9
investment liberalization, privatization and financial liberalization. In some countries, the bulk of the reforms were introduced in the 1980s, while in others during the first half of the 1990s.
How did income distribution in Latin America change when many countries had to endure stagnant or negative growth, fiscal austerity and profound economic restructuring? Although data limitations are substantial, the pattern of increasing inequality is clear. During the 1980s the Gini coefficient rose in most countries.10 It was not always the poor whose share fell by more than that of the other groups. In several countries, it was the middle class that lost disproportionately. However, in country after country while the bottom or the middle ranges shares shrank, the share of the top ten percent increased, sometimes substantially.
Did the increase in inequality during the 1980s and 1990s result from the debt crisis and its inevitable aftermath? Or was it a result of the policies adopted by governments to restore economic stability and growth? It is always difficult to disentangle the contribution of policies from other factors to a particular outcome, and the distribution of income is not an exception. This explains why there has been a lot of controversy and conflicting evidence regarding the impact of orthodox stabilization programs and market-oriented reforms on inequality. The difficulty is compounded because there are inter-temporal (lower income today andhigher income tomorrow vs. “flatter” income growth) and within groups (e.g. rural vs. urban poor) trade-offs. Broadly, the basic conclusion of the many studies available on the
subject is “…that the impact of adjustment depends largely on the country’s initial conditions, on the nature of the shock and on the characteristics of the adjustment program. A
second finding was that the ‘no policy’ adjustment option was worse than any of the
alternatives. A third finding was that different types of poor persons (rural vs. urban) could fare quite differently during the adjustment process. Conflicts can emerge between the interests of the poor and the non-poor, and among types of poor persons, when different policy combinations result in different distributive outcomes.”11There is evidence, however, that suggests orthodox adjustment policies often resulted in overkill (Taylor, 1988). This caused poverty to increase beyond what was necessary to restore the macroeconomic equilibrium and perhaps so did inequality.
Regarding the impact of market-oriented reforms on inequality, Morley (2001) concludes that “…the recent reforms have had a negative but small regressive impact on inequality mainly because many of the individual reforms had offsetting effects. Trade and
10
See Lustig (1995), Altimir (2008), Fiszbein and Psacharopoulos (1995) and Morley (1995). 11
tax reform have been unambiguously regressive, but opening up the capital account is
progressive.” While the effect of capital liberalization is debatable, there seems to be some consensus on the (rather small) unequalizing impact of trade openness in most Latin American countries.12
A complementary explanation for the increase in inequality in some countries relies on skilled-biased technical change (SBTC) and capital incorporation. Technological and organizational changes that increase the relative productivity of skilled workers translate into wider wage gaps, and with labor market rigidities, also into lower employment for the unskilled.13 In fact, some studies find a greater relevance of the capital/technology channel over the trade channel. Behrmanet al. (2003) combine policy indices with household survey microdata on wage differentials by schooling levels for 18 Latin American countries for the period 1977-1998. The authors fail to find a significant effect of trade reform on wage differentials in their panel of countries, but they do find an impact of the share of technology
exports, which they use as a proxy to technology adoption. They conclude that “technological
progress rather than trade has been the mechanism through which the unequalizing effects have been operating”. Sánchez-Páramo and Schady (2003) reach a similar conclusion using repeated cross-sections of household surveys for a series of Latin American countries. They stress an important point: although the direct effect of trade on wage inequality may be small, trade is an important mechanism for technology transmission.14
An important point raised by some authors is that these economic changes took place in a framework of weak labor and social institutions and hence their consequences made a full impact on the social situation. In most countries the role of unions and the minimum wage was debilitated by authoritarian regimes and/or labor deregulations, while social policies, although not absent, were not very active to ameliorate the impacts of the economic changes.
Several crises hit the region at the turn of the century. While some Latin American economies experienced stagnation, others suffered severe macroeconomic crises with substantial drops in GDP. Between 1999 and 2002 Argentina, Colombia, Ecuador, Paraguay, Uruguay and Venezuela went through episodes of serious economic downturns associated with significant increases in poverty and inequality.
12
See Morley (2001), Behrman, Birdsall and Székely (2003), Vos, Ganuza, Morley and Robinson (2006) and Goldberg and Pavcnik (2007) as examples of a rich and growing literature.
13
See Acemoglu (2002) and Card and Di Nardo (2006), among others. 14
The rising trend in inequality came to a halt in the early 2000s. Since then, there seems to be a declining trend. In fact, the forces driving inequality down might have started to act in the late 1990s, but in several countries remained hidden by the highly unequalizing macroeconomic crises of the turn of the century. The decline in inequality in the 2000s has been significant in most countries, both in statistical sense and in economic magnitude. Inequality has fallen in high inequality countries (Brazil) and low inequality -by Latin American standards- countries (Argentina); in countries governed by different political models (Bolivia/Venezuela; Brazil/Chile; Mexico/Peru); in countries with an universalistic social policy (Argentina and Chile) and in countries with a traditionally exclusionary state (Bolivia and El Salvador). This widespread decline in inequality is remarkable for a region that has traditionally witnessed high and persistent -and often rising- levels of inequality. Contrary to what some observers may think, it is not just the growth dividend from the commodity boom. Inequality has declined both in fast growing countries and slow growing countries, and countries recovering from crisis. In fact, the longest periods for which the decline could be documented correspond to Brazil and Mexico, two countries whose growth rates were rather slow.
Why did inequality decline in Latin America during the 2000s? The evidence, still preliminary, points out to several different factors.15 First, in the 2000s Latin America experienced a period of strong growth, accompanied by a surge in employment. A stronger labor market is associated with fewer jobless workers and higher wages, in particular for unskilled labor, which are both factors that tend to lower income inequality. Second, changes in the expansion of basic education over the last couple of decades reduced inequality in attainment and made the returns to education curve less steep, reducing wage premia. Third, the reduction in the earnings gap also results from the petering out of the unequalizing effects of some market-oriented reforms in the 1990s. Fourth, as mentioned above several countries in the region suffered severe macroeconomic crises in the late 1990s and early 2000s associated to large jumps in inequality levels. However, their impact on inequality indicators is often short-lived: as economic relationships return to normality, inequality rapidly falls. Fifth, in several Latin American countries new administrations engaged in a more active role in the labor market, raising the minimum wage or taking a more pro-union stance, which at
15
In addition to the country studies discussed in the next section see Eberhard and Engel (2008) for Chile,
Ferreiraet al. (2007) for Brazil, Gray Molina and Yañez (2009) for Bolivia, and Jaramillo and Saavedra (2010)
least in the short run is likely to have an equalizing impact on the labor market.16 The last factor in this non-exhaustive list is more progressive social spending (monetary and in-kind transfers). In particular, after the successful experience of Progresa in Mexico, several Latin American countries adopted or expanded conditional cash transfers programs (CCTs), which according to the evidence are well targeted on the poor, and are thus highly progressive.
The next section will examine the factors affecting inequality dynamics through an in-depth analysis of Argentina, Brazil and Mexico.
4. The rise and fall in inequality in Argentina, Brazil and Mexico
Argentina, Brazil and Mexico, the three largest Latin American economies, went through a period of rising inequality during the years of adjustment and reform, a trend which came to a halt around 2000 (earlier for Brazil and Mexico and later for Argentina), when inequality began to decline. We now turn to explore the determinants of this pattern in each country.
Argentina
17Argentina, a country well-known for its large middle class in the 1960s, experienced a sharp increase in income inequality during the last thirty years. The Gini coefficient for the distribution of household per capita income in the Greater Buenos Aires area (GBA) soared from 0.345 in 1974 to 0.474 in 2006. Figure 5 shows the trends for inequality in that metropolitan area along with the evolution of per capita GDP.18
Figure 5
Inequality of Argentina
Gini coefficient, distribution of household per capita income GBA, and per capita GDP. Indices, mean 74-06=100
16
In one of the few studies that provide empirical evidence on factors behind the drop in inequality Cornia (2009) states that “…in addition to an improved business cycle and favorable terms of trade, the new policy model of fiscally prudent social-democracy which is emerging in much of Latin America generated a favorable impact on the distribution of income.”
17
Most of the section on Argentina draws from Gasparini and Cruces (2010). The data for inequality and poverty indicators come from Argentina’s main official household survey (Encuesta Permanente de Hogares, EPH), which covers the main urban areas of the country.
18
Beccaria and Carciofi (1995) and Altimir and Beccaria (2001) document income inequality in Argentina,
finding similar patterns. Trends in inequality in urban Argentina–that can be traced since the early 1990s–are
70 80 90 100 110 120 130
74 75 76 77 78 79 80 81 82 83 84 85 86 87 88 89 90 91 92 93 94 95 96 97 98 99 00 01 02 03 04 05 06
Gini GDP p/c
Episode 1: the military regime
Episode 2: the eighties
Episode 3: hyperinflation
Episode 4: the nineties
Episode 5: the crisis
Episode 6: post-crisis
Source: Gasparini and Cruces (2010).
Gasparini and Cruces (2010) divide the period 1974-2006 into six episodes. “The first episode covers the dictatorial military regime characterized by weak labor institutions, with almost no role for unions, by a sweeping trade liberalization reform, and by sharp overall increase in inequality.19 The second episode comprises most of the 1980s, and it is characterized by the return to democratic rule, a substantially more closed economy, increased union activity, stronger labor institutions (minimum wage enforcement, collective bargaining), macroeconomic instability, and a rather stable income distribution. The third episode corresponds to the serious macroeconomic crisis of the late 1980s that included two hyperinflations, and it is characterized first by a sharp increase and a consecutive sudden fall in inequality after the successful stabilization in 1991.20 The fourth episode includes most of the 1990s, and it is characterized by relative macroeconomic stability, a currency board with an exchange rate fixed to the US dollar, and deep structural reforms which implied a much more open and flexible economy, with weaker labor institutions. The income distribution during the 1990s became substantially more unequal. The recession that hit the country in the late 1990s and the ensuing macroeconomic crisis in 2001-2002, with an economic meltdown and the devaluation of the currency, mark the fifth episode, again characterized by first a sharp increase in inequality, and then a substantial fall after the stabilization. The sixth episode started around 2004 with the rapid growth in the aftermath of the crisis. Its main characteristics include the adjustment of economic agents to the new relative prices
19
Thecoup d`etatthat initiated the military regime took place in 1976. However, data are only available for 1974 and from 1980 on.
20
introduced by the devaluation, stronger labor institutions and a more extensive safety net. Inequality fell to pre-crisis levels over this period.” (Gasparini and Cruces, 2010).
Due to data availability most of the empirical research covers the fourth episode - the substantial increase in inequality during the 1990s in a context of reforms and economic growth. The Gini coefficient for the household per capita income in urban areas increased from 0.45 in 1992 to 0.505 in 2000. Gasparini and Cruces (2009) apply a parametric decomposition and find that unskilled workers lost ground both in terms of hourly wages and hours of work during the 1990s, and that these changes had a very significant role in shaping the distribution of hourly wages, earnings, and household income. What was behind the sharp increase in the gap between skilled and unskilled workers during the 1990s? There is evidence that both the sectoral re-allocation of production and employment, and changes in the skill composition within sectors favored skilled workers, in particular college graduates. Research suggests that while the direct effect of trade liberalization on wage inequality was small, the indirect effect of trade and capital account liberalization through their impact on adoption of new skill-intensive technologies of production and organization might have been substantial.21 The technological and organizational changes associated with economic openness implied a rapid decline in the demand for unskilled and semi-skilled workers who, in the absence of compensatory social protection programs and weak labor market institutions, suffered falling living standards.22
Although unemployment rose sharply in the 1990s, primarily driven by an increase in labor force participation of women and younger cohorts, itsdirectcontribution to the increase in overall inequality was rather small. Unemployment, however, may have affected inequality because of its indirect (downward) effect on wages. Some authors have emphasized the role played by macroeconomic adjustments and the resulting reduction in the aggregate demand for labor as central arguments for the increase in inequality in the 1990s.23 They point out to
“credentialism”, that is the process by which economic activities traditionally carried out by unskilled and semi-skilled workers become increasingly performed by skilled workers. This downgrading of the employment structure may have lowered the incomes of the unskilled workers who became unemployed or were forced to work fewer hours.
21
See Galiani and Sanguinetti (2003), Acosta and Gasparini (2007) and Galiani and Porto (2010) for evidence for Argentina and de Hoyos and Lustig (2009) for a broad survey.
22
Although the government had createdPlan Trabajar, an employment program, the scale at which it operated
was too small to make a noticeable difference. 23
The Argentine labor market has been characterized by the presence of strong, industry-wide unions, which played a significant role in shaping the country’s social,
economic and political outlook. The decline in union activity during the 1990s coincided with a period of rising wage inequality, but unfortunately there is little empirical evidence on the factors behind this correlation, mainly due to data limitations.
As mentioned above, following the 2002 crisis and after experiencing a sharp increase, income inequality fell: the Gini coefficient dropped from 0.533 in 2002 to 0.474 in 2006 and to 0.458 in 2009 (according to preliminary estimates at the time of writing this chapter). This period was characterized by high GDP growth and a sharp fall in the unemployment rate from more than 20 percent to 8 percent. Gasparini and Cruces (2010) argue that the fall in inequality could be accounted for by the employment generation associated with the recovery, the shift in favor of more low-skilled labor intensive sectors as a result of the devaluation in 2002, the recovery of real wages that followed the overshooting of the devaluation of the peso, a growing relevance of labor institutions (unions, collective bargaining, minimum wages), the fading out of the effect of the skill-biased technical change that occurred in the 1990s, and a significant increase in social spending, in particular due to the implementation of a large cash transfer program in 2002 – Programa Jefes y Jefas de Hogar, which covered around 20% of poor households in Argentina.
Brazil
24Brazil has one of the highest levels of income inequality in the world. There were years when
Brazil’s Gini coefficient was equal to 0.63, almost a historical and worldwide record. During the years of crisis and adjustment in the 1980s, inequality rose significantly. In contrast to what occurred in other countries, inequality did not rise in the 1990s when some market-oriented reforms were introduced, and there are some indications that trade liberalization might have reduced wage inequality. After a few years with little change, the Gini coefficient has been falling steadily since 1998. The steepest decline occurred between 2001 and 2007
when Brazil’s Gini coefficient fell 4.1 percentage points from 0.593 to 0.552 (see Figure 6). Extreme poverty and moderate poverty declined too in spite of the fact that average GDP growth during the period was modest (around 2.5 percent per year).
Figure 6
24
Most of the section on Brazil draws from Barroset al. (2010). The inequality measures are estimated using
Inequality in Brazil
Gini coefficient 1981-2007
0.45 0.5 0.55 0.6 0.65 1 9 8 1 1 9 8 2 1 9 8 3 1 9 8 4 1 9 8 5 1 9 8 6 1 9 8 7 1 9 8 8 1 9 8 9 1 9 9 0 1 9 9 1 1 9 9 2 1 9 9 3 1 9 9 4 1 9 9 5 1 9 9 6 1 9 9 7 1 9 9 8 1 9 9 9 2 0 0 0 2 0 0 1 2 0 0 2 2 0 0 3 2 0 0 4 2 0 0 5 2 0 0 6 2 0 0 7 Year G in i C o e ff ic ie n t
Source: Barroset al. (2010)
Although Brazil fared relatively better than Argentina and Mexico in the 1980s, the debt crisis took its toll. Output growth declined from 8.6 percent per year for the period 1968-1980 to 1.5 percent per year between 1968-1980 and 1990. Inflation was very high through most of the period. The Gini coefficient rose from 0.58 in 1980 to 0.61 in 1990 and the share of the bottom 20 percent declined from 3.6 percent to 2.8 percent in the same period.25
Barros, Cardoso and Urani (1993) show that the levels of unemployment and inflation were positively correlated with income inequality.26Ferreira, Leite and Litchfield (2007) also show that inflation was positively and significantly correlated with inequality for the period 1981-1993, which includes the years of high inflation and hyperinflation.
As mentioned in the previous section, available empirical studies suggest that in a number of countries trade liberalization was associated with an increase in (wage) inequality primarily because the wage skill premium increased. Ferreira, Leite and Wai-Poi (2007) found that in the case of Brazil trade liberalization produced the opposite result: the economy-wide skill-premium fell by 14.3% between 1988 and 1995. A factor that drove skill premium up in other Latin American countries was that prior to liberalization tariffs were generally higher for industries intensive in unskilled labor. That was not the case in Brazil and, thus, the changes in relative prices caused by trade liberalization had an equalizing effect through the employment and occupational reallocation that took place in response.
After 2000, the decline in inequality in household per capita income started to accelerate. From 2001 to 2007, the per capita income of the poorest 10 percent grew 7
25
Although slightly different in levels, the same change is recorded by Ferreira, Leite and Litchfield (2007). 26
percent per year, a rate of growth nearly three times the national average (2.5 percent) while that of the richest 10 percent grew only 1.1 percent. Two thirds of the decline in extreme poverty can be attributed to the reduction in inequality. For the same reduction in extreme
poverty to be reached through growth, it would have been necessary for Brazil’s overall per
capita income to have grown an extra 4 percentage points per year.
Between 2001 and 2007, there were several changes in labor markets and public policy that one would expect should have affected the distribution of post-transfer household per capita income. During this period, the wage differentials between workers of different skills, living in different locations, and working in different sectors (formal/informal; primary/secondary) narrowed. Also during this period, public transfers rose (both in terms of average benefit and coverage), and the real minimum wage increased. Barros, Carvalho, Franco and Mendonça (2010) estimate the role played by these factors by applying nonparametric decomposition methods in which actual Gini coefficients are compared with counter-factual ones generated by keeping some of the proximate determinants of income inequality or income sources unchanged (Barroset al. 2006, Barroset al. 2007).
Between 40 to 50 percent of the decline in income inequality –depending on the inequality measure- was due to changes in the distribution of non-labor income per adult. Changes in the distribution of labor income per adult can account for 31 to 46 percent of the decline in inequality, due to a significant growth in labor income per adult and to a moderate decline in its inequality. The contribution of changes in the inequality of access to jobs was rather limited; workers from poor households were not among those that benefited the most from job creation during 2001-07.
The fall in labor income inequality is accounted by several factors: a fall in the skill premium due to a combination of supply-side and demand-side factors, a reduction in spatial and sectoral labor market segmentation, and a reduction in the gaps in the access to education.27Regarding the latter factor, the 1990s was marked by an accelerated expansion of education in Brazil, more than twice as fast as the expansion that occurred in the 1980s, which resulted in a more equal distribution of educational attainment: the standard deviation in years of schooling fell from 4.51 in 2001 to 4.41 in 2007.
As mentioned above, the decline in non-labor income inequality can account for as much as 50 percent of the decline in household income inequality. Barros et al. (2010) find
27
that the contribution of changes in the distribution of income from returns to assets (rents, interest and dividends) and private transfers were unequalizing but limited. Most of the impact of non-labor income on the reduction of overall income inequality was due to changes in the distribution of public transfers: changes in size, coverage and distribution of public transfers explain 49 percent of the total decline in inequality.
Public transfers represent over 80 percent of non-labor income and 29 percent of household income and include pensions and other standard contributory social security benefits; Benefício de Prestação Continuada (a transfer to the elderly and disabled), and Bolsa Família.28 The latter is Brazil’s signature conditional cash transfer program which
distributes cash to poor families on condition that the children and adolescents must attend school and meet the basic health care requirements. The program reaches 11 million families,
a large proportion of the country’s 50 million individuals living in poverty. On average, the post-transfer income of the poor is raised by around 12 percent.29Since 2001, the government increased the average amount of all transfers and broadened the coverage of the well-targeted programs such as Bolsa Familia, whose coverage increased by close to 10 percentage points between 2001 and 2007 reaching 17 percent of households.
According to the decomposition results, while social security benefits account for almost 30 percent of the overall reduction in income inequality, changes in the BPC and Bolsa Familia explain about 10 percent of the overall decline each. In the case of social security transfers, the equalizing effect occurred primarily through an increase in the amount of the average benefit, while in the case of Bolsa Familia the predominant factor was the increase in coverage.
From 2001 to 2007 the minimum wage increased by 35 percent in real terms. Barros et al. (2010) acknowledge that raising the minimum wage must have contributed to the
reduction in inequality both through its impact on wage inequality and on the evolution of social security benefits. However, the authors argue that the minimum wage is not the most effective of the available redistributive instruments.
28
These two programs represent 1 percent of household income and 5 percent of the public transfers concept measured in the survey. Pensions and BPC are adjusted following the minimum wage. Since Lula became president of Brazil, the minimum wage has been raised significantly and therefore so have the contributory and noncontributory pension benefits.
29
Mexico
30 [image:19.612.111.432.296.480.2]The “debt crisis” was born in Mexico when the government announced in mid-1982 that it would not be able to meet its debt payments on time. In the next six years Mexico faced runaway inflation, while GDP and real wages declined at 1.8 percent and 8.6 percent a year, respectively. During the 1980s Mexico liberalized its trade and investment regimes, dismantled most of its industrial policy and privatized many state-owned enterprises. Inequality rose sharply: the Gini coefficient for household per capita monetary income went from 0.489 in 1984 to 0.564 in 1994 (Figure 7).31
Figure 7
Inequality in Mexico
Gini coefficient 1984-2006 using alternative income definitions
0.489 0.534
0.551 0.564
0.539 0.552
0.541
0.513 0.508
0.506
0.530 0.537
0.519
0.530 0.531
0.500 0.498 0.494
0.40 0.45 0.50 0.55 0.60 0.65
1984 1989 1992 1994 1996 1998 2000 2002 2004 2006 Year
G
in
i
C
o
e
ff
ic
ie
n
t
Current Monetary Income Current Total Income
Source: Esquivel, Lustig and Scott (2010).
Since the mid-1990s, right after the implementation of the North American Free Trade Agreement (NAFTA) and the currency crisis in 1995, inequality has been on a downward path. In 2005 the Gini coefficient came back to more or less the same level it had in 1984. Why did inequality rise so sharply during the period of crisis and structural reforms? How much were policy reforms responsible for such increase?
Between 1984 and 1994 there was a significant increase in the skill premium and changes in the structure of employment (towards wage employment) and labor-supply
30
Parts of this section come from Esquivel, Lustig and Scott (2010). The indicators presented here are calculated using the Household Income Expenditure Surveys for various years.
31
(female participation rose by 8 percentage points). There was also an increase in average educational attainment and an equalization of its distribution: average years of schooling increased from 5.6 to 6.9 years and the Gini coefficient for the distribution of years of education fell from 0.42 to 0.37. In 1984, 48 percent of the population had no education or had not completed primary school. That figure went down to 38 percent in 1994.
Legovini, Bouillon, and Lustig (2005) analyze the contribution of these changes to the increase in inequality by applying a microsimulation model. The results of the decomposition exercise at the household level reveals that the increase in (relative) returns to higher education accounted for close to 25 percent of the increase in the Gini for household per capita income observed between 1984 and 1994. Growing disparities in returns between rural and urban areas accounted for 19 percent of the change in the Gini coefficient. Paradoxically, a more equal distribution of years of schooling was unequalizing: according to the microsimulation exercise it accounted for 15 percent of the increase in the Gini. This effect, found in several other countries, has been called by Bourguignon, Ferreira and Lustig (2005) the “paradox of progress.” It is a consequence of the fact that when returns to
education are convex, the relationship between inequality of education and income inequality has the shape of an inverted U: as education inequality falls, income inequality rises initially and then starts to fall.32
Why did skill premia rise?33 Hanson and Harrison (1995) found that trade liberalization had an unequalizing effect but its contribution was modest: around 23 percent of the increase in the wage gap by skill can be attributed to that factor. Revenga (1997) also found that trade liberalization in Mexico was unequalizing for labor earnings. One explanation for this effect is that, unlike Brazil, the sectors that were protected the most prior to trade liberalization were intensive in low-skilled workers. Nicita (2004) found that when taking into account the impact on purchasing power because of lower prices for consumption goods all income groups benefit from trade liberalization but the benefit rises with income. Other authors emphasize the role of an increase in the demand for skilled workers associated with the presence of foreign investment (Feenstra and Hanson 1997), a skill-biased technological change (Cragg and Epelbaum 1996 and Esquivel and Rodríguez-López 2003), and a process of quality-upgrading due to an increase in exports (Verhoogen 2008). All these forces are not mutually exclusive but it is difficult to establish which ones were predominant. Just as in the
32
For the mathematical explanation of this property see Bourguignon, Ferreira and Lustig (2005), chapter 10, p. 396.
33
case of Argentina, the direct effect of trade liberalization was modest but the indirect effect of openness on skills upgrading appears to have been much more substantial.
The divergence in conditions between rural and urban areas was another factor which accounted for the increase in household per capita income inequality. Between 1984 and 1994 agricultural workers suffered a severe decline in real income—around 45 percent—as a result of terms of trade reversals in their principal crops, including coffee and cocoa, and the elimination of agricultural subsidies and price support schemes. Self-selection in migration also contributed to the fallout for rural economies: the most entrepreneurial workers may have moved to the city, leaving behind those least able to adjust to changing rural conditions.
After theperiod of rising inequality in the 1980’s and early 1990s, Mexico’s income
inequality has been falling since the mid-1990s. Between 1994 and 2006, Mexico’s Gini coefficient fell from 0.564 to 0.506.34The incomes of the bottom 20 percent grew more than twice than the incomes of the top ten percent. The faster growth of incomes at the bottom of the distribution happened during a period of lackluster aggregate economic growth. After the 1995 peso crisis, when GDP contracted by around 8 percent, the economy quickly recovered.
Between 1996 and 2000 Mexico’s per capita GDP grew at a rate of 4 percent per year.
However, between 2000 and 2006, growth slowed down significantly; per capita GDP grew at only 1 percent per year. Mexico experienced a period of slow pro-poor growth.
The decline in inequality coincided with the implementation of NAFTA in 1994 and with a shift in government spending patterns. Since the early 1990s, public spending on education, health and nutrition became more progressive. Also, in 1997 the Mexican government launched the conditional cash transfer program Progresa (later called Oportunidades), a large-scale anti-poverty program which reaches around 5 million poor households. These changes made the post-fiscal income distribution less unequal, re-enforcing the trend followed by income inequality shown above.
Esquivel, Lustig and Scott (2010) analyze the proximate determinants of the decline in income inequality between 1994 and 2006. Using nonparametric decomposition methods and standard benefit-incidence analysis, the authors examine the roles played by changes in the distribution of labor income, demographics, and government transfers in accounting for the decline in inequality. The results suggest that the increase in the proportion of adults and of working adults was equalizing but the impact was modest compared to the equalizing effects of changes in the distribution of labor and non-labor income.
34
What has caused the distribution of labor income per working adult to change from being an unequalizing factor in 1994 to an equalizing one thereafter? Hours worked changed very little; in fact, they fell slightly for the bottom quintiles, an inequality-increasing change. Changes in relative hourly wages, in contrast, caused the distribution of labor income per working adult to change from unequalizing to equalizing. The distribution of the stock of education in the labor force became more equal too. The combined effect of a fall in the returns to education and the decline in inequality in educational attainment35 was a reduction in labor income inequality. It is not clear whether the fall in the skilled/unskilled wage gap was the result of demand-side or supply-side factors. Several studies have looked at the demand-side factors emphasizing, among other things, the increasing integration of manufacturing production between the United States and Mexico, and its resulting increase in demand for low-skilled workers in Mexico. However, an examination of the changes in the composition of the labor force by education and experience and the corresponding relative wages suggests that supply-side factors must have been important too.
The reduction in the relative supply of workers with low levels of skills (measured by school attainment) might be associated with changes in public spending on education combined with the effects of the conditional cash transfer program Progresa/Oportunidades which tied monetary transfers to keeping children of poor households in school. Public spending on education in the 1970s and 1980s was heavily biased towards higher education. This changed in the 1990s: the relative ratio of spending per student in tertiary vs. primary education in Mexico declined from a historical maximum of 12 in 1983-1988, to less than 6 in 1994-2000 (by comparison, the average ratio for high-income OECD countries is close to 2). More resources on the supply-side and the implementation of demand-side subsidies for education through Progresa/Oportunidades changed the incidence of public spending on education from being slightly regressive in 1992 to being progressive in 2006. Hence, the fall in skill premia can be linked to both market factors, which affected the demand for labor by skill, and state action in education spending.
As for the effects of non-labor income, the evidence suggests an increasing equalizing contribution of remittances and transfers over time. Transfers became more equalizing because their share in total income rose and because they became more pro-poor. Although, Procampo had been expanding since its creation in 1994, the lion’s share of the expansion in
households receiving non-labor income was due to the implementation ofProgresa in 1997,
35
which reached 14.8 percent of households in 2006. While Procampo is not a pro-poor transfer; Progresa/Oportunidadesis an example of “redistributive efficiency.” With as little as 0.36 percent of GDP and 4 percent of total redistributive spending, Progresa/Oportunidadesaccounts for 18 percent of the change in the post-transfers Gini.
5.
Concluding remarks
The income distributions in Latin American countries went through two distinct phases in the last three decades. During the 1980s and 1990s they became more concentrated. In several countries (though not in all) the increase in inequality during this period was associated with macroeconomic crises and market-oriented reforms in a context of weak labor institutions and social safety nets.
From the late 1990s/early 2000s income inequality in Latin America has declined. Two main factors appear to be behind this phenomenon: a fall in the earnings gap of skilled/low-skilled workers and an increase in government transfers targeted to the poor. The fall in the earnings gap, in turn, is due to a wide set of factors, including the improved macroeconomic conditions that fostered employment, the petering out of the one-time unequalizing effect in the labor market of some market-oriented reforms in the 1990s, the expansion of coverage in basic education during the last couple of decades, and stronger labor institutions. Probably due to the improved fiscal situation and the increased concern on social issues, most Latin American countries augmented social spending and in particular adopted or expanded conditional cash transfers programs. The evidence suggests that these programs are well targeted on the poor, and are thus highly progressive.
References
Acemoglu, D. (2002). “Technical change, inequality, and the labor market”, Journal of Economic Literature40, 7-72.
Acemoglu, D. (2003). “Patterns of skill premia”, Review of Economic Studies70, 199-230.
Acosta, P. and Gasparini, L. (2007). “Capital accumulation, trade liberalization, and rising wage inequality: the case of Argentina”, Economic Development and Cultural Change, 55 (4), pp. 793-812, July.
Altimir, O. (1987). “Income distribution statistics in Latin America and their reliability.”
Review of Income and Wealth33 (2).
Altimir, O. (1996). “Cambios de la desigualdad y la pobreza en la América Latina.” El Trimestre Económico241 LXI, 1, enero-marzo.
Altimir, O. (2008). “Distribución del ingreso e incidencia de la pobreza a lo largo del ajuste”
Revista de la CEPAL No. 96,December.
Altimir, O. and L. Beccaria(2001). “El persistente deterioro de la distribución del ingreso en
la Argentina.”Desarrollo Económicovol. 40 (160).
Atolia, M. (2007). “Trade liberalization and rising wage inequality in Latin America: Reconciliation with HOS theory”,Journal of International Economics71 (2007) 467–
494.
BADEINSO (2010). Base de Estadísticas e Indicadores Sociales. CEPAL, we bsite.
Barros, R., E. Cardoso, and A. Urani (1993). “Inflation and Unemployment as Determinants of Inequaltiy in Brazil: the 1980s.” Texto para Discussas 298. Rio de Janeiro: IPEA
(April).
Barros, R., M. de Carvalho, and S. Franco (2007). “O papel das Transferências Públicas na
Queda Recente da Desigualdade de Renda Brasileira.” InDesigualdade de Renda no Brasil: uma análise da queda recente, edited by Ricardo Paes de Barros, Miguel Nathan Foguel, and Gabriel Ulyssea, chapter 16, volume 2. Brasília: IPEA.
Barros, R., F. Ferreira, J. Molinas Vega, and J. Saavedra Chanduvi (2009). Measuring Inequality of Opportunities in Latin America and the Caribbean World Bank. Washington, DC: Palgrave Macmillan .
Barros, R., M. Foguel, and G. Ulyssea (2006). Desigualdade de Renda no Brasil: uma análise da queda recente, volume 1. Brasília: IPEA.
Barros, R., M. de Carvalho, S. Franco, and R. Mendonça (2010). “Markets, the State and the Dynamics of Inequality: Brazil’s case study.” In Declining Inequality in Latin America: A Decade of Progress?edited by Luis Felipe López Calva and Nora Lustig, chapter 6. Washington DC: Brookings Institution.
Beccaria, L., and R. Carciofi (1995). "Argentina: Social Policy and Adjustment during the 1980s." In Coping with Austerity: Poverty and Inequality in Latin America, ed. Nora Lustig. Washington , D.C. : Brookings Institution.
Behrman, J., N. Birdsall, and M. Székely (2003). “Economic policy and wage differentials in
BID (1998).América Latina frente a la desigualdad. Banco Interamericano de Desarrollo, Washington, D.C.
Bourguignon, F. and Morrison, C. (2002). Inequality among world citizens: 1820-1992. American Economic Review92 (4), 727-743.
Bourguignon, F., F. Ferreira, and N. Lustig, eds. (2005). The Microeconomics of Income Distribution Dynamics in East Asia and Latin America. Washington, DC: The World Bank/ Oxford University Press.
Card, D. and DiNardo, J. (2006). “The Impact of Technological Change on Low-Wage
Workers: A Review.” In Rebecca M. Blank, Sheldon H. Danziger, and Robert F. Schoeni, editors. Working and Poor: How Economic and Policy Changes Are Affecting Low-Wage Workers(New York: Russell Sage Foundation).
Cornia, G.A. (2009). “What explains the recent decline of income inequality in Latin America?”Mimeo.
Cragg, M., and M. Epelbaum (1996). “Why Has Wage Dispersion Grown in Mexico? Is It the Incidence of Reforms or the Growing Demand for Skills?” Journal of Development Economics51, no. 1.
De Hoyos, R., and N. Lustig (2009). “Liberalización comercial, pobreza y desigualdad: una reseña sobre enfoques metodológicos y la asignatura pendiente.” El Trimestre Económico, Vol. LXXVI (1), no. 302 April-June.
Eberhard, J., and E. Engel (2008). “Decreasing Wage Inequality in Chile.” Background paper prepared for the UNDP Project Markets, the State and the Dynamics of Inequality: How to Advance Inclusive Growth, coordinated by Luis Felipe Lopez-Calva and Nora Lustig. (http://undp.economiccluster-lac.org/).
Engerman, S. and K. Sokoloff (1997), “Factor Endowments, Institutions, and Differential Paths of Growth Among New World Economies,” inHow Latin America FellBehind, ed. by S. Haber, Palo Alto, Cal.: Stanford: 260-304.
Engerman, S., S. Haberand K. Sokoloff (2000), “Institutions, Factor Endowments, andPaths
of Development in the New World,”Journal of Economic Perspectives14, 3: 217-32. Esquivel, G., N. Lustig, and J. Scott (2010). “A Decade of Falling Inequality in Mexico:
Market Forces orState Action?”InDeclining Inequality in Latin America: A Decade of Progress? edited by Luis Felipe López Calva and Nora Lustig, chapter 7. Brookings Institution.
Esquivel, G., and J. Rodríguez-López (2003). “Technology, Trade and Wage Inequality in
Mexico before and after NAFTA.” Journal of Development Economics, 72, pp. 543-565.
Feenstra, R. (1997). “Foreign Direct Investment and Relative Wages: Evidence from Mexico’s Maquiladoras.” Journal of International Economics, 42(3/4), May 1997, 371-393.
Feenstra, R. and G. Hanson (1996). “Foreign Investment, Outsourcing and Relative Wages.”
Ferreira, F., P. Leite and J. Litchfield (2007). “The Rise and Fall of Brazilian Inequality: 1981-2004.”Macroeconomic Dynamics (June): 1-32.
Ferreira, F., P. Leite, and M. Wai-Poi (2007).“Trade Liberalization, Employment Flows, and Wage Inequality in Brazil.” Policy Research Working Paper 4108. Washington: World Bank (http://go.worldbank.org/BWBRP91A50).
Ferreira, F. and M. Ravallion (2009). Poverty and Inequality: The global context.” In Salverda, Nolan and smeeding (2009),The Oxford Handbook of Economic Inequality. Fiszbein, A. and Psacharopoulos, G (1995). “Income Inequality Trends in Latin America in
the1980s.”InCoping with Austerity: Poverty and Inequality in Latin America,edited by Nora Lustig, 71-100. Washington DC: Brookings Institution.
Fiszbein, A., and N. Schady with F. Ferreira, M.Grosh, N. Kelleher, P. Olinto, and E. Skoufias (2009). Conditional Cash Transfers. Reducing Present and Future Poverty. World Bank Policy Research Report.
Galiani, S., and P. Sanguinetti (2003).“The impact of trade liberalization on wage inequality: evidence from Argentina.” Journal of Development Economics, Elsevier, vol. 72 (2), pages 497-513, December.
Galiani, S. and G. Porto (2010). “Trends in tariff reforms and trends in the wage structure.”
(Forthcoming) inReview of Economics and Statistics.
Gasparini, L. (2004). “Different lives: inequality in Latin America and the Caribbean”. In
World Bank (2004). Inequality in Latin America and the Caribbean: Breaking with History?.
Gasparini, L. and G. Cruces (2010). “A Distribution in Motion: The Case of Argentina.” In Declining Inequality in Latin America: A Decade of Progress?, edited by Luis Felipe López Calva and Nora Lustig, chapter 5. Washington, DC: Brookings Institution. Gasparini, L., G. Cruces and L. Tornarolli (2010). “Recent trends in income inequality in
Latin America”Economia, forthcoming 2010.
Gasparini, L., M. Cicowiez and W. Sosa Escudero (2010).Pobreza y desigualdad en América Latina. Conceptos, herramientas y aplicaciones. Mimeo. CEDLAS-UNLP.
Goldberg, P., and N. Pavcnik (2007). “Distributional effects of globalization in developing
countries.”Journal of Economic Literature,XLV (1), March, 39-82.
Gray Molina, G., and E. Yañez (2009). “The Dynamics of Inequality in the Best and Worst Times, Bolivia 1997-2007.” Discussion paper prepared for the UNDP Project
Markets, the State and the Dynamics of Inequality: How to Advance Inclusive Growth, coordinated by Luis Felipe Lopez-Calva and Nora Lustig. (http://undp.economiccluster-lac.org/).
Groisman, F. andMarshall, A. (2005). “Determinantes del grado de desigualdad salarial en la Argentina: un estudio interurbano”,Desarrollo Económicovol. 45 (178).
Hanson, G., and A. Harrison (1995). “Trade, Technology, and Wage Inequality in Mexico.”
NBER Working Paper 5110. National Bureau of Economic Research, Cambridge, Mass.
Jaramillo, M., and J. Saavedra (2010). “Inequality in Post-Structural Reform Peru: The Role
of Market and Policy Forces.” InDeclining Inequality in Latin America: A Decade of Progress?, edited by Luis Felipe López-Calva and Nora Lustig, chapter 8. Washington, DC: Brookings Institution. (http://undp.economiccluster-lac.org/). Legovini, A., C. Bouillon, and N. Lustig (2005). “Can Education Explain Changes in Income
Inequality in Mexico?” Chap. 8 in Bourguignon, François, Francisco Ferreira, and Nora Lustig, eds. 2005. The Microeconomics of Income Distribution Dynamics in East Asia and Latin America. Washington: World Bank and Oxford University Press.
Londoño, J. and M. Székely (2000). “Persistent Poverty and Excess Inequality: Latin
America, 1970-1995.”Journal of Applied Economics(May) no. 1: 93-134.
López-Calva, L. and N. Lustig (2010). Declining Inequality in Latin America: A Decade of Progress?Washington, DC: Brookings Institution.
Lustig, N. and M. Székely (1997). México: evolución económica, pobreza y desigualdad. Technical Study, Sustainable Development Department. Washington, D.C.: Inter-American Development Bank.
Lustig, N. (1995). Coping with Austerity: Poverty and Inequality in Latin America. Washington, DC: Brookings Institution.
___. 2000. “Crises and the Poor: Socially Responsible Macroeconomics.” Economía, The Journal of the Latin American and Caribbean Economic Association 1(Fall) no. 1: 1-45.
Maurizio, R. (2001). “Demanda de trabajo, sobreeducación y distribución del ingreso”,
presented at the V Congreso Nacional de Estudios del Trabajo, Argentina.
Morley, S (1995). “Structural Adjustment and Determinants of Poverty in Latin America.”In Coping with Austerity: Poverty and Inequality in Latin America, edited by Nora Lustig, 42-70. Washington DC: The Brookings Institution.
Morley, S. (2001).The income distribution problem in Latin America and the Caribbean. CEPAL, Santiago, Chile.
Psacharopoulos, G., et al. (1992). “Poverty and Income Distribution in Latin America: The Story of the 1980s.” Latin America and the Caribbean Technical Department Regional Studies Program Report 27. Washington DC: World Bank.
Revenga, A. (1997). “Employment and Wage Effects of Trade Liberalization: The Case of
Mexican Manufacturing.”Journal of Labor Economics15, vol. 3, 20-43.
Robinson, J. and Sokoloff, K. (2004). Historical roots of Latin American inequality. In World Bank (2004).Inequality in Latin America and the Caribbean: Breaking with History?. Sánchez-Páramo, C. and Schady, N. (2003). “Off and running? Technology, trade and rising
demand for skilled workers in Latin America”, background paper for the report “Closing the gap in education and technology in Latin America, background paper”,
Office of the Chief Economist for Latin America, The World Bank.
SEDLAC (2010). Socioeconomic Database for Latin America and the Caribbean. CEDLAS and the World Bank, web site.
WIDER (2007). UNU/WIDER World Income Inequality Database.
World Bank (1994) “Poverty Alleviation and Social Investment Funds: The Latin American
World Bank (2004).Inequality in Latin America and the Caribbean: Breaking with History?, The World Bank.
World Bank (2006). World Development Report 2006: Equity and Development. The World Bank, Washington D.C.
Verhoogen, E. (2008). “Trade, Quality Upgrading, and Wage Inequality in the Mexican Manufacturing Sector.”The Quarterly Journal of Economics, MIT Press, vol. 123(2), pages 489-530.
Vos, Rob, Ganuza, E., Morley, S., and Robinson, S. (eds.). 2006. Who Gains from Free Trade? Export-led Growth, Inequality and Poverty in Latin America. Routledge, London and New York.
Williamson, J. (2009). Five centuries of Latin America inequality. NBER Working paper 15305.
Yeaple, S. (2005). “A simple model of firm heterogeneity, international trade and wages”,