Density and viscosity measurements of aqueous amines at high pressures: DEA-water,
DMAE-water and TEA-water mixtures
Eduardo I. Concepcióna,b, Ángel Gómez-Hernándeza, M. Carmen Martína, José J. Segoviaa,*
a
TERMOCAL Research Group, Escuela de Ingenierías Industriales, Universidad de Valladolid, Paseo del Cauce 59, 47011 Valladolid, Spain.
b
Universidad Tecnológica de Panamá, Panamá, Panama.
*
corresponding author, e-mail: [email protected]
Keywords: Viscosity; Density; High pressure; DEA (diethanolamine); TEA (triethanolamine); DMAE (2-dimethylaminoethanol)
Abstract
In this paper, density and viscosity measurements at pressures up to 140 MPa are presented in a temperature range from (293.15 to 393.15) K for diethanolamine (DEA) + water,
triethanolamine (TEA) + water and 2-dimethylaminoethanol (DMAE) + water in amine weight concentrations from 10% to 40%. Densities were measured using a vibrating tube densimeter (Anton Paar DMA HPM) with an expanded uncertainty (k = 2) less than ± 0.7 kg·m-3. Viscosity measurements were obtained using a falling body viscometer which was calibrated with water and dodecane. The viscosity expanded uncertainty (k = 2) ranges from ± 2.5% for the highest viscosity to ± 3.2% for the lowest.
1. Introduction
methane, NOX, SOX etc. Carbon dioxide (CO2) is one of the most important greenhouse gases
(GHG) which is responsible for about 70% of the enhanced greenhouse effect and global warming [1]. Many solutions are focused on removing carbon dioxide from exhaust gases. Post-combustion CO2 capture technology is the most mature solution which is based on
absorption through chemical absorbents. Absorption with amine-based solvents has been extensively studied and regarded as the most effective technology for CO2 capture [2].
From the industrial point of view, alkanolamines such as diethanolamine (DEA),
triethanolamine (TEA), and 2-(dimethylamino)ethanol (DMAE) have been widely used to remove acid gases in industrial processes [3]. The process to capture carbon dioxide using a chemical absorbent consists of an absorber and a stripper, and solubility of carbon dioxide in aqueous alkanolamine solutions, density and viscosity are key data for the design of CO2
removal process.
The objective of this work is to measure density and viscosity, at temperatures from (313.15 to 393.15) K and pressures from (0.1 to 100) MPa, of aqueous solutions of DEA, TEA and DMAE at mass fractions from 0.1 to 0.4. Both properties are correlated as a function of temperature and pressure using empirical equations.
2. Experimental
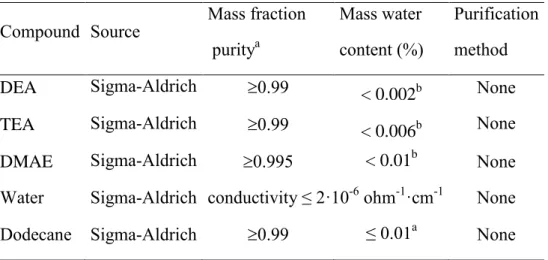
2.1. Materials
Table 1. Material description.
Compound Source Mass fraction puritya
Mass water
content (%)
Purification
method
DEA Sigma-Aldrich 0.99 < 0.002b None
TEA Sigma-Aldrich 0.99 < 0.006b None
DMAE Sigma-Aldrich 0.995 < 0.01b None
Water Sigma-Aldrich conductivity ≤ 2·10-6 ohm-1·cm-1 None
Dodecane Sigma-Aldrich 0.99 ≤ 0.01a None
a
as stated by the supplier by gas chromatography
b
measured by Karl Fisher titration (Mitsubishi CA-200)
2.2. Apparatus and procedure
Densities were obtained using a vibrating tube densimeter (Anton Paar DMAHPM) calibrated with toluene and vacuum which was previously described in [4]. This model is able to
measure density in a range from (0 to 3000) kg·m-3 with a resolution of 10-2 kg·m-3. The uncertainty calculations were performed following the guide to the expression of uncertainty in measurement JCGM100: 2008 [5] and the procedure was explained in [4], obtaining an expanded uncertainty (k = 2) less than ±0.7 kg·m-3.
The operation principle of the equipment is based on the combination of Stokes' law of a falling body through a fluid, and Newton's second law. Such behaviour is theoretically described by Eq. (1):
(1)
where is the viscosity, K(p,T) is a calibration constant which depends on the geometry of
the equipment and is considered a function of pressure and temperature, is the difference
between body density and the liquid density, and t is the fall time.
The equipment requires a calibration procedure because in practice the actual behaviour differs from the simplified model expressed in Eq. (1) in several factors [7, 8]. Various
calibration procedures have been successfully used [8] which are based on the use of a known viscosity reference fluid under (p,T) conditions in which the viscosity is sought, obtaining K(p,T) for each.
In our case, the model described by Eq. (1) is adjusted to viscosities up to 4.9 mPa·s (approximately). However, the addition of an independent term to Eq (1) allows a better approximation to the behaviour of our viscometer and therefore, it is modified to obtain the expression (2):
(2)
This Eq. (2) was successfully used previously in [9], and offers the advantage of providing viscosities at any pressure and temperature condition, within measuring calibration range, through a single adjustment.
The experimental setup was entirely developed in the TERMOCAL laboratory and described in [9,10].
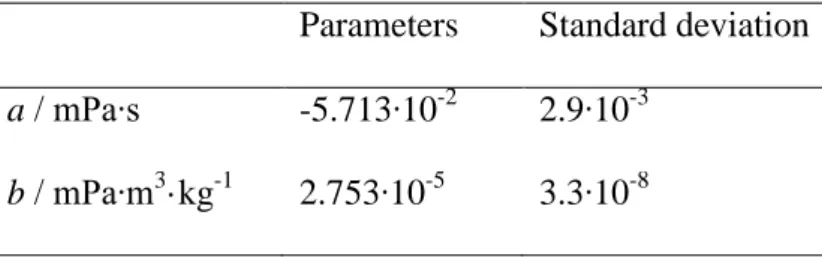
Fall time was recorded considering fifteen repetitions for each pressure and temperature. After that, calibration consists of fitting all points using the model expressed by Eq. (2), whose parameters are given in Table 2.
Table 2. Coefficients of Eq. (2) obtained for the falling body viscometer calibration. Parameters Standard deviation
a / mPa∙s -5.713∙10-2 2.9∙10-3 b / mPa∙m3·kg-1 2.753∙10-5 3.3∙10-8
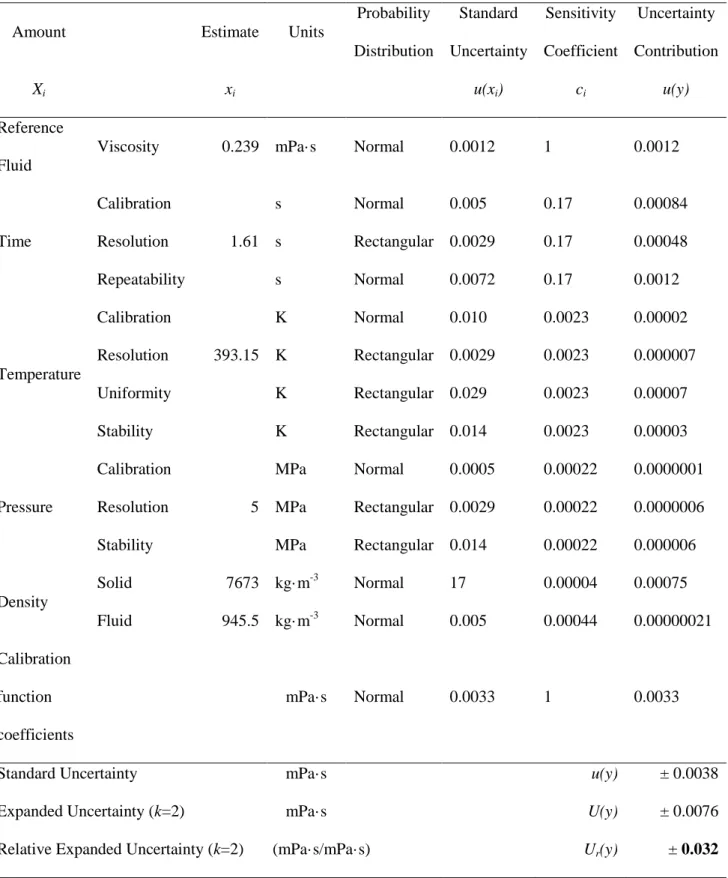
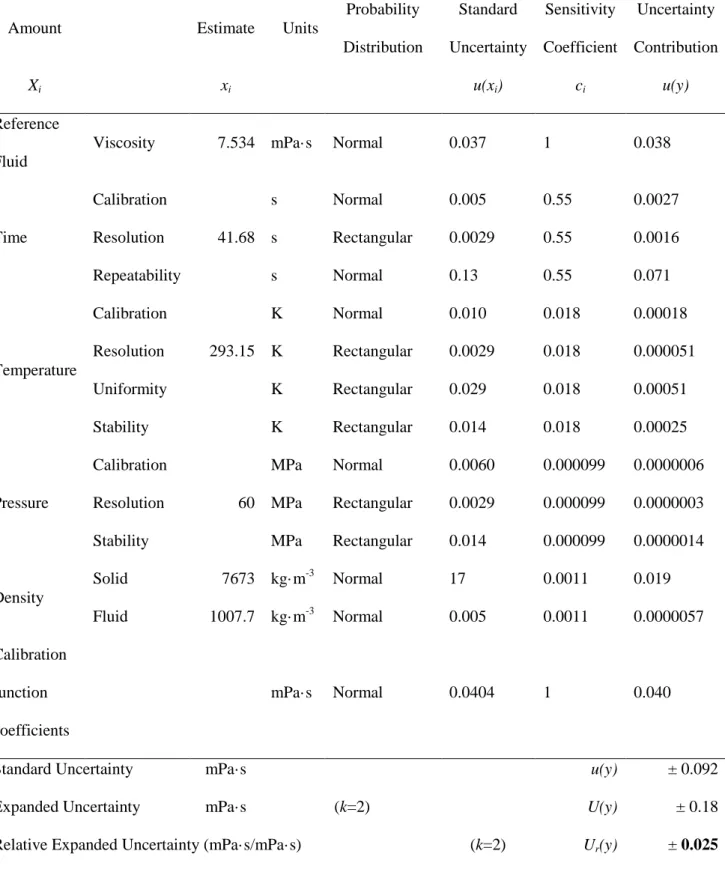
Uncertainty calculation was carried out following the model expressed by Eq. (2) and the procedure described in JCGM 100:2008 [5] and its results are presented in Tables 3 and 4 [11]. Uncertainty was evaluated at the limits of the viscosity calibration range for the studied mixtures: the lowest viscosity is 0.260 mPa·s for water at T = 393.15 K and p = 5 MPa, and the highest viscosity is 7.591 mPa·s for aqueous DMAE solution (w = 0.4) at T = 293.15 K and p = 60 MPa. A normal distribution was considered with a coverage factor k = 2
Table 3. Uncertainty calculation of dynamic viscosity, η, for water at p = 5 MPa and T =
393.15 K.
Amount Estimate Units
Probability
Distribution
Standard
Uncertainty
Sensitivity
Coefficient
Uncertainty
Contribution
Xi xi u(xi) ci u(y)
Reference
Fluid
Viscosity 0.239 mPa·s Normal 0.0012 1 0.0012
Time
Calibration s Normal 0.005 0.17 0.00084
Resolution 1.61 s Rectangular 0.0029 0.17 0.00048
Repeatability s Normal 0.0072 0.17 0.0012
Temperature
Calibration K Normal 0.010 0.0023 0.00002
Resolution 393.15 K Rectangular 0.0029 0.0023 0.000007
Uniformity K Rectangular 0.029 0.0023 0.00007
Stability K Rectangular 0.014 0.0023 0.00003
Pressure
Calibration MPa Normal 0.0005 0.00022 0.0000001
Resolution 5 MPa Rectangular 0.0029 0.00022 0.0000006
Stability MPa Rectangular 0.014 0.00022 0.000006
Density
Solid 7673 kg·m-3 Normal 17 0.00004 0.00075 Fluid 945.5 kg·m-3 Normal 0.005 0.00044 0.00000021 Calibration
function
coefficients
mPa·s Normal 0.0033 1 0.0033
Standard Uncertainty mPa·s u(y) ± 0.0038
Expanded Uncertainty (k=2) mPa·s U(y) ± 0.0076
Table 4. Uncertainty calculation of dynamic viscosity, η, for DMAE (w1 = 0.4) + H2O at p =
60 MPa and T = 293.15 K.
Amount Estimate Units
Probability
Distribution
Standard
Uncertainty
Sensitivity
Coefficient
Uncertainty
Contribution
Xi xi u(xi) ci u(y)
Reference
Fluid
Viscosity 7.534 mPa·s Normal 0.037 1 0.038
Time
Calibration s Normal 0.005 0.55 0.0027
Resolution 41.68 s Rectangular 0.0029 0.55 0.0016
Repeatability s Normal 0.13 0.55 0.071
Temperature
Calibration K Normal 0.010 0.018 0.00018
Resolution 293.15 K Rectangular 0.0029 0.018 0.000051
Uniformity K Rectangular 0.029 0.018 0.00051
Stability K Rectangular 0.014 0.018 0.00025
Pressure
Calibration MPa Normal 0.0060 0.000099 0.0000006
Resolution 60 MPa Rectangular 0.0029 0.000099 0.0000003
Stability MPa Rectangular 0.014 0.000099 0.0000014
Density
Solid 7673 kg·m-3 Normal 17 0.0011 0.019 Fluid 1007.7 kg·m-3 Normal 0.005 0.0011 0.0000057 Calibration
function
coefficients
mPa·s Normal 0.0404 1 0.040
Standard Uncertainty mPa·s u(y) ± 0.092
Expanded Uncertainty mPa·s (k=2) U(y) ± 0.18
3. Results and discussion
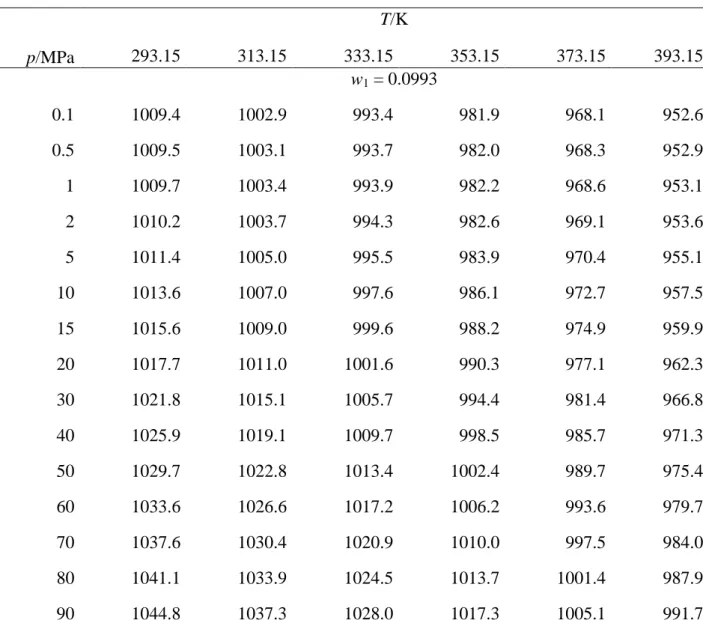
Density measurements of aqueous solutions of diethanolamine (DEA), triethanolamine (TEA) and 2-dimethylaminoethanol (DMAE) were carried out at pressures from (0.1 to 140) MPa and at six temperatures ranging between (293.15 and 393.15) K for amine mass fractions of 0.1, 0.2, 0.3 and 0.4. The experimental results are shown in Tables 5, 6 and 7, respectively.
Table 5. Experimental densities, ρ, for DEA (1) + H2O (2) mixtures at different conditions of
temperature, T, pressure, p, and mass fraction, w1.a
ρ/kg·m-3
T/K
p/MPa 293.15 313.15 333.15 353.15 373.15 393.15
w1 = 0.0993
0.1 1009.4 1002.9 993.4 981.9 968.1 952.6
0.5 1009.5 1003.1 993.7 982.0 968.3 952.9
1 1009.7 1003.4 993.9 982.2 968.6 953.1
2 1010.2 1003.7 994.3 982.6 969.1 953.6
5 1011.4 1005.0 995.5 983.9 970.4 955.1
10 1013.6 1007.0 997.6 986.1 972.7 957.5
15 1015.6 1009.0 999.6 988.2 974.9 959.9
20 1017.7 1011.0 1001.6 990.3 977.1 962.3
30 1021.8 1015.1 1005.7 994.4 981.4 966.8
40 1025.9 1019.1 1009.7 998.5 985.7 971.3
50 1029.7 1022.8 1013.4 1002.4 989.7 975.4
60 1033.6 1026.6 1017.2 1006.2 993.6 979.7
70 1037.6 1030.4 1020.9 1010.0 997.5 984.0
80 1041.1 1033.9 1024.5 1013.7 1001.4 987.9
100 1048.5 1040.9 1031.5 1020.9 1008.8 995.5
110 1051.9 1044.4 1034.9 1024.4 1012.4 999.4
120 1055.4 1047.7 1038.4 1027.8 1015.9 1003.1
130 1059.0 1051.1 1041.7 1031.1 1019.4 1006.6
140 1062.2 1054.4 1045.0 1034.4 1022.7 1010.1
w1 = 0.2000
0.1 1021.6 1014.3 1004.2 992.4 978.3 962.8
0.5 1021.7 1014.4 1004.4 992.5 978.6 963.2
1 1021.9 1014.6 1004.6 992.7 978.8 963.3
2 1022.3 1015.0 1005.0 993.1 979.3 963.8
5 1023.5 1016.2 1006.2 994.4 980.6 965.2
10 1025.5 1018.2 1008.2 996.5 982.8 967.7
15 1027.4 1020.1 1010.2 998.6 985.0 969.9
20 1029.4 1022.0 1012.1 1000.6 987.2 972.3
30 1033.3 1025.8 1016.0 1004.7 991.5 976.8
40 1037.0 1029.7 1020.0 1008.5 995.6 981.3
50 1040.7 1033.2 1023.6 1012.4 999.5 985.4
60 1044.4 1036.9 1027.1 1016.3 1003.5 989.6
70 1048.0 1040.4 1030.8 1019.8 1007.3 993.8
80 1051.4 1043.8 1034.2 1023.4 1011.1 997.6
90 1054.9 1047.1 1037.5 1026.9 1014.7 1001.5
100 1058.4 1050.6 1041.0 1030.4 1018.3 1005.2
110 1061.6 1053.9 1044.2 1033.8 1021.9 1008.9
120 1064.9 1057.1 1047.7 1037.1 1025.3 1012.6
130 1068.3 1060.3 1050.9 1040.5 1028.7 1016.1
140 1071.4 1063.5 1054.1 1043.6 1032.0 1019.5
0.1 1034.5 1026.0 1015.4 1003.0 988.7 972.9
0.5 1034.7 1026.2 1015.5 1003.1 988.9 973.2
1 1034.8 1026.4 1015.7 1003.4 989.2 973.4
2 1035.2 1026.7 1016.2 1003.7 989.6 973.9
5 1036.3 1027.9 1017.3 1005.0 990.9 975.3
10 1038.2 1029.7 1019.3 1007.1 993.2 977.7
15 1040.0 1031.6 1021.2 1009.1 995.3 980.0
20 1041.8 1033.4 1023.1 1011.1 997.4 982.4
30 1045.4 1037.1 1026.9 1015.1 1001.6 986.9
40 1049.0 1040.7 1030.6 1018.9 1005.7 991.2
50 1052.5 1044.1 1034.1 1022.6 1009.5 995.3
60 1055.9 1047.6 1037.7 1026.4 1013.4 999.4
70 1059.3 1051.0 1041.1 1029.9 1017.2 1003.6
80 1062.5 1054.3 1044.4 1033.4 1020.9 1007.3
90 1065.8 1057.5 1047.7 1036.8 1024.4 1011.2
100 1069.1 1060.8 1051.1 1040.1 1028.0 1014.8
110 1072.1 1063.9 1054.3 1043.5 1031.5 1018.5
120 1075.3 1067.1 1057.5 1046.8 1034.9 1022.1
130 1078.5 1070.2 1060.6 1050.0 1038.2 1025.5
140 1081.4 1073.3 1063.7 1053.1 1041.5 1029.1
w1 = 0.3997
0.1 1047.5 1038.0 1026.6 1013.9 999.2 983.2
0.5 1047.7 1038.2 1026.8 1014.0 999.4 983.5
1 1047.9 1038.4 1027.0 1014.2 999.6 983.7
2 1048.2 1038.7 1027.4 1014.5 1000.1 984.2
5 1049.3 1039.8 1028.5 1015.8 1001.4 985.6
15 1052.8 1043.4 1032.3 1019.8 1005.7 990.3
20 1054.5 1045.1 1034.2 1021.8 1007.8 992.7
30 1058.0 1048.7 1037.8 1025.7 1012.0 997.1
40 1061.4 1052.3 1041.6 1029.4 1016.0 1001.4
50 1064.7 1055.6 1045.0 1033.0 1019.8 1005.4
60 1068.0 1059.0 1048.4 1036.7 1023.6 1009.6
70 1071.2 1062.2 1051.8 1040.2 1027.3 1013.6
80 1074.3 1065.4 1055.0 1043.6 1031.0 1017.3
90 1077.4 1068.5 1058.2 1047.0 1034.5 1021.2
100 1080.6 1071.6 1061.5 1050.4 1038.0 1024.8
110 1083.5 1074.7 1064.6 1053.6 1041.4 1028.5
120 1086.5 1077.7 1067.8 1056.8 1044.8 1032.0
130 1089.6 1080.7 1070.8 1060.0 1048.1 1035.4
140 1092.4 1083.6 1074.0 1063.0 1051.3 1038.9
a
Standard uncertainties (k=1): u(T) = 0.01 K; ur(p) = 0.0001; u(w) = 0.0001 and u() = 0.35
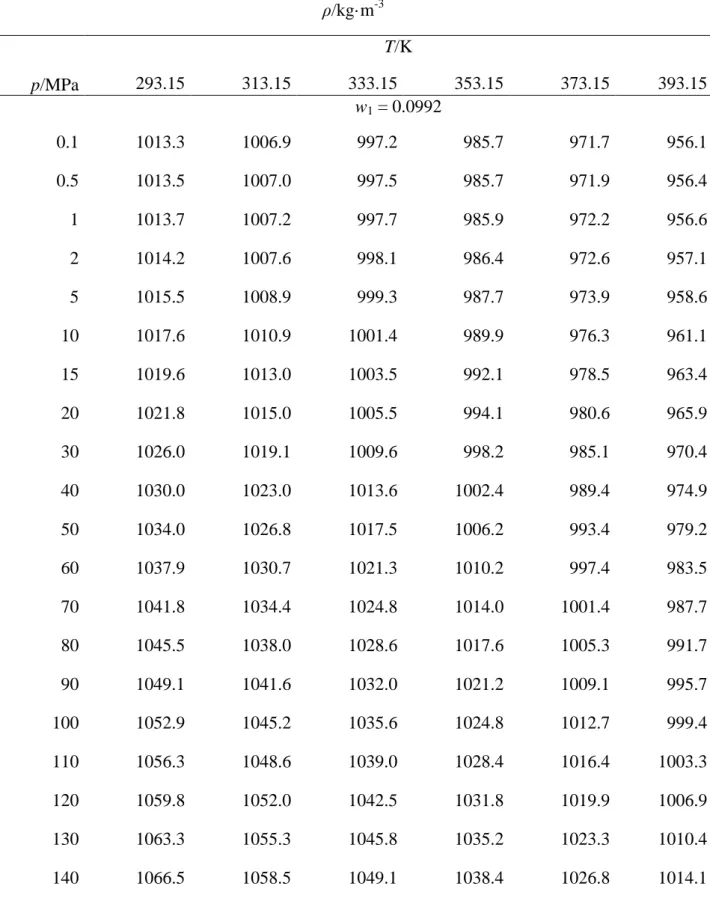
Table 6. Experimental densities, ρ, for TEA (1) + H2O (2) mixtures at different conditions of
temperature, T, pressure, p, and mass fraction, w1.a
ρ/kg·m-3
T/K
p/MPa 293.15 313.15 333.15 353.15 373.15 393.15
w1 = 0.0992
0.1 1013.3 1006.9 997.2 985.7 971.7 956.1
0.5 1013.5 1007.0 997.5 985.7 971.9 956.4
1 1013.7 1007.2 997.7 985.9 972.2 956.6
2 1014.2 1007.6 998.1 986.4 972.6 957.1
5 1015.5 1008.9 999.3 987.7 973.9 958.6
10 1017.6 1010.9 1001.4 989.9 976.3 961.1
15 1019.6 1013.0 1003.5 992.1 978.5 963.4
20 1021.8 1015.0 1005.5 994.1 980.6 965.9
30 1026.0 1019.1 1009.6 998.2 985.1 970.4
40 1030.0 1023.0 1013.6 1002.4 989.4 974.9
50 1034.0 1026.8 1017.5 1006.2 993.4 979.2
60 1037.9 1030.7 1021.3 1010.2 997.4 983.5
70 1041.8 1034.4 1024.8 1014.0 1001.4 987.7
80 1045.5 1038.0 1028.6 1017.6 1005.3 991.7
90 1049.1 1041.6 1032.0 1021.2 1009.1 995.7
100 1052.9 1045.2 1035.6 1024.8 1012.7 999.4
110 1056.3 1048.6 1039.0 1028.4 1016.4 1003.3
120 1059.8 1052.0 1042.5 1031.8 1019.9 1006.9
130 1063.3 1055.3 1045.8 1035.2 1023.3 1010.4
140 1066.5 1058.5 1049.1 1038.4 1026.8 1014.1
0.1 1029.5 1021.9 1011.6 999.5 985.1 969.2
0.5 1029.5 1022.1 1011.8 999.6 985.3 969.5
1 1029.7 1022.3 1012.0 999.8 985.5 969.7
2 1030.2 1022.7 1012.4 1000.1 986.1 970.2
5 1031.4 1023.9 1013.6 1001.5 987.4 971.7
10 1033.4 1025.9 1015.7 1003.7 989.7 974.2
15 1035.4 1027.8 1017.7 1005.8 991.9 976.5
20 1037.4 1029.7 1019.7 1007.8 994.0 978.9
30 1041.4 1033.7 1023.6 1011.9 998.4 983.5
40 1045.2 1037.6 1027.7 1015.9 1002.6 988.0
50 1049.0 1041.2 1031.4 1019.8 1006.7 992.3
60 1052.7 1044.9 1035.0 1023.7 1010.6 996.5
70 1056.4 1048.5 1038.6 1027.4 1014.5 1000.7
80 1059.8 1051.9 1042.1 1031.1 1018.5 1004.6
90 1063.4 1055.3 1045.6 1034.5 1022.1 1008.6
100 1066.9 1058.8 1049.1 1038.1 1025.7 1012.3
110 1070.2 1062.1 1052.3 1041.5 1029.4 1016.1
120 1073.6 1065.6 1055.8 1044.9 1032.9 1019.8
130 1077.0 1068.7 1059.0 1048.2 1036.2 1023.4
140 1080.1 1071.9 1062.4 1051.5 1039.7 1026.9
w1 = 0.2991
0.1 1046.1 1037.4 1026.3 1013.6 999.2 982.9
0.5 1046.2 1037.5 1026.5 1013.7 999.3 983.3
1 1046.4 1037.7 1026.7 1013.9 999.6 983.5
2 1046.8 1038.1 1027.2 1014.3 1000.1 984.0
10 1049.8 1041.2 1030.4 1017.8 1003.8 988.0
15 1051.7 1043.1 1032.4 1019.9 1006.0 990.3
20 1053.7 1045.0 1034.3 1021.9 1008.2 992.7
30 1057.4 1048.8 1038.2 1025.9 1012.5 997.3
40 1061.1 1052.6 1042.1 1029.9 1016.8 1001.8
50 1064.7 1056.1 1045.7 1033.8 1020.7 1006.0
60 1068.3 1059.7 1049.4 1037.6 1024.6 1010.2
70 1071.8 1063.2 1052.9 1041.2 1028.4 1014.4
80 1075.1 1066.6 1056.3 1044.8 1032.4 1018.3
90 1078.5 1069.9 1059.7 1048.3 1036.0 1022.3
100 1081.8 1073.3 1063.2 1051.8 1039.5 1026.1
110 1084.9 1076.4 1066.3 1055.2 1043.1 1029.8
120 1088.2 1079.6 1069.8 1058.5 1046.8 1033.4
130 1091.5 1082.8 1072.9 1061.8 1050.1 1036.9
140 1094.5 1085.9 1076.0 1065.0 1053.4 1040.5
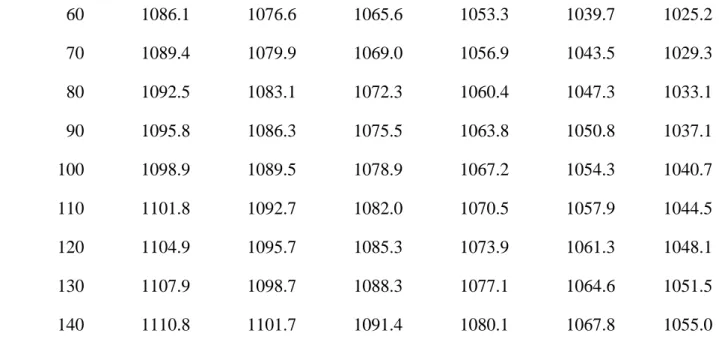
w1 = 0.4000
0.1 1065.2 1055.1 1043.1 1029.7 1014.6 998.1
0.5 1065.3 1055.3 1043.3 1029.8 1014.8 998.5
1 1065.4 1055.4 1043.5 1030.0 1015.0 998.6
2 1065.8 1055.8 1043.9 1030.4 1015.5 999.1
5 1066.9 1056.9 1045.1 1031.7 1016.8 1000.6
10 1068.7 1058.8 1047.1 1033.9 1019.1 1003.1
15 1070.5 1060.6 1049.0 1035.8 1021.2 1005.4
20 1072.3 1062.4 1050.9 1037.9 1023.4 1007.8
30 1075.8 1066.0 1054.7 1041.9 1027.7 1012.4
40 1079.3 1069.7 1058.4 1045.8 1032.0 1016.7
60 1086.1 1076.6 1065.6 1053.3 1039.7 1025.2
70 1089.4 1079.9 1069.0 1056.9 1043.5 1029.3
80 1092.5 1083.1 1072.3 1060.4 1047.3 1033.1
90 1095.8 1086.3 1075.5 1063.8 1050.8 1037.1
100 1098.9 1089.5 1078.9 1067.2 1054.3 1040.7
110 1101.8 1092.7 1082.0 1070.5 1057.9 1044.5
120 1104.9 1095.7 1085.3 1073.9 1061.3 1048.1
130 1107.9 1098.7 1088.3 1077.1 1064.6 1051.5
140 1110.8 1101.7 1091.4 1080.1 1067.8 1055.0
a
Standard uncertainties (k=1): u(T) = 0.01 K; ur(p) = 0.0001; u(w) = 0.0001 and u() = 0.35
kg·m-3
Table 7. Experimental densities, ρ, for DMAE (1) + H2O (2) mixtures at different conditions
of temperature, T, pressure, p, and mass fraction, w1.a
ρ/kg·m-3
T/K
p/MPa 293.15 313.15 333.15 353.15 373.15 393.15
w1 = 0.1005
0.1 994.5 987.4 977.4 965.2 950.7 934.5
0.5 994.7 987.6 977.6 965.3 950.9 934.9
1 994.8 987.8 977.8 965.6 951.2 935.1
2 995.3 988.3 978.2 966.0 951.7 935.6
5 996.5 989.5 979.5 967.3 953.0 937.1
10 998.5 991.5 981.5 969.5 955.4 939.7
15 1000.5 993.4 983.6 971.6 957.7 942.1
30 1006.6 999.4 989.7 978.0 964.4 949.3
40 1010.5 1003.4 993.7 982.0 968.7 953.9
50 1014.3 1007.0 997.3 986.0 972.8 958.2
60 1018.1 1010.8 1001.1 989.9 976.8 962.6
70 1021.8 1014.5 1004.9 993.6 980.9 966.9
80 1025.3 1018.0 1008.4 997.4 984.7 971.0
90 1029.0 1021.4 1012.0 1000.9 988.6 975.0
100 1032.5 1024.9 1015.4 1004.6 992.1 978.8
110 1035.9 1028.3 1018.9 1008.1 995.9 982.7
120 1039.3 1031.6 1022.3 1011.7 999.5 986.5
130 1042.7 1035.0 1025.5 1014.9 1003.0 990.0
140 1045.7 1038.2 1028.8 1018.3 1006.3 993.7
w1 = 0.2020
0.1 992.6 983.2 971.5 958.1 942.4 925.2
0.5 992.7 983.4 971.8 958.1 942.7 925.5
1 992.9 983.6 972.0 958.4 942.9 925.7
2 993.3 984.0 972.4 958.8 943.4 926.3
5 994.4 985.2 973.7 960.1 944.8 927.9
10 996.3 987.2 975.7 962.4 947.2 930.5
15 998.2 989.1 977.7 964.5 949.5 933.0
20 1000.0 990.9 979.7 966.7 951.8 935.6
30 1003.7 994.8 983.7 971.0 956.3 940.5
40 1007.4 998.6 987.7 975.0 960.9 945.2
50 1010.8 1002.1 991.3 978.9 964.9 949.6
60 1014.3 1005.6 995.0 982.7 968.9 954.1
80 1021.1 1012.5 1002.1 990.1 976.9 962.4
90 1024.4 1015.7 1005.4 993.8 980.6 966.6
100 1027.7 1019.1 1008.9 997.3 984.3 970.5
110 1030.8 1022.3 1012.2 1000.7 988.0 974.3
120 1033.9 1025.6 1015.5 1004.1 991.6 978.2
130 1037.2 1028.6 1018.6 1007.5 995.0 981.7
140 1040.1 1031.7 1021.9 1010.8 998.4 985.3
w1 = 0.3005
0.1 990.6 978.8 965.2 950.2 933.3 915.0
0.5 990.7 979.0 965.4 950.3 933.6 915.5
1 990.9 979.2 965.6 950.6 933.9 915.7
2 991.3 979.6 966.1 951.0 934.4 916.3
5 992.4 980.8 967.3 952.4 935.9 917.9
10 994.2 982.7 969.5 954.7 938.4 920.8
15 996.0 984.6 971.5 956.9 940.8 923.4
20 997.8 986.5 973.5 959.1 943.2 926.1
30 1001.4 990.3 977.5 963.4 947.9 931.2
40 1004.9 994.0 981.5 967.5 952.4 936.2
50 1008.2 997.5 985.2 971.6 956.6 940.8
60 1011.6 1001.0 988.9 975.6 960.9 945.3
70 1014.9 1004.4 992.5 979.3 965.0 949.8
80 1018.0 1007.6 996.0 983.0 969.1 953.9
90 1021.2 1010.9 999.2 986.6 972.8 958.1
100 1024.3 1014.1 1002.7 990.1 976.4 962.2
110 1027.2 1017.3 1006.0 993.6 980.3 966.0
120 1030.2 1020.4 1009.3 997.0 983.8 969.9
140 1036.0 1026.4 1015.4 1003.5 990.7 977.2 w1 = 0.3995
0.1 986.6 972.7 957.4 941.1 923.1 903.9
0.5 986.7 972.9 957.6 941.2 923.4 904.3
1 986.9 973.1 957.9 941.4 923.6 904.6
2 987.3 973.5 958.3 941.9 924.2 905.2
5 988.4 974.7 959.6 943.3 925.8 907.0
10 990.3 976.7 961.8 945.8 928.4 910.0
15 992.1 978.6 963.9 948.1 931.1 912.8
20 994.0 980.6 966.0 950.5 933.6 915.7
30 997.5 984.4 970.2 954.9 938.5 921.0
40 1001.0 988.2 974.2 959.2 943.3 926.3
50 1004.4 991.7 977.9 963.3 947.6 931.0
60 1007.7 995.3 981.7 967.5 952.1 935.9
70 1011.0 998.7 985.4 971.2 956.2 940.5
80 1014.1 1002.0 988.9 975.1 960.4 944.8
90 1017.3 1005.3 992.3 978.7 964.3 949.2
100 1020.4 1008.5 995.8 982.4 968.1 953.2
110 1023.2 1011.7 999.0 985.9 971.9 957.3
120 1026.3 1014.7 1002.4 989.3 975.6 961.2
130 1029.2 1017.7 1005.5 992.7 979.1 964.9
140 1031.9 1020.7 1008.7 996.0 982.6 968.9
a
Standard uncertainties (k=1): u(T) = 0.01 K; ur(p) = 0.0001; u(w) = 0.0001 and u() = 0.35
kg·m-3
Density measurements of the amine solutions studied show TEA > DEA > DMAE at the same
solutions are greater as amine weight fraction increases and they are also bigger between DEA and DMAE than TEA and DEA.
As is expected, density increases with pressure and decreases with temperature for all the mixtures, however the effect of amine weight fraction is different.
The density rise due to an increase of pressure from 0.1 MPa to 140 MPa is similar for all the amines and ranges from 4.3% to 6.1% for TEA and DEA solutions, being the lowest increase at w1 = 0.4 and T = 293.15 K and the highest increase at w1 = 0.1 and T = 393.15 K. For
DMEA solutions, the density increase ranges from 4.6% to 7.2% both extreme values at w1 =
0.4 and T = 293.15 K and T = 393.15 K, respectively.
Furthermore, the density decrease when temperature changes from 293.15 K to 393.15 K ranges from 4.9% to 6.3% for TEA aqueous mixtures and from 4.8% to 6.1% for DEA aqueous mixtures, being higher at lower pressures. In the case of DMAE aqueous mixtures, this density decrease varies from 5.0% to 6.0% at w1 = 0.1 and p = 140 MPa and p = 0.1 MPa,
respectively, and from 6.1% to 8.4% at w1 = 0.4 and p = 140 MPa and p = 0.1 MPa,
respectively. Therefore, the effect of temperature is higher at lower pressures and higher amine weight fraction.
Finally, density increases with increasing amine weight fraction for DEA and TEA aqueous solutions but decreases for DMAE aqueous solutions. Comparing for the different amine solutions how is the relative change of density when the composition changes from w1 = 0.1
to w1 = 0.4, the following percentages are obtained: a decrease ranging from 4.0% to 5.1% for
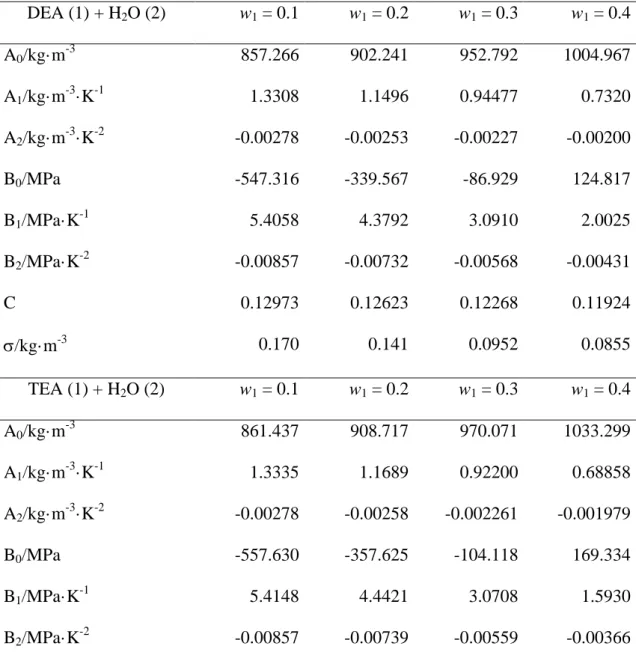
The experimental values were correlated using a modified Tammann–Tait equation (Eq. (3)) for each composition:
MPa T B T B B p T B T B B C T A T A A p T 1 . 0 ln 1 , 2 2 1 0 2 2 1 0 2 2 1 0 (3)The fitting results are shown in Table 8, which contains the adjustable parameters and the standard deviation of the adjustment ().
Table 8. Fitting parameters of Eq. (3) andstandard deviations for the density measurements
DEA (1) + H2O (2) w1 = 0.1 w1 = 0.2 w1 = 0.3 w1 = 0.4
A0/kg·m-3 857.266 902.241 952.792 1004.967
A1/kg·m-3·K-1 1.3308 1.1496 0.94477 0.7320
A2/kg·m-3·K-2 -0.00278 -0.00253 -0.00227 -0.00200
B0/MPa -547.316 -339.567 -86.929 124.817
B1/MPa·K-1 5.4058 4.3792 3.0910 2.0025
B2/MPa·K-2 -0.00857 -0.00732 -0.00568 -0.00431
C 0.12973 0.12623 0.12268 0.11924
/kg·m-3 0.170 0.141 0.0952 0.0855
TEA (1) + H2O (2) w1 = 0.1 w1 = 0.2 w1 = 0.3 w1 = 0.4
A0/kg·m-3 861.437 908.717 970.071 1033.299
A1/kg·m-3·K-1 1.3335 1.1689 0.92200 0.68858
A2/kg·m-3·K-2 -0.00278 -0.00258 -0.002261 -0.001979
B0/MPa -557.630 -357.625 -104.118 169.334
B1/MPa·K-1 5.4148 4.4421 3.0708 1.5930
C 0.12746 0.12533 0.12033 0.11368
/kg·m-3 0.164 0.146 0.130 0.0915
DMAE (1) + H2O (2) w1 = 0.1 w1 = 0.2 w1 = 0.3 w1 = 0.4
A0/kg·m-3 845.842 905.967 978.647 1041.673
A1/kg·m-3·K-1 1.3335 1.0172 0.63224 0.28630
A2/kg·m-3·K-2 -0.00282 -0.00246 -0.00202 -0.00162
B0/MPa -376.874 83.307 427.581 589.461
B1/MPa·K-1 4.5051 1.9517 -0.06778 -1.1043
B2/MPa·K-2 -0.00751 -0.00417 -0.00145 -0.00000733
C 0.12745 0.11819 0.10912 0.10348
/kg·m-3 0.162 0.119 0.0849 0.0881
Experimental densities were compared with literature data available for us and in the same conditions that our measurements (mainly at atmospheric pressure). For aqueous DEA solutions, Rinker et al. [12] measured at w1 = (0.1, 0.2, 0.3) and T = (293.15, 313.15, 333.15,
353.15, 373.15) K, Hsu et al. [13] at w1 = (0.2, 0.3) and T = (313.15, 333.15, 353.15) K,
Tseng et al. [14] at w1 = (0.1 to 0.9) and T = (293.15, 303.15) K, Yang et al. [15] at w1 = (0.1
to 0.9) and T = (283.15 to 353.15) K, Spasojevic et al. [16] measured at w1 = (0.05, 0.1, 0.15,
0.2, 0.25) and T = (298.15 to 343.15) K, Han et al.[17] measured at w1 = (0.3 to 1) and T =
(298.15 to 423.15) K. For aqueous TEA solutions, Tseng et al. [14] measured at w1 = (0.1 to
0.9) and T = (293.15, 303.15) K, Zhao et al. [18] measured at w1 = 0.3 and T = (303.15 to
343.15) K. For aqueous DMAE solutions, Zhang et al. [19] measured at w1 = (0.11, 0.21,
0.31) and T= (293.15, 303.15, 313.15) K, Maham et al. [20] measured at x1 = (0.1 to 0.9) and
353.15) K, Chowdhury et al. [22] at x1 = (0.1 to 0.9) and T = (303.15 to 323.15) K,
Bernal-García et al. [23] measured at x1 = (0 to 1) and T = (293.15 to 363.15) K.
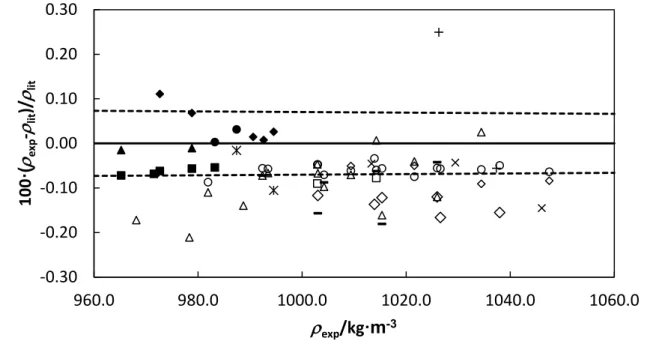
Figure 1. Relative deviations of density measurements (exp) in comparison with literature
values (lit): () Rinker et al. [12], (-)Hsu et al. [13], (◊) Tseng et al. [14], (○)Yang et al. [15]
(□) Spasojevic et al. [16] and (◊) Han et al. [17] for DEA aqueous solutions; () Tseng et al.
[14] and (+) Zhao et al. [18] for TEA aqueous solutions; () Zhang et al. [1917], (■) Maham et al. [20], (▲) Zhang et al. [21], (●) Chowdhury et al. [22] and (*) Bernal–García et al. [23]
for DMAE aqueous solutions. Dotted lines represent the relative expanded uncertainty of our measurements.
The relative deviations of our measurements and literature values are plotted in Figure 1. Average absolute deviations for DEA-water mixtures are 0.09% from [12], 0.10% from [13], 0.07% from [14], 0.06% from [15], 0.7% from [16] (the disagreement occurs at 80°C) and 0.29% from [17]. As regards TEA-water mixtures, average absolute deviation is 0.09% from [14] and 0.15% from [18]. Finally for DMEA-water mixtures, it is 0.05% from [1917], 0.07%
-0.30 -0.20 -0.10 0.00 0.10 0.20 0.30
960.0 980.0 1000.0 1020.0 1040.0 1060.0
100
·(
exp
-lit
)/
lit
from [2018], 0.06% from [2119], 0.02% from [2220] and 0.06% from [23]. These average values are close to the uncertainty of our measurements.
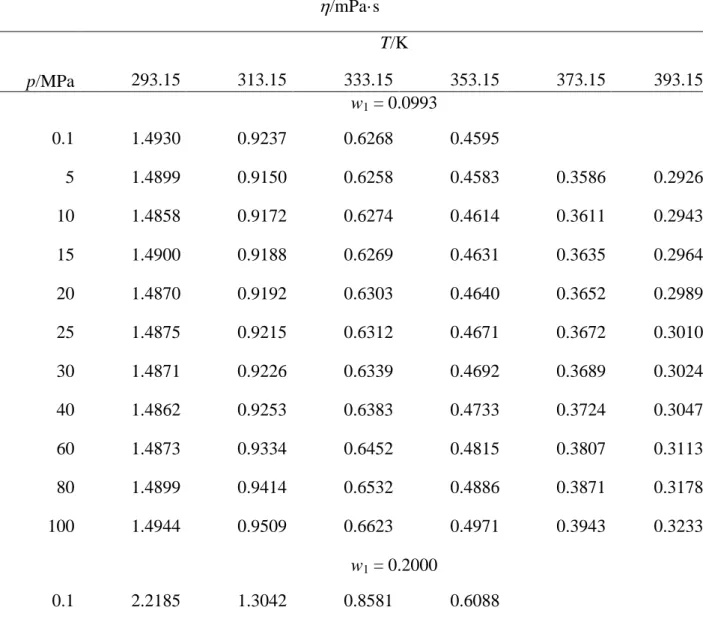
Viscosity measurements of DEA-water, DMAE-water and TEA-water mixtures were carried out at amine weight fractions w1 = 0.10, 0.20, 0.30 and 0. 40, p = (0. 1 to100) MPa and T =
(293.15, 313.15, 333.15, 353.15, 393.15) K, using the falling body viscometer. These measurements are listed in Tables 9-11.
Table 9. Experimental viscosities,, for DEA (1) + H2O (2) mixtures at different conditions of
temperature, T, pressure, p, and mass fraction, w1.a
/mPa·s T/K
p/MPa 293.15 313.15 333.15 353.15 373.15 393.15
w1 = 0.0993
0.1 1.4930 0.9237 0.6268 0.4595
5 1.4899 0.9150 0.6258 0.4583 0.3586 0.2926
10 1.4858 0.9172 0.6274 0.4614 0.3611 0.2943
15 1.4900 0.9188 0.6269 0.4631 0.3635 0.2964
20 1.4870 0.9192 0.6303 0.4640 0.3652 0.2989
25 1.4875 0.9215 0.6312 0.4671 0.3672 0.3010
30 1.4871 0.9226 0.6339 0.4692 0.3689 0.3024
40 1.4862 0.9253 0.6383 0.4733 0.3724 0.3047
60 1.4873 0.9334 0.6452 0.4815 0.3807 0.3113
80 1.4899 0.9414 0.6532 0.4886 0.3871 0.3178
100 1.4944 0.9509 0.6623 0.4971 0.3943 0.3233
w1 = 0.2000
5 2.2149 1.2920 0.8575 0.6083 0.4622 0.3644
10 2.2135 1.2960 0.8602 0.6136 0.4646 0.3676
15 2.2172 1.3011 0.8632 0.6167 0.4670 0.3700
20 2.2169 1.3033 0.8673 0.6198 0.4698 0.3724
25 2.2178 1.3087 0.8717 0.6239 0.4729 0.3748
30 2.2199 1.3120 0.8763 0.6271 0.4761 0.3769
40 2.2212 1.3178 0.8845 0.6333 0.4820 0.3818
60 2.2424 1.3346 0.8989 0.6460 0.4920 0.3919
80 2.2596 1.3525 0.9136 0.6588 0.5046 0.4017
100 2.2773 1.3707 0.9264 0.6731 0.5153 0.4114
w1 = 0.3002
0.1 3.6330 1.9799 1.2470 0.8528
5 3.6166 1.9760 1.2433 0.8459 0.6145 0.4675
10 3.6346 1.9831 1.2484 0.8544 0.6194 0.4721
15 3.6339 1.9928 1.2539 0.8578 0.6247 0.4778
20 3.6607 2.0039 1.2576 0.8642 0.6304 0.4809
25 3.6764 2.0117 1.2655 0.8704 0.6353 0.4848
30 3.6878 2.0225 1.2707 0.8768 0.6417 0.4908
40 3.7139 2.0393 1.2827 0.8887 0.6515 0.4967
60 3.7657 2.0801 1.3120 0.9096 0.6676 0.5122
80 3.8176 2.1192 1.3373 0.9309 0.6851 0.5270
100 3.8744 2.1585 1.3650 0.9514 0.7019 0.5417
w1 = 0.3997
0.1 6.2479 3.1677 1.8849 1.2260
5 6.3506 3.1745 1.8723 1.2308 0.8545 0.6194
10 6.4164 3.2222 1.8864 1.2388 0.8630 0.6265
20 6.5335 3.2391 1.9116 1.2549 0.8808 0.6555
25 6.5982 3.2797 1.8964 1.2643 0.8890 0.6626
30 6.5996 3.3033 1.9434 1.2750 0.9000 0.6682
40 6.6832 3.3606 1.9733 1.2925 0.9123 0.6810
60 6.8533 3.4383 2.0288 1.3349 0.9445 0.7072
80 6.9727 3.5379 2.0858 1.3714 0.9763 0.7305
100 7.1686 3.6251 2.1361 1.4090 1.0033 0.7538
a
Standard uncertainties (k=1): u(T) = 0.01 K; ur(p) = 0.0001; u(w) = 0.0001 and ur() = 0.016
Table 10. Experimental viscosities, , for DMAE (1) + H2O (2) mixtures at different
conditions of temperature, T, pressure, p, and mass fraction, w1.a
/mPa·s T/K
p/MPa 293.15 313.15 333.15 353.15 373.15 393.15
w1 = 0.1005
0.1 1.5589 0.9401 0.6336 0.4624
5 1.5639 0.9415 0.6341 0.4644 0.3590 0.2917
10 1.5638 0.9437 0.6372 0.4671 0.3614 0.2952
15 1.5626 0.9453 0.6403 0.4699 0.3638 0.2973
20 1.5621 0.9476 0.6431 0.4720 0.3659 0.2998
25 1.5615 0.9506 0.6461 0.4744 0.3691 0.3019
30 1.5640 0.9525 0.6477 0.4772 0.3711 0.3036
40 1.5642 0.9570 0.6532 0.4824 0.3746 0.3078
60 1.5623 0.9672 0.6631 0.4910 0.3833 0.3147
80 1.5701 0.9775 0.6729 0.4999 0.3916 0.3220
w1 = 0.2020
0.1 2.5334 1.3682 0.8725 0.6055
5 2.5466 1.3743 0.8770 0.6064 0.4516 0.3533
10 2.5572 1.3819 0.8862 0.6135 0.4543 0.3557
15 2.5659 1.3921 0.8907 0.6195 0.4578 0.3585
20 2.5739 1.3950 0.8970 0.6229 0.4624 0.3624
25 2.5826 1.4004 0.9026 0.6275 0.4659 0.3660
30 2.5893 1.4117 0.9063 0.6338 0.4702 0.3687
40 2.6049 1.4232 0.9178 0.6411 0.4771 0.3736
60 2.6374 1.4505 0.9397 0.6590 0.4923 0.3862
80 2.6717 1.4795 0.9613 0.6779 0.5073 0.3985
100 2.7064 1.5078 0.9835 0.6942 0.5213 0.4097
w1 = 0.3005
0.1 4.2109 2.0424 1.2166 0.8063
5 4.2230 2.0627 1.2232 0.8120 0.5788 0.4325
10 4.2582 2.0835 1.2391 0.8213 0.5834 0.4367
15 4.2946 2.1028 1.2486 0.8321 0.5895 0.4425
20 4.3298 2.1206 1.2597 0.8407 0.5971 0.4483
25 4.3737 2.1420 1.2736 0.8485 0.6020 0.4536
30 4.4046 2.1613 1.2832 0.8560 0.6099 0.4597
40 4.4643 2.1972 1.3049 0.8750 0.6239 0.4697
60 4.5882 2.2735 1.3527 0.9078 0.6493 0.4890
80 4.7300 2.3479 1.3961 0.9395 0.6735 0.5076
100 4.8605 2.4244 1.4424 0.9726 0.6978 0.5265
w1 = 0.3995
0.1 6.5871 2.9897 1.6512 1.0503
10 6.5643 3.0745 1.6948 1.0740 0.7267 0.5259
15 6.8013 3.1208 1.7186 1.0899 0.7398 0.5368
20 6.8629 3.1641 1.7425 1.1054 0.7525 0.5458
25 6.8217 3.2088 1.7655 1.1184 0.7633 0.5538
30 7.0272 3.2532 1.7893 1.1346 0.7742 0.5613
40 6.8831 3.3419 1.8347 1.1671 0.7998 0.5780
60 7.5912 3.5189 1.9265 1.2254 0.8409 0.6086
80 3.6983 2.0190 1.2811 0.8827 0.6407
100 3.8810 2.1128 1.3375 0.9306 0.6716
a
Standard uncertainties (k=1): u(T) = 0.01 K; ur(p) = 0.0001; u(w) = 0.0001 and ur() = 0.016
Table 11. Experimental viscosities, , for TEA (1) + H2O (2) mixtures at different conditions
of temperature, T, pressure, p, and mass fraction, w1.a
/mPa·s T/K
p/MPa 293.15 313.15 333.15 353.15 373.15 393.15
w1 = 0.0992
0.1 1.4285 0.9090 0.6124 0.4585
5 1.4588 0.8937 0.6114 0.4510 0.3584 0.2913
10 1.4550 0.8956 0.6149 0.4541 0.3560 0.2912
15 1.4538 0.8964 0.6154 0.4547 0.3581 0.2933
20 1.4497 0.8965 0.6178 0.4578 0.3595 0.2950
25 1.4473 0.8977 0.6198 0.4595 0.3618 0.2963
30 1.4458 0.8992 0.6221 0.4619 0.3632 0.2988
40 1.4434 0.9027 0.6250 0.4660 0.3659 0.3022
80 1.4465 0.9177 0.6418 0.4813 0.3807 0.3138
100 1.4477 0.9261 0.6513 0.4891 0.3871 0.3200
w1 = 0.2000
0.1 2.0375 1.2029 0.8083 0.5805
5 2.0357 1.2084 0.8084 0.5825 0.4440 0.3551
10 2.0351 1.2102 0.8125 0.5878 0.4475 0.3579
15 2.0400 1.2135 0.8177 0.5898 0.4510 0.3633
20 2.0415 1.2201 0.8200 0.5937 0.4534 0.3620
25 2.0445 1.2248 0.8238 0.5975 0.4562 0.3674
30 2.0461 1.2277 0.8283 0.6006 0.4601 0.3659
40 2.0515 1.2310 0.8329 0.6068 0.4638 0.3704
60 2.0640 1.2507 0.8473 0.6185 0.4753 0.3798
80 2.0799 1.2763 0.8631 0.6313 0.4864 0.3888
100 2.0976 1.2819 0.8789 0.6459 0.4953 0.3982
w1 = 0.2991
0.1 3.2075 1.7864 1.1472 0.8052
5 3.2125 1.7972 1.1545 0.7994 0.5867 0.4515
10 3.2294 1.8079 1.1644 0.8046 0.5894 0.4583
15 3.1800 1.8184 1.1676 0.8110 0.5951 0.4629
20 3.2337 1.8321 1.1779 0.8144 0.5996 0.4675
25 3.2421 1.8348 1.1815 0.8210 0.6046 0.4703
30 3.2453 1.8463 1.1888 0.8266 0.6109 0.4738
40 3.2875 1.8609 1.2027 0.8374 0.6193 0.4822
60 3.3246 1.8927 1.2254 0.8576 0.6379 0.4973
80 3.3727 1.9329 1.2529 0.8785 0.6550 0.5121
100 3.4457 1.9796 1.2929 0.9019 0.6721 0.5378
0.1 5.3166 2.7881 1.6702 1.1242
5 5.3105 2.7938 1.6802 1.1253 0.7909 0.5873
10 5.3312 2.7970 1.6976 1.1358 0.8001 0.5948
15 5.3763 2.8283 1.7037 1.1465 0.8090 0.6019
20 5.4173 2.8522 1.7203 1.1537 0.8190 0.6090
25 5.4451 2.8656 1.7380 1.1636 0.8242 0.6136
30 5.4997 2.8892 1.7477 1.1735 0.8363 0.6246
40 5.5494 2.9279 1.7714 1.1932 0.8525 0.6362
60 5.6746 3.0276 1.8255 1.2293 0.8789 0.6588
80 5.7919 3.1153 1.8777 1.2658 0.9114 0.6835
100 5.9875 3.1926 1.9640 1.3055 0.9403 0.7054
a
Standard uncertainties (k=1): u(T) = 0.01 K; ur(p) = 0.0001; u(w) = 0.0001 and ur() = 0.016
Viscosities of aqueous DEA solutions are always higher than viscosities of aqueous TEA solutions at the same temperature, pressure and composition in all the studied ranges. On the other hand, viscosities of DMEA + water mixtures are greater than DEA solutions’ viscosities at the same temperature and pressure for composition w1 = 0.1, and in the whole composition
and pressure ranges at T = 293.15 K. However, viscosity behavior is reversed, viscosities of DEA solutions are higher than DMAE solutions, as the amine concentration and temperature are increased in such a way that this occurs at w1 = 0.4 in all the pressure range and
temperatures from 313.15 K to 393.15 K.
In addition, viscosities of these mixtures increase with the amine weight fraction and the effect is more significant at lowest temperature and highest pressure for all amines. For example, when the composition is increased from w1 = 0.1 to w1 = 0.4, viscosity of
amine-water mixtures is tripled at T =293.15 K and is nearly doubled at T = 393.15 K.
Viscosity data were correlated using the modified VFT model, Eq(4), which was successfully used by other authors [24].
(4)
Fitting of the experimental viscosity data was performed applying the least-squares method contained in the MATLAB software [25]
The fitting results are given in Table 12 which contains the parameters and the standard deviation of the adjustment. The standard deviations are less than the uncertainty
measurement of the experimental viscosities, which indicates that the model is appropriate for this type of mixtures.
Table 12. Fitting parameters of Eq. (4) andstandard deviations for the viscosity
measurements
DEA (1) + H2O (2) w1 = 0.1 w1 = 0.2 w1 = 0.3 w1 = 0.4
a -3.5117 -3.7494 -3.8529 -3.7495
b/MPa-1 0.002575 0.002639 0.002711 0.002639
c/K 545.33 793.63 771.57 793.65
d/ K·MPa -1 -0.36956 -0.16544 -0.31100 -0.16546
e/ K·MPa -2 0.000151 -0.000415 0.0000349 -0.000415
f/K 153.74 151.58 143.33 151.58
/mPa·s 0.0019 0.039 0.022 0.069
a -3.4895 -3.61800 -3.810981 -3.9315
b/MPa-1 0.002509 0.002552 0.002968 0.002895
c/K 537.45 639.05 760.99 863.98
d/ K·MPa -1 -0.37414 -0.32546 -0.36853 -0.25878
e/ K·MPa -2 0.000266 0.000017 0.000238 -0.000011
f/K 153.99 145.33 140.417 139.01
/mPa·s 0.0042 0.0035 0.017 0.026
DMAE (1) + H2O (2) w1 = 0.1 w1 = 0.2 w1 = 0.3 w1 = 0.4
a -3.5258 -3.6277 -3.6950 -4.0709
b/MPa-1 0.002863 0.002900 0.0028229 0.003133
c/K 540.25 598.04 642.32 797.10
d/ K·MPa -1 -0.36867 -0.27713 -0.13558 -0.06493
e/ K·MPa -2 -0.000045 -0.000168 -0.000339 -0.000357
f/K 157.07 162.05 167.96 159.16
/mPa·s a 0.0022 0.012 0.015 0.057
In order to check the reliability of viscosity data, a comparison was carried out at atmospheric pressure (due to the lack of these values at high pressures) between viscosities obtained with our falling body viscometer and the ones obtained using a Stabinger SVM 3000 viscometer available in our laboratory. The results of the comparison are summarized in Table 13 and they are plotted in Figure 4.
Table 13. Viscosity comparison between falling body viscometer (FB)a and Stabinger SVM
w1 T/K FB/mPa·s SV/mPa·s /FB w1 T/K FB/mPa·s SV/mPa·s /FB
DEA (1) + H2O (2)
0.1 293.15 1.493 1.486 0.005 0.3 293.15 3.633 3.621 0.003
0.1 313.15 0.924 0.914 0.010 0.3 313.15 1.980 1.977 0.001
0.1 333.15 0.627 0.640 -0.021 0.3 333.15 1.247 1.248 -0.001
0.1 353.15 0.460 0.474 -0.031 0.3 353.15 0.853 0.866 -0.016
0.2 293.15 2.219 2.287 -0.031 0.4 293.15 6.248 6.311 -0.010
0.2 313.15 1.304 1.343 -0.030 0.4 313.15 3.168 3.197 -0.009
0.2 333.15 0.858 0.871 -0.015 0.4 333.15 1.885 1.864 0.011
0.2 353.15 0.609 0.627 -0.079 0.4 353.15 1.226 1.244 -0.015
TEA (1) + H2O (2)
0.1 293.15 1.429 1.410 0.013 0.3 293.15 3.208 3.197 0.003
0.1 313.15 0.909 0.881 0.030 0.3 313.15 1.786 1.786 0.000
0.1 333.15 0.612 0.621 -0.014 0.3 333.15 1.147 1.173 -0.022
0.1 353.15 0.459 0.469 -0.023 0.3 353.15 0.805 0.810 -0.006
0.2 293.15 2.038 2.066 -0.014 0.4 293.15 5.317 5.340 -0.004
0.2 313.15 1.203 1.244 -0.034 0.4 313.15 2.788 2.756 0.012
0.2 333.15 0.808 0.821 -0.016 0.4 333.15 1.670 1.669 0.001
0.2 353.15 0.581 0.569 0.019 0.4 353.15 1.124 1.125 -0.001
0.1 293.15 1.559 1.587 -0.018 0.3 293.15 4.211 4.334 -0.029
0.1 313.15 0.940 0.947 -0.008 0.3 313.15 2.042 2.102 -0.029
0.1 333.15 0.634 0.623 0.017 0.3 333.15 1.217 1.226 -0.008
0.1 353.15 0.462 0.475 -0.027 0.3 353.15 0.806 0.809 -0.003
0.2 293.15 2.533 2.614 -0.032 0.4 293.15 6.587 6.754 -0.025
0.2 313.15 1.368 1.408 -0.029 0.4 313.15 2.990 3.068 -0.026
0.2 333.15 0.873 0.888 -0.018 0.4 333.15 1.651 1.671 -0.012
0.2 353.15 0.606 0.618 -0.020 0.4 353.15 1.050 1.044 0.006
a
Standard uncertainties (k =1): u(T) = 0.01 K; ur(p) = 0.0001; u(w) = 0.0001; ur() = 0.016 b
Standard uncertainties (k =1): u(T) = 0.02 K; ur(p) = 0. 005; u(w) = 0.0001; ur() = 0.01
Figure 4. Relative viscosity deviation between falling body viscometer (FB) and Stabinger
SVM 3000 viscometer (SV) for the mixtures: (x) DEA + water; () TEA + water) and (+)
DMAE + water. Discontinuous lines represent the relative expanded uncertainty of our measurements.
-4.0 -3.0 -2.0 -1.0 0.0 1.0 2.0 3.0 4.0
0.5 1.5 2.5 3.5 4.5 5.5 6.5
100.
η
/
ηFB
In addition, our experimental data were also contrasted with the scarce literature data at atmospheric pressure [12,16,18,21,22,26], we have selected those data measured in the same conditions of composition and temperature as our data. For aqueous DEA solutions, Rinker et al. [12] measured at w1 = (0.1, 0.2, 0.3) and T = (293.15, 313.15, 333.15, 353.15, 373.15) K,
Spasojevic et al. [16] measured at w1 = (0.05, 0.1, 0.15, 0.2, 0.25) and T = (298.15 to 343.15)
K, Hsu et al. [26] measured at w1 = (0.1, 0.2) and T = (313.15, 333.15, 353.15) K. For
aqueous TEA solutions, Zhao et al. [18] measured at w1 = 0.3 and T = (303.15 to 343.15) K.
For aqueous DMAE solutions, Zhang et al. [21] at w1 = (0.15, 0.3, 0.45) and T = (303.15 to
353.15) K, and Chowdhury et al. [22] at x1 = (0.1 to 0.9) and T = (303.15 to 323.15) K.
Relative viscosity deviations are shown in Figure 5.
Figure 5. Relative viscosity deviation between our experimental data (exp) and literature
values (lit): (◊) Rinker et al. [12], (□) Spasojevic et al. [16], and (○) Hsu et al. [26] for DEA
+ water mixtures; () Zhao et al. [18] for TEA + water mixtures, and (+) Zhang et al. [21] -6.0
-4.0 -2.0 0.0 2.0 4.0 6.0
0.2 0.7 1.2 1.7 2.2 2.7 3.2 3.7 4.2
100
·(
exp
-lit
)/
lit
and () Chowdhury et al. [22] for DMAE + water mixtures. Dotted lines represent the relative expanded uncertainty of our measurements.
Average absolute deviations between our measurements and those reported in the literature are 1.5% in comparison with Rinker et al. [12], 1.3% with Spasojevic et al. [16], 1,7 % with Hsu et al. [26], all of them for DEA aqueous solutions, 2.0% with Trusler et al. [21] and Chowdhury et al. 5.4% [22] for DMEA solutions, this deviation might be due to the
difference in composition as the authors measured at w= 0.22. Most values are in agreement with our uncertainties. There are other few viscosity measurements in the literature for the systems studied in this paper but they were measured at different compositions and it is not possible to compare the data.
4. Conclusions
Density and viscosity measurements of different amine aqueous solutions (DEA + H2O,
TEA+H2O and DMAE +H2O) were measured at amine mass fractions of 10%, 20%, 30% and
40%, and wide ranges of temperature and pressure. Densities increase for richer amine solutions for DEA and TEA but the contrary occurs for DMEA mixtures. A modified
Tamman-Tait equation fits quite well the density as a function of pressure and temperature for a given composition.
In addition, viscosities of these mixtures increase with amine weight fraction being this effect more significant at low temperatures for all amines. They were successfully correlated using a modified VFT model.
E.I.C. thanks to Project for European Latin American Cooperation and Exchange (PEACE), for doctoral studies. The work was funded by the Regional Government of Castilla y León through the Project VA295U14.
References
[1] Y. Wu, Q. Zhou, C. W. Chan, Eng. Appl. Artif. Intel. 23 (2010) 1265–1276.
[2[5] JCGM, Evaluation of measurement data - Guide to the expression of uncertainty in measurement (JCGM 100:2008), BIPM, 2008.
[6] P. Dauge, A. Baylaucq, L. Marlin, C. Boned, J. Chem. Eng. Data 46 (2001) 823–830. [7] W.A. Wakeham, A. Nagashima, J.V. Sengers, Experimental Thermodynamics, Vol. III: Measurement of the Transport Properties of Fluids, Blackwell Scientific Publications, Oxford, 1991.
[8] M.J.P. Comuñas, X. Paredes, F. M. Gaciño, J. Fernández, J. Bazile, C. Boned, J. Daridon, G. Galliero, J. Pauly, K.R. Harris, J. Chem. Thermodyn. 69 (2014) 201–208.
[9] M. Sobrino, E.I. Concepción, A. Gómez-Hernández, M.C. Martín, J.J. Segovia, J. Chem. Thermodyn. 98 (2016) 231–241.
[10] W. Wagner, A. Pruss, J. Phys. Chem. Ref. Data 31 (2002) 387–535.
[11] M. Sobrino, Desarrollo de un viscosímetro para la caracterización a alta presión de nuevos biocombustibles y mezclas acuosas de aminas para la captura de CO2, PhD Thesis,
University of Valladolid, Spain, 2015.
[12] E.B. Rinker, D. W. Oelschlager, A.T. Colussi, K.R. Henry, O.C. Sandall, J. Chem. Eng. Data 39 (1994) 392–395.
[13] C.H. Hsu, M.H. Li, J. Chem. Eng. Data 42 (1997) 502–507.
[16] V.D. Spasojević, S.P. Šerbanović, B.D. Djordjević, M.L. Kijevčanin, J. Chem. Eng. Data 58 (2013) 84–92.
[17] J. Han, J. Jin, D.A. Eimer, M.C. Melaaen, J. Chem. Eng. Data 57 (2012) 1843-1850. [18] Y. Zhao, X. Zhang, S. Zeng, Q. Zhou, H. Dong, Z. Tian, S. Zhang, J. Chem. Eng. Data 55 (2012) 3513-3519.
[19] F. Zhang, Thermochim. Acta 254 (1995) 347–357.
[20] Y. Maham, T.T. Teng, L.G. Hepler, A.E. Mather, Thermochim. Acta 386 (2002) 111– 118.
[21] J. Zhang, P.S. Fennel, J.P.M. Trusler, J. Chem. Eng. Data 60 (2015) 2392–2399. [22] F.I. Chowdhury, S. Akhtar, M.A. Saleh, M.U. Khandaker, Y.M. Amin, A.K. Arof, J. Mol. Liq. 223 (2016) 299–314.
[23] J.M. Bernal-García, K.R. Hall, A. Estrada-Baltazar, G.A. Iglesias-Silva, J. Chem. Thermodyn. 37 (2005) 762-767.
[24] K.R. Harris, L.A. Woolf, M. Kanakubo, J. Chem. Eng. Data 50 (2005) 1777–1782. [25] MATLAB and Statistics Toolbox Release R2011a, The MathWorks, Inc., Natick, Massachusetts, United States, 2011.