INTRODUCTION TO MODELING AND SIMULATION
Anu Maria
State University of New York at Binghamton Department of Systems Science and Industrial Engineering
Binghamton, NY 13902-6000, U.S.A.
ABSTRACT
This introductory tutorial is an overview of simulation modeling and analysis. Many critical questions are answered in the paper. What is modeling? What is simulation? What is simulation modeling and analysis? What types of problems are suitable for simulation? How to select simulation software? What are the benefits and pitfalls in modeling and simulation? The intended audience is those unfamiliar with the area of discrete event simulation as well as beginners looking for an overview of the area. This includes anyone who is involved in system design and modification - system analysts, management personnel, engineers, military planners, economists, banking analysts, and computer scientists. Familiarity with probability and statistics is assumed.
1 WHAT IS MODELING?
Modeling is the process of producing a model; a model is a representation of the construction and working of some system of interest. A model is similar to but simpler than the system it represents. One purpose of a model is to enable the analyst to predict the effect of changes to the system. On the one hand, a model should be a close approximation to the real system and incorporate most of its salient features. On the other hand, it should not be so complex that it is impossible to understand and experiment with it. A good model is a judicious tradeoff between realism and simplicity. Simulation practitioners recommend increasing the complexity of a model iteratively. An important issue in modeling is model validity. Model validation techniques include simulating the model under known input conditions and comparing model output with system output.
Generally, a model intended for a simulation study is a mathematical model developed with the help of simulation software. Mathematical model classifications include deterministic (input and output variables are fixed values) or stochastic (at least one of the input or
output variables is probabilistic); static (time is not taken into account) or dynamic (time-varying interactions among variables are taken into account). Typically, simulation models are stochastic and dynamic.
2 WHAT IS SIMULATION?
A simulation of a system is the operation of a model of the system. The model can be reconfigured and experimented with; usually, this is impossible, too expensive or impractical to do in the system it represents. The operation of the model can be studied, and hence, properties concerning the behavior of the actual system or its subsystem can be inferred. In its broadest sense, simulation is a tool to evaluate the performance of a system, existing or proposed, under different configurations of interest and over long periods of real time.
Simulation is used before an existing system is altered or a new system built, to reduce the chances of failure to meet specifications, to eliminate unforeseen bottlenecks, to prevent under or over-utilization of resources, and to optimize system performance. For instance, simulation can be used to answer questions like: What is the best design for a new telecommunications network? What are the associated resource requirements? How will a telecommunication network perform when the traffic load increases by 50%? How will a new routing algorithm affect its performance? Which network protocol optimizes network performance? What will be the impact of a link failure?
The subject of this tutorial is discrete event simulation in which the central assumption is that the system changes instantaneously in response to certain discrete events. For instance, in an M/M/1 queue - a single server queuing process in which time between arrivals and service time are exponential - an arrival causes the system to change instantaneously. On the other hand, continuous simulators, like flight simulators and weather simulators, attempt to quantify the changes in a system continuously over time in response to
controls. Discrete event simulation is less detailed (coarser in its smallest time unit) than continuous simulation but it is much simpler to implement, and hence, is used in a wide variety of situations.
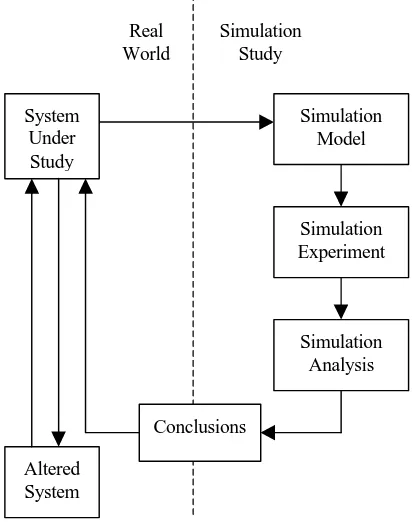
[image:2.612.77.283.334.595.2]Figure 1 is a schematic of a simulation study. The iterative nature of the process is indicated by the system under study becoming the altered system which then becomes the system under study and the cycle repeats. In a simulation study, human decision making is required at all stages, namely, model development, experiment design, output analysis, conclusion formulation, and making decisions to alter the system under study. The only stage where human intervention is not required is the running of the simulations, which most simulation software packages perform efficiently. The important point is that powerful simulation software is merely a hygiene factor - its absence can hurt a simulation study but its presence will not ensure success. Experienced problem formulators and simulation modelers and analysts are indispensable for a successful simulation study.
Figure 1: Simulation Study Schematic
The steps involved in developing a simulation model, designing a simulation experiment, and performing simulation analysis are:
Step 1. Identify the problem. Step 2. Formulate the problem.
Step 3. Collect and process real system data. Step 4. Formulate and develop a model.
Step 5. Validate the model.
Step 6. Document model for future use. Step 7. Select appropriate experimental design. Step 8. Establish experimental conditions for runs. Step 9. Perform simulation runs.
Step 10. Interpret and present results.
Step 11. Recommend further course of action. Although this is a logical ordering of steps in a simulation study, many iterations at various sub-stages may be required before the objectives of a simulation study are achieved. Not all the steps may be possible and/or required. On the other hand, additional steps may have to be performed. The next three sections describe these steps in detail.
3 HOW TO DEVELOP A SIMULATION MODEL?
Simulation models consist of the following components: system entities, input variables, performance measures, and functional relationships. For instance in a simulation model of an M/M/1 queue, the server and the queue are system entities, arrival rate and service rate are input variables, mean wait time and maximum queue length are performance measures, and 'time in system = wait time + service time' is an example of a functional relationship. Almost all simulation software packages provide constructs to model each of the above components. Modeling is arguably the most important part of a simulation study. Indeed, a simulation study is as good as the simulation model. Simulation modeling comprises the following steps:
Step 1. Identify the problem. Enumerate problems with an existing system. Produce requirements for a proposed system.
Step 2. Formulate the problem. Select the bounds of the system, the problem or a part thereof, to be studied. Define overall objective of the study and a few specific issues to be addressed. Define performance measures - quantitative criteria on the basis of which different system configurations will be compared and ranked. Identify, briefly at this stage, the configurations of interest and formulate hypotheses about system performance. Decide the time frame of the study, i.e., will the model be used for a one-time decision (e.g., capital expenditure) or over a period of time on a regular basis (e.g., air traffic scheduling). Identify the end user of the simulation model, e.g., corporate management versus a production supervisor. Problems must be formulated as precisely as possible.
Step 3. Collect and process real system data. Collect data on system specifications (e.g., bandwidth for a communication network), input variables, as well as Altered
System System Under Study
Simulation Model Real
World
Simulation Study
Simulation Experiment
Simulation Analysis
Conclusions
performance of the existing system. Identify sources of randomness in the system, i.e., the stochastic input variables. Select an appropriate input probability distribution for each stochastic input variable and estimate corresponding parameter(s).
Software packages for distribution fitting and selection include ExpertFit, BestFit, and add-ons in some standard statistical packages. These aids combine goodness-of-fit tests, e.g., χ2 test, Kolmogorov-Smirnov test, and Anderson-Darling test, and parameter estimation in a user friendly format.
Standard distributions, e.g., exponential, Poisson, normal, hyperexponential, etc., are easy to model and simulate. Although most simulation software packages include many distributions as a standard feature, issues relating to random number generators and generating random variates from various distributions are pertinent and should be looked into. Empirical distributions are used when standard distributions are not appropriate or do not fit the available system data. Triangular, uniform or normal distribution is used as a first guess when no data are available. For a detailed treatment of probability distributions see Maria and Zhang (1997).
Step 4. Formulate and develop a model. Develop schematics and network diagrams of the system (How do entities flow through the system?). Translate these conceptual models to simulation software acceptable form. Verify that the simulation model executes as intended. Verification techniques include traces, varying input parameters over their acceptable range and checking the output, substituting constants for random variables and manually checking results, and animation.
Step 5. Validate the model. Compare the model's performance under known conditions with the performance of the real system. Perform statistical inference tests and get the model examined by system experts. Assess the confidence that the end user places on the model and address problems if any. For major simulation studies, experienced consultants advocate a structured presentation of the model by the simulation analyst(s) before an audience of management and system experts. This not only ensures that the model assumptions are correct, complete and consistent, but also enhances confidence in the model.
Step 6. Document model for future use. Document objectives, assumptions and input variables in detail.
4 HOW TO DESIGN A SIMULATION EXPERIMENT?
A simulation experiment is a test or a series of tests in which meaningful changes are made to the input
variables of a simulation model so that we may observe and identify the reasons for changes in the performance measures. The number of experiments in a simulation study is greater than or equal to the number of questions being asked about the model (e.g., Is there a significant difference between the mean delay in communication networks A and B?, Which network has the least delay: A, B, or C? How will a new routing algorithm affect the performance of network B?). Design of a simulation experiment involves answering the question: what data need to be obtained, in what form, and how much? The following steps illustrate the process of designing a simulation experiment.
Step 7. Select appropriate experimental design. Select a performance measure, a few input variables that are likely to influence it, and the levels of each input variable. When the number of possible configurations (product of the number of input variables and the levels of each input variable) is large and the simulation model is complex, common second-order design classes including central composite, Box-Behnken, and full-factorial should be considered. Document the experimental design.
Step 8. Establish experimental conditions for runs. Address the question of obtaining accurate information and the most information from each run. Determine if the system is stationary (performance measure does not change over time) or non-stationary (performance measure changes over time). Generally, in stationary systems, steady-state behavior of the response variable is of interest. Ascertain whether a terminating or a non-terminating simulation run is appropriate. Select the run length. Select appropriate starting conditions (e.g., empty and idle, five customers in queue at time 0). Select the length of the warm-up period, if required. Decide the number of independent runs - each run uses a different random number stream and the same starting conditions -by considering output data sample size. Sample size must be large enough (at least 3-5 runs for each configuration) to provide the required confidence in the performance measure estimates. Alternately, use common random numbers to compare alternative configurations by using a separate random number stream for each sampling process in a configuration. Identify output data most likely to be correlated.
Step 9. Perform simulation runs. Perform runs according to steps 7-8 above.
Most simulation packages provide run statistics (mean, standard deviation, minimum value, maximum value) on the performance measures, e.g., wait time (non-time persistent statistic), inventory on hand (time persistent statistic). Let the mean wait time in an M/M/1 queue observed from n runs be W1,W2,...,Wn. It is important to
understand that the mean wait time W is a random variable and the objective of output analysis is to estimate the true mean of W and to quantify its variability.
Notwithstanding the facts that there are no data collection errors in simulation, the underlying model is fully known, and replications and configurations are user controlled, simulation results are difficult to interpret. An observation may be due to system characteristics or just a random occurrence. Normally, statistical inference can assess the significance of an observed phenomenon, but most statistical inference techniques assume independent, identically distributed (iid) data. Most types of simulation data are autocorrelated, and hence, do not satisfy this assumption. Analysis of simulation output data consists of the following steps.
Step 10. Interpret and present results. Compute numerical estimates (e.g., mean, confidence intervals) of the desired performance measure for each configuration of interest. To obtain confidence intervals for the mean of autocorrelated data, the technique of batch means can be used. In batch means, original contiguous data set from a run is replaced with a smaller data set containing the means of contiguous batches of original observations. The assumption that batch means are independent may not always be true; increasing total sample size and increasing the batch length may help.
Test hypotheses about system performance. Construct graphical displays (e.g., pie charts, histograms) of the output data. Document results and conclusions.
Step 11. Recommend further course of action. This may include further experiments to increase the precision and reduce the bias of estimators, to perform sensitivity analyses, etc.
6 AN EXAMPLE
A machine shop contains two drills, one straightener, and one finishing operator. Figure 2 shows a schematic of the machine shop. Two types of parts enter the machine shop.
Type 1 parts require drilling, straightening, and finishing in sequence. Type 2 parts require only drilling and finishing. The frequency of arrival and the time to be routed to the drilling area are deterministic for both types of parts.
Step 1. Identify the problem. The utilization of drills, straightener, and finishing operator needs to be assessed. In addition, the following modification to the original system is of interest: the frequency of arrival of both parts is exponential with the same respective means as in the original system.
Step 2. Formulate the problem. The objective is to obtain the utilization of drills, straightener, and finishing operator for the original system and the modification. The assumptions include:
♦ The two drills are identical
♦ There is no material handling time between the three operations.
♦ Machine availability implies operator availability. ♦ Parts are processed on a FIFO basis.
♦ All times are in minutes.
Step 3. Collect and process real system data. At the job shop, a Type 1 part arrives every 30 minutes, and a Type 2 part arrives every 20 minutes. It takes 2 minutes to route a Type 1 part and 10 minutes to route a Type 2 part to the drilling area. Parts wait in a queue till one of the two drilling machines becomes available. After drilling, Type 1 parts are routed to the straightener and Type 2 parts are
Drill #1
Drill #2
Straightener
Legend:
[image:4.612.329.536.137.302.2]Type 1 parts Type 2 parts
Figure 2: Schematic of the Machine Shop Finishing Operator
routed to the finishing operator. After straightening, Type 1 parts are routed to the finishing operator.
The operation times for either part were determined to be as follows. Drilling time is normally distributed with mean 10.0 and standard deviation 1.0. Straightening time is exponentially distributed with a mean of 15.0. Finishing requires 5 minutes per part.
Step 4. Formulate and develop a model. A model of the system and the modification was developed using a simulation package. A trace verified that the parts flowed through the job shop as expected.
Step 5. Validate the model. The utilization for a sufficiently long run of the original system was judged to be reasonable by the machine shop operators.
Step 6. Document model for future use. The models of the original system and the modification were documented as thoroughly as possible.
Step 7. Select appropriate experimental design. The original system and the modification described above were studied.
Step 8. Establish experimental conditions for runs. Each model was run three times for 4000 minutes and statistical registers were cleared at time 1000, so the statistics below were collected on the time interval [1000, 4000]. At the beginning of a simulation run, there were no parts in the machine shop.
Step 9. Perform simulation runs. Runs were performed as specified in Step 8 above.
Step 10. Interpret and present results. Table 1 contains the utilization statistics of the three operations for the original system and the modification (in parentheses).
Table 1: Utilization Statistics
Drilling Straightening Finishing Mean Run #1 0.83 (0.78) 0.51 (0.58) 0.42 (0.39) Mean Run #2 0.82 (0.90) 0.52 (0.49) 0.41 (0.45) Mean Run #3 0.84 (0.81) 0.42 (0.56) 0.42 (0.40) Std. Dev. Run #1 0.69 (0.75) 0.50 (0.49) 0.49 (0.49) Std. Dev. Run #2 0.68 (0.78) 0.50 (0.50) 0.49 (0.50) Std. Dev. Run #3 0.69 (0.76) 0.49 (0.50) 0.49 (0.49)
Mean utilization represents the fraction of time a server is busy, i.e., busy time/total time. Furthermore, the average utilization output for drilling must be divided by the number of drills in order to get the utilization per drill. Each drill is busy about 40% of the time and straightening and finishing operations are busy about half the time. This implies that for the given work load, the system is
underutilized. Consequently, the average utilization did not change substantially between the original system and the modification; the standard deviation of the drilling operation seems to have increased because of the increased randomness in the modification. The statistical significance of these observations can be determined by computing confidence intervals on the mean utilization of the original and modified systems.
Step 11. Recommend further course of action. Other performance measures of interest may be: throughput of parts for the system, mean time in system for both types of parts, average and maximum queue lengths for each operation. Other modifications of interest may be: the flow of parts to the machine shop doubles, the finishing operation will be repeated for 10% of the products on a probabilistic basis.
7 WHAT MAKES A PROBLEM SUITABLE FOR SIMULATION MODELING AND ANALYSIS? In general, whenever there is a need to model and analyze randomness in a system, simulation is the tool of choice. More specifically, situations in which simulation modeling and analysis is used include the following: ♦ It is impossible or extremely expensive to observe
certain processes in the real world, e.g., next year's cancer statistics, performance of the next space shuttle, and the effect of Internet advertising on a company's sales.
♦ Problems in which mathematical model can be formulated but analytic solutions are either impossible (e.g., job shop scheduling problem, high-order difference equations) or too complicated (e.g., complex systems like the stock market, and large scale queuing models).
♦ It is impossible or extremely expensive to validate the mathematical model describing the system, e.g., due to insufficient data.
Applications of simulation abound in the areas of government, defense, computer and communication systems, manufacturing, transportation (air traffic control), health care, ecology and environment, sociological and behavioral studies, biosciences, epidemiology, services (bank teller scheduling), economics and business analysis.
8 HOW TO SELECT SIMULATION SOFTWARE?
advantages are reduced programming requirements; natural framework for simulation modeling; conceptual guidance; automated gathering of statistics; graphic symbolism for communication; animation; and increasingly, flexibility to change the model. There are hundreds of simulation products on the market, many with price tags of $15,000 or more. Naturally, the question of how to select the best simulation software for an application arises. Metrics for evaluation include modeling flexibility, ease of use, modeling structure (hierarchical v/s flat; object-oriented v/s nested), code reusability, graphic user interface, animation, dynamic business graphics, hardware and software requirements, statistical capabilities, output reports and graphical plots, customer support, and documentation.
[image:6.612.63.293.415.591.2]The two types of simulation packages are simulation languages and application-oriented simulators (Table 2). Simulation languages offer more flexibility than the application-oriented simulators. On the other hand, languages require varying amounts of programming expertise. Application-oriented simulators are easier to learn and have modeling constructs closely related to the application. Most simulation packages incorporate animation which is excellent for communication and can be used to debug the simulation program; a "correct looking" animation, however, is not a guarantee of a valid model. More importantly, animation is not a substitute for output analysis.
Table 2: Simulation Packages
Type Of Simulation
Package
Examples
Simulation languages
Arena (previously SIMAN), AweSim! (previously SLAM II), Extend, GPSS, Micro Saint, SIMSCRIPT, SLX
Object-oriented software: MODSIM III, SIMPLE++ Animation software: Proof Animation
Application -Oriented Simulators
Manufacturing: AutoMod, Extend+MFG, FACTOR/AIM, ManSim/X, MP$IM, ProModel, QUEST, Taylor II, WITNESS Communications/computer: COMNET III,
NETWORK II.5, OPNET Modeler, OPNET Planner, SES/Strategizer, SES/workbench Business: BP$IM, Extend+BPR, ProcessModel,
ServiceModel, SIMPROCESS, Time machine Health Care: MedModel
9 BENEFITS OF SIMULATION MODELING AND ANALYSIS
According to practitioners, simulation modeling and analysis is one of the most frequently used operations research techniques. When used judiciously, simulation modeling and analysis makes it possible to:
♦ Obtain a better understanding of the system by developing a mathematical model of a system of
interest, and observing the system's operation in detail over long periods of time.
♦ Test hypotheses about the system for feasibility. ♦ Compress time to observe certain phenomena over
long periods or expand time to observe a complex phenomenon in detail.
♦ Study the effects of certain informational, organizational, environmental and policy changes on the operation of a system by altering the system's model; this can be done without disrupting the real system and significantly reduces the risk of experimenting with the real system.
♦ Experiment with new or unknown situations about which only weak information is available.
♦ Identify the "driving" variables - ones that performance measures are most sensitive to - and the inter-relationships among them.
♦ Identify bottlenecks in the flow of entities (material, people, etc.) or information.
♦ Use multiple performance metrics for analyzing system configurations.
♦ Employ a systems approach to problem solving. ♦ Develop well designed and robust systems and
reduce system development time.
10 WHAT ARE SOME PITFALLS TO GUARD AGAINST IN SIMULATION?
Simulation can be a time consuming and complex exercise, from modeling through output analysis, that necessitates the involvement of resident experts and decision makers in the entire process. Following is a checklist of pitfalls to guard against.
♦ Unclear objective.
♦ Using simulation when an analytic solution is appropriate.
♦ Invalid model.
♦ Simulation model too complex or too simple. ♦ Erroneous assumptions.
♦ Undocumented assumptions. This is extremely important and it is strongly suggested that assumptions made at each stage of the simulation modeling and analysis exercise be documented thoroughly.
♦ Using the wrong input probability distribution. ♦ Replacing a distribution (stochastic) by its mean
(deterministic).
♦ Using the wrong performance measure. ♦ Bugs in the simulation program.
♦ Using standard statistical formulas that assume independence in simulation output analysis.
♦ Initial bias in output data.
♦ Making one simulation run for a configuration.
♦ Poor schedule and budget planning.
♦ Poor communication among the personnel involved in the simulation study.
REFERENCES
Banks, J., J. S. Carson, II, and B. L. Nelson. 1996. Discrete-Event System Simulation, Second Edition, Prentice Hall.
Bratley, P., B. L. Fox, and L. E. Schrage. 1987. A Guide to Simulation, Second Edition, Springer-Verlag. Fishwick, P. A. 1995. Simulation Model Design and
Execution: Building Digital Worlds, Prentice-Hall. Freund, J. E. 1992. Mathematical Statistics, Fifth Edition,
Prentice-Hall.
Hogg, R. V., and A. T. Craig. 1995. Introduction to Mathematical Statistics, Fifth Edition, Prentice-Hall. Kleijnen, J. P. C. 1987. Statistical Tools for Simulation
Practitioners, Marcel Dekker, New York.
Law, A. M., and W. D. Kelton. 1991. Simulation Modeling and Analysis, Second Edition, McGraw-Hill.
Law, A. M., and M. G. McComas. 1991. Secrets of Successful Simulation Studies, Proceedings of the 1991 Winter Simulation Conference, ed. J. M. Charnes, D. M. Morrice, D. T. Brunner, and J. J. Swain, 21-27. Institute of Electrical and Electronics Engineers, Piscataway, New Jersey.
Maria, A., and L. Zhang. 1997. Probability Distributions, Version 1.0, July 1997, Monograph, Department of Systems Science and Industrial Engineering, SUNY at Binghamton, Binghamton, NY 13902.
Montgomery, D. C. 1997. Design and Analysis of Experiments, Third Edition, John Wiley.
Naylor, T. H., J. L. Balintfy, D. S. Burdick, and K. Chu. 1966. Computer Simulation Techniques, John Wiley. Nelson, B. L. 1995. Stochastic Modeling: Analysis and
Simulation, McGraw-Hill.
AUTHOR BIOGRAPHY