63
Reyes LA, et al. Physiologic simulator to predict the arterial oxygen saturation at extreme heights
www.medigraphic.org.mx
ARTÍCULO DE INVESTIGACIÓN ORIGINAL
Vol. XXXII, Núm. 1 Julio 2011 pp 63 - 71
ABSTRACT
A simulator («Alturas») was developed to calculate the levels of arterial oxygen saturation (SaO2) at heights ranging from small to extreme. The
results of the simulations were compared to published experimental data in order to validate the accuracy of the simulator. Three types of cases were used in the comparison: (1) non acclimatized people at heights ranging from 20 m to 4,162 m above sea level, (2) inhabitants of mountain zones living at heights between 1,692 m and 4,230 m, (3) people in ascension of a mountain at heights from 4,250 m to 7,500 m. The statistical analysis shows no significant difference between the reported clinical values and the values generated by the simulator. The simulator is able to predict the different average values of SaO2 at different heights under three conditions: recently arrived, in adaptation and in acclimatization.
Key Words: Medical simulators, pulmonary simulators, pulmonary physi-ology, extreme height.
RESUMEN
Se desarrolló un simulador («Alturas») para determinar los niveles de saturación de oxígeno arterial (SaO2) desde pequeñas alturas hasta alturas extremas. Los resultados de las simulaciones presentadas aquí fueron comparados con datos experimentales publicados para validar su funcionamiento. Se compararon tres tipos de casos: (1) personas no aclimatadas en altitudes que van de 20 a 4,164 m sobre el nivel de mar, (2) habitantes de zonas montañosas en altitudes de 1,692 a 4,230 m, (3) personas en ascensión a una montaña en altitudes de 4,250 a 7,500 m. Los análisis estadísticos de comparación de medias muestran que no existen diferencias estadísticamente significativas entre los valores clínicos reportados y los valores generados por el simulador. El simulador permite predecir los diferentes valores medios de SaO2 en las diferentes alturas en tres condiciones: recién llegados, en adaptación y en aclimatación.
Palabras clave: Simulador artificial, simuladores pulmonares, fisiología pulmonar, alturas extremas.
Physiologic simulator to predict the arterial oxygen
saturation at extreme heights
Arturo Reyes Lazalde* María Eugenia Pérez Bonilla* Olga Leticia Fuchs Gómez** Marleni Reyes Monreal**
* Laboratorio de Biología Interactiva, Escue-la de Biología, Benemérita Universidad Autónoma de Puebla (BUAP).
** Facultad de Ciencias Físico Matemáticas, (BUAP).
*** Maestría en Estética, Facultad de Filoso-fía y Letras, (BUAP).
Correspondence: Arturo Reyes Lazalde.
Juan de Palafox y Mendoza Núm. 218, Colonia Centro, 72000 Tel. (01 222) 2295500 Ext. 7072, Fax. (01 222) 2295500 Ext. 7083. E-mail: arreyes@siu.buap.mx
Received article: 10/january/2010 Accepted article: 10/january/2011
SOMIB
REVISTA MEXICANA DE INGENIERÍA BIOMÉDICA
Este artículo puede ser consultado en ver-sión completa en: http://www.medigraphic.
com/ingenieriabiomedica
INTRODUCTION
The study of physiopathological processes which occur in individuals exposed to a hypobaric hy-poxia is of great medical interest. This is because
www.medigraphic.org.mx
inhabitants; El Alto has over a million. The amount of people living at extreme heights is increased by the number of workers that travel every day to work at heights above 4,000 m2,3. All these people have had their cardio respiratory systems to adapt to survive under such conditions. All of them are under risk of developing all sorts of diseases associ-ated with great heights such as chronic mountain sickness, pulmonary edema and cerebral edema. These conditions are often fatal4,5.
Pulmonary physiology is especially suitable to be predicted through mathematical models that take into account the physical laws that explain the exchange of gasses taking place in the lungs. Nevertheless there was no simulator to predict the arterial oxygen saturation values (SaO2) of an indi-vidual at different heights above sea level6.
For the simulation of the pulmonary function we count with the standardization of spirometry, several mathematical models used to describe pulmonary function7,8 and a number of clinical studies that present reference values for the vital capacity (VC), the forced vital capacity (FVC), the total lung ca-pacity (TLC), the residual volume (RV), the functional residual capacity (FRC), and the tidal volume (VT). It is necessary to adjust the parameter values of all of these models to reproduce the reference values9. There are also pulmonary simulators10 that predict oxygen transportation and exchange at tissue level or that are related with pulmonary ventilation pro-cesses11. None of them, however, are designed to simulate pulmonary physiology at great heights.
We base our simulator on the available knowl-edge on the physiology of the pulmonary function at great altitudes12, also on the results of clinical measurements that took place in several expedi-tions at extreme heights12-14, such as Mount Chal-cataya (5,260 m), Mount Potosi (6,080 m), Mount Illimani (6,500 m) in Bolivia, Mauna Kea in Hawaii, and Chajnantor in Chile, amongst others.
Because of the intrinsic difficulties of conducting this type of study there is little available data for higher altitudes. Nevertheless there was an excur-sion to Mount Everest in 1981 in which blood gasses were measured and cardiopulmonary function and muscular function were studied by a group of physi-ologists led by West15. The data for alveolar oxygen pressure and barometric pressure16 obtained in this expedition were used for the development of this simulator.
The barometric pressure decreases with altitude and hence the inspired PO2 and PAO2. At an altitude of 5,000 m, the highest at which humans reside,
the inspired PO2 is only about half of the sea level value12.
Physiologists often cite high-altitude acclimatiza-tion as one of the best examples of how the body responds to a hostile environment. The extent of hyperventilation at high altitude can be enormous. At the summit of Mount Everest, were the inhaled PO2 is only 29% of its sea level value, the alveolar ventilation is increased approximately fivefold12. From 3,500 m the PAO2 is less than 50 mmHg and may require oxygen therapy.
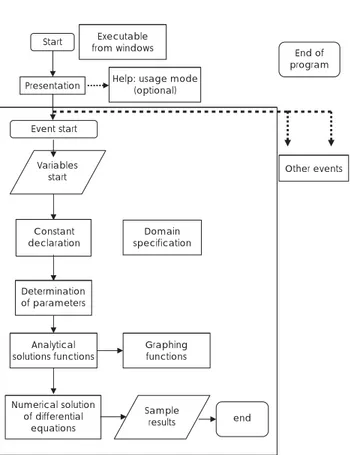
DEVELOPMENT OF THE SIMULATOR
Visual Basic® ver. 5.0 for PC was used to create the simulator. The minimal requirements for the software are: Pentium III, 350 MHz or higher, Windows 98 or higher, SuperVGA Monitor with a resolution of 1024 x 768 pixels of higher and at least 10 MB of free space on Hard Drive.
Model for oxygen ventilation
The simulation of oxygen diffusion processes are referrals to the alveolar-capillar level: An equivalent alveolus (equivalent to the total area of pulmonary exchange in a 70 kg adult) is emulated with a capil-larity split in two parts: one oxygenated and one not. The diffusion is ruled by the law of Fick in which the flux or amount of gas ( ) which passes through a surface is inversely proportional to the thickness of the tissue (G) and directly proportional to the area of the exchange surface (S), the difference in pres-sures between the alveolus and the capillarity (P1-P2) and a constant of diffusion (D).
(1) The anatomical values used for the simulator were: Area of the blood - gas barrier of the lung = 100 m2 (The lung was considered as a single compart-ment; an alveolus with this area of surface) and a 1 m thickness for the alveolar-capillarymembrane.
The following equation was used to determine the flux of CO2 from plasma to the alveolus:
(2) Where:
Dco2 is the constant of diffusion for CO2
Pplco2 is the partial pressure of CO2 in the blood plasma
www.medigraphic.org.mx
volpl is the plasma volume
To determine the concentration of O2 in plasma the following equation was used:
(3) Where:
Do2 is the constant of diffusion for O2
Pplo2 is the partial pressure of O2 in the blood plasma
PAo2 is the partial pressure of O2 in the alveolus
volpl is the plasma volume
The obtained results are measured in millimeters of mercury (mmHg).
The following equation was used to establish the concentration of oxygen combined with hemo-globin:
(4) Is the concentration of oxygen combined with hemoglobin thus it is not proportional to the partial pressure. The results are given in a satura-tion percentage following Kelman’s method. is the diffusion capacity of oxygen in blood P O2
is the partial pressure of oxygen in the erythrocyte. The simulator uses height as an input variable. From altitude partial pressure of oxygen in the al-veolus (PAO2) and in the pulmonary capillarity of the non oxygenated side (PvO2) are calculated. Three physiological conditions are considered: (a) recently arrived subject (no adaptation to the height), (b) acute adaptation, (c) chronic adaptation (acclima-tization). For the acute and chronic adaptation to height the PAO2 and PvO2 were established from the reported values in the available literature12,15,17. An exponential decay function proved to be the best at reproducing the data. For the non adapted condi-tion the PAO2 values are lower than those reported under the conditions of adaptation to high altitude and follow a decay exponential function. The pro-gram calculates the curve of oxygen saturation hemoglobin to the selected height. The maximum of the saturation curve of hemoglobin in the non oxygenated side is related to the PvO2 calculated from the values reported in the literature15. It was considered from the different SaO2 curves that P50 (P50 is the oxygen pressure corresponding to a 50% saturation) decreases as height increases17. This also happens with the highest saturation rates calculated
in the program. For this purpose, it was adjusted a third order polynomial, in a range from 0 to 9,000 m in height. PvO2 values were determined from the transient part of the saturation curve corresponding to venous return18. In the case of acute and chronic adaptation, we used the oxygen saturation curve from oxygen saturation values reported for the dif-ferent heights in both the deoxygenated and the oxygenated sides. In the non adapted scenario, saturation curves are lower than those calculated for acute and chronic adaptation to altitude. Saturation curves were simulated by a sigmoid function. This function fits the data of the saturation hemoglobin curve in a normal adult at sea level (equation 5, generated in the Origin® program). The maximum values of hemoglobin saturation and the mean values (P50) that change with height correspond to the data reported by West15,17.
(5) Where A1, A2, X0 and tx are constant, and PaO2 is the oxygen partial pressure in the not oxygenated side.
This function is able to simulate the oxygen satura-tion curves with a maximum which decreases and a shift of the curve to the right as height increases.
www.medigraphic.org.mx
height between 0 and 8,840 m, this is, from sea level to Mount Everest. To generate a new simu-lated individual for the same height value, the corresponding value for the anatomic conditions changes automatically when you select «Yes» in the «new person» box in the user interface. The anatomic change parameter is modified with a maximum standard deviation of 1.8. The calcu-lated pressures for greater heights are theoretical and correspond to aeronautical conditions which are not considered in this version of the simulator. As there are no «pattern» saturation curves for dif-ferent heights, because each person is difdif-ferent, simulated values were determined from several individuals (n = 15) for each simulated altitude.
In order to validate the simulator operation, we compared the mean and standard deviation of SaO2 simulated values against the mean and standard deviation values obtained clinically and reported in the literature, specifically the work of Botella de Maglia et al19,20.
We compared a group of 214 not acclimatized people with SaO2 measurements in various Spanish mountains and in the Alps up to 4164 m, another group of 209 inhabitants in various Spanish and Bolivian populations up to 4,230 m, that is, in an ac-climated condition, and another group of 8 people in the process of climbing a mountain at an altitude greater than 7,000 m19,20.
Statistical analysis of data was performed with the Origin® program. The comparison of SaO
2 at different heights was made using t-tests with a 0.05 significance value.
RESULTS
Program installation
The simulator is installed through the «setup» file which guides the user step by step to properly install the software.
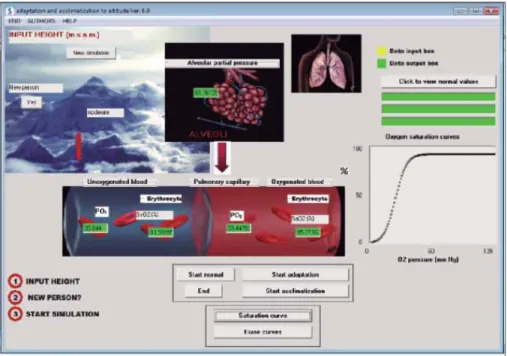
Interface and use of the simulator
Figure 2 shows the user interface. At the top left of the screen there is an outline of Mount Ever-est, with a caption saying «INPUT HEIGHT», below it there’s a box to enter data of the height, an OK button, a small bar that increases or decreases as after introducing the height, and a box show-ing the legend: high, low, moderate or extreme, depending on the height entered. In the middle and top of the screen there’s an outline of the pulmonary alveoli with a box. Inside the box the alveolar oxygen partial pressure (PAO2) calculated in the simulation appears. In the top right, the out-line of a lung which increases its volume emulating breathing at a rate of 12 per minute is shown. On one side there is a button labeled «Click to view normal values» and there are three boxes, located under it, showing the normal values of PAO2, PaO2, and PvO2 at sea level. In the middle of the screen there is a diagram of a pulmonary capillarity di-vided into two boxes: The left side represents the non-oxygenated blood getting to the lungs through the pulmonary artery (which corresponds to the sys-temic venous part) and the right side, the oxygen blood that gets to the heart through the pulmonary veins (which corresponds to the systemic arterial part). On both sides there are two panels show-ing the partial pressure of oxygen in the plasma and the calculated percentage of hemoglobin saturation (PvO2 and SvO2, systemic venous, PaO2 and SaO2, arterial systemic).
Start from windowsExecutable
Help: usage mode (optional) Presentation
End of program
Other events Event start
Variables start
Constant
declaration specificationDomain
Determination of parameters
Analytical solutions functions
Numerical solution of differential
equations
Sample
results end
Graphing functions
www.medigraphic.org.mx
Under this scheme there are four buttons: «Start Normal», «Start adaptation», «Start acclimatization» and «End». Below this buttons, there are two more buttons, one for creating a graph of the saturation curve and the other for deleting it. The right side of the interface displays a window where the saturation curve generated in the simulation is plotted.
Using the simulator
Enter the desired height data for the simulation, and then press the OK button. A bar (located by the photograph of Mount Everest) will change sizes to graphically represent the selected height (Figure 2). The simulator allows for switching of the patient at the same altitude level.
In this version, the simulator opens a window showing a picture of a place or mountain that roughly corresponds to the selected height. The user can review the heights of the highest mountains in the world, the highest countries and some of the cities in Mexico.
For proper use of the simulator it is recommended that for a single individual one first enters the desired height to simulate, and then simulates non accli-mation conditions with the «Start normal» button, then simulates the adaptation (hyperventilation) conditions with the «Start adaptation» button, and finally simulates acclimatization conditions with the «Start acclimatization» button. In each step it is recommended to generate the saturation curve with the «Saturation curve» button. The user can then
compare every condition for the same individual. If the purpose is to identify variables in different individuals for the same height, just press the «yes» button in the new individual box placed in the top left of the user interface. From now on, every time you press the button «Start normal», «Start adapta-tion» or «Start acclimatizaadapta-tion» different values are generated for different individuals.
Simulation results
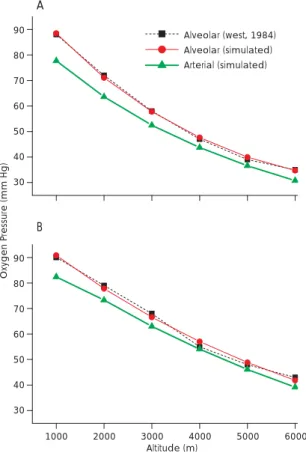
Figure 3 shows the simulation results under acute (3A) and chronic adaptation (3B) conditions to al-titudes in the range 1,000 to 6,000 m. Calculated values of PAO2 (simulated) match the PAO2 reported values by West15 (alveolar reported). It can be no-ticed how during the acclimatization (chronic ad-aptation), PaO2 values are higher than those found for acute adaptation.
Figure 4A shows how the saturation curves in the non-adaptation condition, decrease SaO2 (%) = (97, 92, 87, 74 and 16) with increasing height (0, 2, 4, 6 and 8 thousand meters high) and how they move to the right. Figure 4B shows the saturation curves at 4,500 m in non adapted conditions, in adaptation and in acclimation SaO2 (%) = 37, 40, 49, respectively. It can be observed that the percentage of hemoglobin saturation is increasing.
To validate the simulator SaO2 values in 15 dif-ferent individuals for each height generated by the simulator were compared against experimental data reported earlier by Botella de Maglia et al19,20.
www.medigraphic.org.mx
Reported clinical data were obtained from three groups: (1) non acclimated people (214 measure-ments in various Spanish mountains and the Alps to 4,164 m), (2) 209 inhabitants of the mountains (with measurements in various Spanish and Boliv-ian populations in heights up to 4,230 m), (3) in non-acclimated people climbing to high altitudes
on an expedition to Gasherbrum II (8,035 m) with measurement of SaO2 in camps II and III at 7,500 m, before reaching the summit. In all cases SaO2 measurement was performed by pulse oximetry.
Comparison of simulation with the non-acclimated people
210 simulations were performed using the «Start Normal» button. Different altitudes corresponding to Valencia, Benasque, Valdelinares, Penyagolosa (summit), Valdecastillas (camp), the Renclusa, Portillo Higher Aneto (camp), Aneto (summit), Mul-hacén (summit), Kleines Matterhorn (station), Barre des Ecrins (gap Lory), El Alto (airport) and Breithorn (summit) were used. A wide range of altitude from low (20 m) to high (4,164 m) was explored with these simulations.
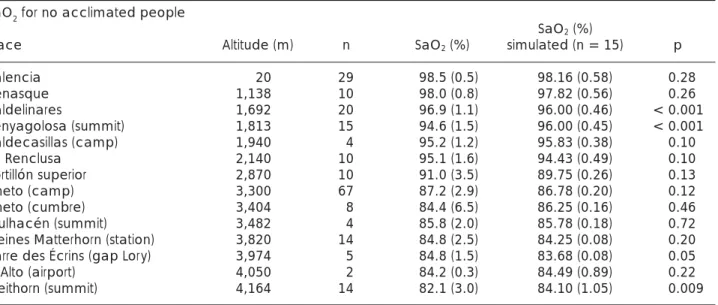
For each height 15 simulations were performed corresponding to 15 different individuals to obtain the mean and standard deviation and they were compared with the corresponding mean and stan-dard deviation reported. As shown in Table 1, there are no statistically significant differences between the clinical value reported and the values gener-ated by the simulator: from 14 simulgener-ated altitudes, 12 values, generated by the simulator, showed no statistically significant differences, only at 1,813 and 4,164 m the estimated value was 2% higher than the reported one.
Comparison of the simulation results with the group of mountain inhabitants
90 simulations were performed using the «Start ac-climatization» button. The generated values corre-spond to reported clinical values for locals. Analyzed altitudes ranging from 1,692 to 4,230 m correspond
100
50
0
100
50
0
0 60 120
02 pressure (mm Hg)
0 60 120
02 pressure (mm Hg)
Oxygen saturation curves Oxygen saturation curves
A B
Figure 4. Shows the satura-tion curves of Hb (%). In (A), from top to bottom shows the saturation curves at 0, 2, 4, 6, 8 (thousands of meters) above sea level. In (B) shows the saturation curves at 4,500 m above sea level. From bot-tom to top: no adaptation, acute adaptation and accli-matization.
90
80
70
60
50
40
30
Alveolar (west, 1984) Alveolar (simulated) Arterial (simulated)
A
B
90
80
70
60
50
40
30
1000 2000 3000 4000 5000 6000 Altitude (m)
Oxygen P
ressure (mm Hg)
www.medigraphic.org.mx
Este documento es elaborado por Medigraphic
to the following locations: Valdelinares, Coroico (Plaza García Lanza), Coroico (Hotel Esmeralda), La Paz (San Ignacio School), El Alto (Airport) and Sajama. As shown in Table 2, in most places (4 out of 6) there are no statistically significant differences between the simulated values and the clinical ones for SaO2. Only for two altitudes (3,315 and 4,230 m) there is a difference of 2 to 3% in oxygen saturation, respectively.
Comparison of the simulation results with the group of climbers ascending to high altitudes
To compare simulated results with those reported clinically in this case, we used the simulation with the «Start Normal» button because it is the ascent of a mountain over 7,000 m.
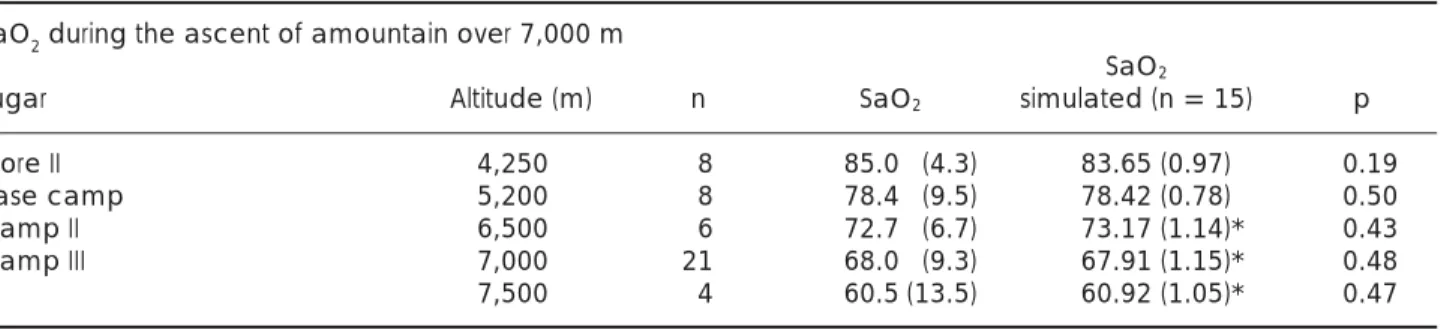
As shown in Table 3, the clinical sampling sites were: Gore II, base camp, Camp II, Camp III and during the ascension up to an altitude of 4,250, 5,200, 6,500, 7,000 and 7,500 m, re-spectively. For altitudes of 4,250 and 5,200 m, values generated using the «Start simulation» button were compared to those reported clini-cally. They show no statistically significant dif-ferences (Table 3). At altitudes corresponding to 6,500, 7,000 and 7,500 m, it was necessar y to simulate hyperventilation conditions («Start adaptation» button). Under these conditions, the simulated results and the reported ones show no statistically significant differences. This results show that man can tolerate the ex-treme hypoxia only by an enormous increase in ventilation.15
Table 1. Simulated and reported oxygen saturation rate in non-acclimated people. Means comparisons show no statistically significant differences in most of the heights.
SaO2 for no acclimated people
SaO2 (%)
Place Altitude (m) n SaO2 (%) simulated (n = 15) p
Valencia 20 29 98.5 (0.5) 98.16 (0.58) 0.28
Benasque 1,138 10 98.0 (0.8) 97.82 (0.56) 0.26
Valdelinares 1,692 20 96.9 (1.1) 96.00 (0.46) < 0.001
Penyagolosa (summit) 1,813 15 94.6 (1.5) 96.00 (0.45) < 0.001
Valdecasillas (camp) 1,940 4 95.2 (1.2) 95.83 (0.38) 0.10
La Renclusa 2,140 10 95.1 (1.6) 94.43 (0.49) 0.10
Portillón superior 2,870 10 91.0 (3.5) 89.75 (0.26) 0.13
Aneto (camp) 3,300 67 87.2 (2.9) 86.78 (0.20) 0.12
Aneto (cumbre) 3,404 8 84.4 (6.5) 86.25 (0.16) 0.46
Mulhacén (summit) 3,482 4 85.8 (2.0) 85.78 (0.18) 0.72
Kleines Matterhorn (station) 3,820 14 84.8 (2.5) 84.25 (0.08) 0.20
Barre des Écrins (gap Lory) 3,974 5 84.8 (1.5) 83.68 (0.08) 0.05
El Alto (airport) 4,050 2 84.2 (0.3) 84.49 (0.89) 0.22
Breithorn (summit) 4,164 14 82.1 (3.0) 84.10 (1.05) 0.009
Table 2. Simulated and reported arterial oxygen saturation in acclimated individuals. It is noted that there are no statistically significant differences in most of the heights.
SaO2 for inhabitants of the mountains
SaO2 (%)
Place Altitude (m) n SaO2 (%) simulation (n = 15) p
Valdelinares 1,692 12 97.6 (0.4) 97.78 (1.05) 0.27
Coroico (plaza García Lanza) 1,760 50 97.7 (1.0) 97.13 (1.18) 0.04
Coroico (hotel Esmeralda) 1,815 10 97.4 (0.9) 97.02 (0.86) 0.20
La Paz (colegio San Ignacio) 3,315 65 94.2 (2.1) 92.00 (1.10) < 0.001
El Alto (airport) 4,050 10 92.1 (2.6) 91.50 (1.04) 0.24
www.medigraphic.org.mx
DISCUSSIONThe simulator reproduces the lung function (steady state) of an individual, without supplemental oxygen at low altitudes, up to moderate, high and extreme altitude. The simulation of the adaptation and ac-climatization processes match the reported data in the literature by Botella de Maglia et al19,20 For the differential equations solution, the Euler method was sufficient. Other numerical methods were not considered here since the purpose of the simulator wasn’t to test the accuracy of different methods.
The results show that the generated simulations with the «Start Normal» button produce SaO2 val-ues very close to the clinically measured valval-ues in individuals in a non-acclimation condition (in most cases there are no statistically significant differ-ences).
The obtained simulations with the «Start acclima-tization» button correspond to SaO2 values reported for people living at different altitudes. In most cases, no statistically significant differences were found.
SaO2 values simulated predicted values reported with 95% probability. In cases where there are sig-nificant statistical differences the error was 2 to 3%. These errors are similar to those reported when com-paring data from subjects in a hypobaric chamber versus those reported at different heights this is because of the considerable individual variability.
The simulation results in the group of non-acclimated condition while climbing to extreme heights predicted hyperventilation, as it is clinically examined on individuals. We report these results in the extreme heights and it is confirmed by the simulator. West15 report these results in the extreme heights and it is confirmed by the simulator.
We conclude that the simulator calculates prop-erly the various saturation curves corresponding to any height (until 8840 m).
ACKNOWLEDGEMENTS
We thank the Programa Institucional de Fortaleci-miento a la Capacidad Académica 2009 for the support given to this publication. We thank Albert Stefan Nijboer for English revision.
REFERENCES
1. Moore LG, Niermeyer S, Zamudio S. Human adaptation to high altitude: regional and lifecycle perspectives. Am J Phys Anthropol 1998; Suppl 27: 25-64.
2. West JB, Readhead A. Working at high altitude: medical problems, misconceptions, and solutions. Observatory 2004; 124: 1-14.
3. Richalet JP, Donoso MV, Jiménez D, Antezana AM, Hudson C, Cortés G et al. Chilean miners commuting from sea level to 4,500 m: a prospective study. High Alt Med Biol 2002; 3: 159-66.
4. Droma Y, Hanaoka M, Basnyat B, Arjyal A, Neupane P, Pandit A et al. Symptoms of acute mountains sickness in sherpas exposed to extremely high altitude. High Alt Med Biol 2006; 7: 312-314.
5. Huicho L, Niermeyer S. Cardiopulmonary pathology among children resident at high altitude in tintaya, Peru: A cross-sectional study. High Alt Med Biol 2006; 7: 168-179. 6. American Thoracic Society. Standardization of spirometry.
Am J Respir Crit Care Med 1995; 152: 1107-1136.
7. Milhorn HT, Benton R, Guyton AC. A mathematical model of the human respiratory control system. Biophys 1965; 5: 27-44. 8. West JB. Blood flow to the lung and gas exchange. Anesthesiol
1972; 54(4): 124-138.
9. Botsis T, Mantas J. Mathematical modelling for the study of respiratory mechanics. Stud Health Technol Inform 2003; 95: 9-14.
10. Dickinson CJ. A digital computer model to teach and study gas transport and exchange between lungs, blood and tis-sues (“MacPuf”). J Physiol (London) 1972; 224: 7-9. 11. Hardman JG, Bedforth NM, Ahmaed AB, Mahajan RP,
Aitken-head AR. A physiology simulator: validation of its respiratory components and its ability to predict the patient’s response to changes in mechanical ventilation. Br J Anaesthesia 1998; 81: 327-332.
12. West JB. The physiologic basic of high altitude diseases. Ann Intern Med 2004; 141: 789-800.
13. Smith C, Dempsey J, Hornbein T. Control of breathing at high altitude. In: Hornbein T, Schoene R, editors, High Altitude: An Table 3. Comparison of oxygen saturation percentage reported in the literature against the simulated one. It is noted that there are no statistically significant differences. At higher altitudes hyperventilation was simulated.
SaO2 during the ascent of amountain over 7,000 m
SaO2
Lugar Altitude (m) n SaO2 simulated (n = 15) p
Gore II 4,250 8 85.0 (4.3) 83.65 (0.97) 0.19
Base camp 5,200 8 78.4 (9.5) 78.42 (0.78) 0.50
Camp II 6,500 6 72.7 (6.7) 73.17 (1.14)* 0.43
Camp III 7,000 21 68.0 (9.3) 67.91 (1.15)* 0.48
7,500 4 60.5 (13.5) 60.92 (1.05)* 0.47
www.medigraphic.org.mx
exploration of human adaptation, Marcel Dekker AG (New York), 2001: 139-173.
14. Wu T, Kayser B. High altitude adaptation in tibetans. High Alt Med Biol 2006; 7: 193-208.
15. West JB. Human physiology at extreme altitudes on Mount Everest. Science 1984; 223: 784-788.
16. West JB. Barometric pressures on Mt. Everest: New data and physiological significance. J Appl Physiol 1999; 86: 1062-1066.
17. Wagner PD, Wagner HE, Groves BM, Cymerman A, Houston CS. Hemoglobin P50 during a simulated ascent of Mt.
Ever-est, operation Everest II. High Alt Med Biol 2007; 8: 32-4. 18. Boyle J. A microcomputer program of pulmonary and tissue
gas exchange. Ann Biomed Eng 1986: 425-435.
19. Botella de Maglia J, Compte-Torrero L. Saturación arterial de oxígeno a gran altitud. Estudio en montañeros no aclimata-dos y en habitants de alta montaña. Med Clin 2005; 124(5): 172-176.